Energy Storage in the Emerging Era of Smart Grids Part 5 docx
Bạn đang xem bản rút gọn của tài liệu. Xem và tải ngay bản đầy đủ của tài liệu tại đây (7.22 MB, 30 trang )
6.3.3 Analysis of experimental data for voltage stored and energy efficiency
7. Discussion and conclusion 8. References
Proceedings of National Power and Energy Conference, (PECon 2003),
Canadian Conference on
Electrical and Computer Engineering, (CCECE ’06)
Proceedings of the IEEE
IEEE Transactions on Industry Applications,
International Conference on Power System Technology, (PowerCon
2006),
IEEE
Aerospace and Electronic Systems Magazine,
IEEE/PES Transmission and Distribution Conference and Exposition,
IEEE Transactions on Power Electronics,
Power System Technology, 2006. PowerCon 2006. International
Conference on.
.
Power Electronics Specialists
Conference, 2008. PESC 2008. IEEE
Power Electronics Specialists Conference, 2004. PESC 04. 2004 IEEE 35th
Annual.
12th Symposium on Electromagnetic
Launch technology, IEEE Transactions on,
6
Fabrication and Characterization
of MicroPCMs
Jun-Feng Su
Institute of Materials Science and Chemical Engineering,
Tianjin University of Commerce,
P. R. China
1. Introduction
The increasing gap between the demand and supply of energy is an essential problem
affecting the globe climate and economy. Energy efficiency improvement is one approach to
reduce the mismatch between supply and demand. Energy conservation can be achieved
through increased efficient energy use, in conjunction with decreased energy consumption
and/or reduced consumption from conventional energy sources. Thermal energy
conservation is easy to realize by storing thermal energy as latent heat in which energy is
stored when a substance changes from one phase to another by either melting or freezing.
The temperature of the substance remains constant during phase change. Phase change
materials (PCMs) include organic (e. g. paraffin), inorganic (e. g. salt hydrates) and salt
eutectics (e. g. CaCl
2
·MgCl
2
·H
2
O) have been widely studied and applied in energy saving
field. A good design for the PCMs requires that their phase-change processes, especially the
melting and solidification processes perform in a container. It is also proposed that the heat
transfer rate between PCM and source/sink can be increased by using microencapsulated
PCMs (microPCMs). The reason is that the small microPCMs provide larger heat transfer
area per unit volume and thus higher heat transfer rate. Moreover, the microPCMs bring in
more advantages like less reaction of PCM with matrix material, ability to withstand volume
change during phase change, etc.
To date, microPCMs have two application approaches: in emulsion and in solid matrix.
Emulsion containing microPCMs can be used as thermal exchange medium to enhance the
energy efficiency of thermal exchanger. MicroPCMs are widely applied in solid matrix as
smart thermal-regulation composites, such as fibers, construction materials, blood
temperature-controlling materials and anti-icing coats.
This chapter summarized our published works on fabrication and characterization of
microPCMs, including shell compactability enhancement, thermal and chemical stability
improvement, heat conductivity accelerating and phase change behavior controlling.
Styrene-maleic anhydride (SMA) copolymer solid was used as a nonionic dispersant. These
microPCMs have been applied in energy saving fields.
In addition, the strength of the bond at the microcapsule/matrix interface controls the
fatigue life of the composites significantly. So by controlling the stress-strain response and
ductility of the interface region, it is possible to control overall behavior of the composites.
We applied a methanol-modified process to enhance the banding of microPCMs and the
Energy Storage in the Emerging Era of Smart Grids
112
polymer matrix. The interface morphologies were investigated systemically to understand
the effects of the average diameters, contents and core/shell ratios of microPCMs on the
interface stability behaviors.
2. Fabrication and characterization MF-shell microPCMs
Melamine-formaldehyde (MF) resin [1, 2], urea-formaldehyde (UF) resin [3, 4] and
polyurethane (PU) [5-7] were usually selected as microcapsule shell materials for the PCMs
protection. In practical usages of microPCMs, the volume of PCM in shells will change
obviously during absorbing and releasing thermal energy. The volume alternant changes
original bring the liquefied PCMs leaking from the microcapsules. And the breakage of the
shell will happen based on the mismatch of thermal expansion of the core and shell
materials at high temperatures [5]. Thus, it is necessary to keep the shell stability and
compact for a long-life with less cracks and lower permeability.
MF resin has been successfully applied as shell material of microcapsules in fields of
carbonless copying paper, functional textiles, liquid crystals, adhesives, insecticides and
cosmetics [8]. Furthermore, literatures have showed that MF has been applied for
microPCMs encapsulating various solid-liquid PCMs with the size range of about 50 nm to 2
mm. Generally, MF resin is adsorbed and cured on surfaces of core particles though an in-
suit polymerization with the help of a polymeric surfactant.
2.1 Materials and fabrication method
Styrene maleic anhydride copolymer solid (SMA, Scripset
®
520, Hercules, USA) was used as
a dispersant. A small percentage of the anhydride groups have been established with a low
molecular weight alcohol and it is fine, off-white, free flowing power with a faint, aromatic
odor. Nonionic surfactant, NP-10 [poly (ethylene glycol) nonylphenyl] getting from Sigma
Chemical was used as an emulsifier. The pre-polymer of melamine-formaldehyde (MF)
resin which solid content was 50±2wt. %, was purchased from Shanghai Hongqi. Chem.
Company (Shanghai, China). The n-octadecane purchased from Tianjin Fine Chemical
Company (Tianjin, China) was encapsulated as the core material. All other chemical
reagents were analytical purity and supplied by Tianjin Kermel Chemical Reagent
Development Center (Tianjin, China).
Microcapsulation by coacervation proceeds along three main steps:
1. Phase separation of the coating polymer solution. SMA (10. 0 g) and NP-10 (0. 2 g) were
added to 100 ml water at 50 ºC and allowed stir for 20 min. And then a solution of
NaOH (10%) was added dropwise adjusting its pH value to 4-5. The above surfactant
solution and n-octadecane (32 g) were emulsified mechanically under a vigorous
stirring rare of 3000 r·min
-1
for 10 min using a QSL high-speed disperse-machine
(Shanghai Hongtai Ltd, Shanghai, China. ).
2. Adsorption of the coacervation around the core particles. The encapsulation was carried
out in a 500 ml three-neck round-bottomed flask equipped with a condensator and a
tetrafluoroethylene mechanical stirrer. The above emulsition was transferred in the
bottle, which was dipped in steady temperature flume. Half of MF pre-polymer (16 g)
was added dropwise with a stirring speed of 1500 r·min
-1
. After 1h, the temperature
was increased to 60 ºC with a rate of 2 ºC·min
-1
. Then another half of pre-polymer (16 g)
was dropped in bottle at the same dropping rate.
Fabrication and Characterization of MicroPCMs
113
3. Solidification of the microparticles. Then the temperature was increased to 75 ºC. After
polymerization for 1h, the temperature was decreased slowly at a rate of 2 ºC·min
-1
to
atmospheric temperature.
At last, the resultant microcapsules were filtered and washed with pure water and dried in a
vacuum oven. In addition, we could control the average diameter of microcapsules by
stirring speed. Also, the OSC microPCMs was fabricated in this work according to the above
process by adding the same amount (32 g) prepolymer shell material in one step.
2.2 Mechanism of TSC
Hydrolyzed SMA is a kind of polymeric surfactant that is soluble in water but sufficiently
amphiphilic to be absorbed by surfaces and interfaces, particularly by dispersed solid or
liquid phases [9]. In addition, hydrolyzed SMA plays two important roles during the
formation of microcapsules: dispersant and anionic polyelectrolyte [10, 11].
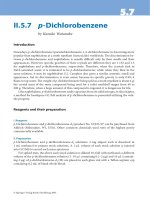
Fig. 1. Sketch mechanism of the fabrication process to TSC microcapsules: (a) Chemical
structures of styrene maleic anhydride (SMA) alternating copolymer and hydrolysis
polymer, (b) the structure of a TSC microcapsule, (c) the process of fabrication
microcapsules by TSC.
Energy Storage in the Emerging Era of Smart Grids
114
Fig. 1 illustrates the complex TSC process for forming the microcapsules. Fig. 1(a) depicts
the chemical structure of styrene-maleic anhydride (SMA) and hydrolysis polymer. As a
kind of polymer dispersant, SMA molecules will be hydrolysis by NaOH and then the –
COO group insert and directional arrange on oil droplet surface. In Fig. 1(b), hydrophilic
groups of carboxyl arrange alternatively along the backbone chains of SMA molecules.
When hydrolyzed SMA molecules are adsorbed at the interfaces of oil droplets, it is easy for
the molecules to have such directional arrangement with hydrophobic groups oriented into
oil droplet and hydrophilic groups out of oil droplet. This kind of molecular arrangement
brings results in a relatively strong electron negative field on the surface of oil particles.
Anionic polyelectrolyte hydrolyzed SMA has anionic carboxyl groups that can interact with
positively charged MF-prepolymer below the ζ potential. The MF-prepolymer was affinities
on these particulates by static. Then, the reaction of microencapsulation took place under
acid and heat effect on the surface of oil particles of emulsion, which formed membrane of
capsule in such a way. Fig. 1(c) shows the formation process of the TSC by another
prepolymer (MF) addition at a slowly rate. Also, under the effect of heat the second
coacervation will cross-linked to form another part of shells. That can be concluded that the
twice-addition prepolymer and twice increasing-decreasing temperature courses lead to
compact shells.
2.3 MicroPCMs in emulsion
In order to bring the coacervation process to a clear understanding, optical
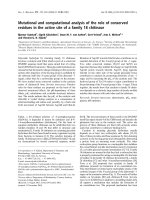
microphotographs of microcapsules were taken to illuminate the details. Fig. 2 (a-b) show
optical microphotographs of core material dispersed by hydrolyzed SMA after 5 min and
10 min at room temperature. At the beginning 5 min, the hye size distribution of drolyzed
SMA dispersed the core material into particles. However, these particles had not been
separated each other directly due to the molecule linkage of the hydrolyzed SMA. Being
emulsified for 10 min, the core particles were separated through the regulation of
hydrolyzed SMA molecules.
In previous study [12], we have drawn a conclusion that the average diameter of 1μm-5μm,
fabricated under stirring speed of 3000 r·min
-1
, is the perfect range of size insuring both of
narrow size distribution and enough rigidity. Based on the experiment, MF prepolymer (32
g) was dropped into the above emulsion with a stirring speed of 3000 r·min
-1
. The
prepolymer cured on core particles in 60 min by increasing the temperature to 60 ºC slowly
at a rate of 2 ºC·min
-1
. Fig. 2(c) shows the optical microphotographs of microcapsules with
fleecy or pinpoint morphologies. Imaginably, these incompact structures may lead cracking
or releasing of core material such as Fig. 2 (d) showing.
Compared with OSC microcapsules, Fig. 2(e) shows the optical microphotograph of TSC
ones. The prepolymer covered on particles without cracks and thparticles is uniform with
global and distinct shape. Moreover, there is nearly no conglutination between each
microcapsule in very stability solution system.
2.4 SEM morphologies of shells
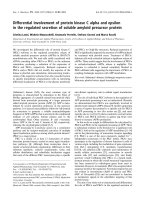
Fig. 3(a) shows SEM morphology of dried OSC microcapsules with the size of 1-5 μm. These
microcapsules have a rough morphology and a little polymer occupies the interspaces of
microcapsules. It can be contributed to the unencapsulated core material and the uncovered
shell material. Especially, the surfaces have many protrusions, which may be occurred by
Fabrication and Characterization of MicroPCMs
115
Fig. 2. Optical microphotographs of microcapsules: (a) core material dispersed by
hydrolyzed SMA in water for 5 min; (b) core material dispersed by hydrolyzed SMA in
water for 10 min; (c) microcapsules by OSC; (d) a crack OSC microcapsule (e) microcapsules
by TSC.
5um
a
b
c
d
e
5um
5um
5um
5um
Energy Storage in the Emerging Era of Smart Grids
116
not completely cross-linking or high-speed chemical reaction. In images Fig. 3(b-c) (×10000),
it is clearly that the surfaces of microcapsules seem to be coarse and porous. Interestingly,
there is a depressed center on a microcapsule reflecting the lower rigidity of shell in Fig.
3(d). We may draw a conclusion from these defects that OSC could not achieve a perfect
coacervation on cores slowly and tightly in enough time under condition of mass shell
material. Fig. 3(e) reflects the surface morphologies of piled microcapsules fabricated by
TSC. It appears that nearly all these smooth microcapsules have a diameter about 2 μm with
regularly globe shape. Moreover, not only there is nearly no concavo-convex and wrinkle in
bedded in shell surfaces, but also little polymer is pilling between piled microcapsules.
From these results, it could be imaged that the method of twice-dropping prepolymer has
decreased the roughage through molecules regulation of the second-dropped polymer. At
the same time, the flaws may be decreased by padding the second cross-linking on the
previous coacervation.
Fig. 3. SEM photographs of microcapsules dried in a vacuum oven at 40 ºC for 24 h, (a) (b)
surface morphology of piled OSC microcapsules, (c) (d) the rough surface morphology of
OSC microcapsules, (e) surface morphology of piled TSC microcapsules, (f) cross section of
TSC microcapsules.
2.5 Density and thickness of shells
Density and thickness of shells are useful parameters reflecting the compactness of shells.
Originally, the thickness data can be measured from cross-section of SEM images as shown in
Fig. 3(f). In this study, a series of microcapsules were fabricated with various weight ratios of
Fabrication and Characterization of MicroPCMs
117
core (32 g) and shell materials from 1. 0 to 2. 0 (core: shell) by two kinds of coacervation
methods to evaluate encapsulation effect. All the microcapsules had the same preparation
materials and environmental conditions. At least of fifty shells for each sample were measured
and the average data was recorded by a MiVnt Image analyze system automatically.
From the data in Fig. 4(a), it shows that the thickness of OSC and TSC shells are both
decreased with the increasing of value of weight ratios. And at the same weight ratios, all
the thickness of TSC shell is less than that of OSC. This may be attributed to two aspects.
Firstly, the TSC may decrease the structure defects, such as holes and caves. Secondly, this
method of TSC allows the prepolymer to regulate their molecules on core material with
enough reaction time for higher cross-linking density.
The data of density affected by various weight ratios are shown in Fig. 4(b). At the same
weight ratio of 1. 0, the densities of OSC and TSC are 1. 75 g/cm
3
and 1. 67g/cm
3
,
respectively. With the increasing of weight ratio, both densities of OSC and TSC shells are
decreased. And at the weight ratio point of 2. 0, both kinks of microcapsules have nearly
shell density of 1. 58 g/cm
3
.
1.0 1.2 1.4 1.6 1.8 2.0
1.56
1.58
1.60
1.62
1.64
1.66
1.68
1.70
1.72
1.74
1.76
b
Thickness (um)
Density (g/cm
3
)
Weight Ratio (Core:Shell)
Two-step coacervation
One-step coacervation
1.0 1.2 1.4 1.6 1.8 2.0
0.4
0.5
0.6
0.7
0.8
0.9
1.0
1.1
1.2
a
One-step coacervation
Two-step coacervation
Fig. 4. The Data of shell thickness and density fabricated by OSC and TSC with carious core
and shell weight ratio.
2.6 Shell stability in water
Usually, we may simply evaluate the compactability and stability of shell by observing the
morphologic changes of shell in water during different times. This method will be helpful to
understand the structures of shells. In this study, dried microcapsules with diameter of 1μm
were applied for convenience to indicate the endurance of shells in water by means of TEM.
Fig. 5 (a-b) show the dried OSC microcapsules after immersed in water for 60 min and 120
min respectively. It is found clearly that the microcapsules are not spherical in shape
because of absorbing water. And after 150 min, the polymer shell peeled off from the core
Energy Storage in the Emerging Era of Smart Grids
118
particles as shown in Fig. 5(c). The peeled shells are in spreading state and the core material
has been separated without covering. We show particular interest to Fig. 5(d) depicting the
compact TSC microcapsules after immersed in water for 150 min. Not only the capsules still
keep the original global sphere and size nearly without peeling and expansion, but also the
core material is safely protected avoiding releasing.
By referring back to Fig. 2 and Fig. 3, these above results are understandable in view of
molecular structure of shells. When hydrolyzed SMA molecules were absorbed at the
interfaces of the oil particles, the molecules had directional arrangement with hydrophobic
groups oriented into oil droplet. It was easy for water to permeate in the shells through
cracks and capillary. The force of interface adhesion between core and shell would reduce
due to the static electricity force decreased by the effect of water molecular. Then, OSC
microcapsules were swelled and destroyed with the time prolongation. Comparatively, shell
of TSC microPCMs had less cracks and capillary, which also decreased the effect of water
molecular.
Fig. 5. TEM photographs of microcapsules in water, (a) OSC microcapsules in water for
30 min, (b) OSC microcapsules in water for 60 min, (c) OSC microcapsules in water for 90
min, (d) TSC microcapsules in water for 90 min.
2.7 Thermal stability of microcapsules
Fig. 6 shows thermogravimetric (TGA/DTG) curves of microcapsules prepared during
various coacervation times. The blue and red lines are curves of TGA and DTG curves. Both
axis of left and right are residual weight (%) of TGA curves and lose weight ratio of DTG
curves. The microcapsules were decomposited with increasing temperature according to
presenting residual weight (%). The curves may reflect thermal stability and structure of
polymeric shell. Fig. 6 (a) shows that pure n-octadecane lost its weight at the beginning
Fabrication and Characterization of MicroPCMs
119
temperature of 137 ºC and lost weight completely at 207 ºC. In order to know the
compactness of encapsulation effect, we compare TGA curves of the OSC microcapsules
fabricated by prepolymer dropping rates of 0. 5 ml·min
-1
(Fig. 6b) and 1. 0 ml·min
-1
(Fig. 6c).
Contrastively, both kinds of OSC microcapsules containing n-octadecane lost weight rapidly
at the temperature of 100 ºC. The lost weight in the beginning may be some water and other
molecule ingredients. And then the weight decreased sharply from 160 to 350 ºC because of
the cracking of shells. The weight-loss speed of microcapsules was distinctly less than that
of pure n-octadecane. Though it indicates that the OSC method can encapsulate the core
material, we can draw a conclusion that the lower dropping speed of shell material has little
effect on improving the shell compactness.
Fig. 6. TGA and DTG curves for (a) pure core material, (b) OSC microcapsules, (c) TSC
microcapsules, made by 1. 0 ml·min
-1
dropping rate of the second adding prepolymer, (d)
TSC microcapsules, made by 0. 5 ml·min
-1
dropping rate of the second adding prepolymer.
Fig. 6(d) shows TGA curve of the expected TSC microcapsules fabricated with dropping
shell material speed of 0. 5 ml·min
-1
. It losses weight between 200 ºC to 400 ºC. We also find
that the beginning temperature of of TSC is higher than that of OSC, which proves that the
method of TSC has a better effect on protecting of core material.
2.8 Permeability of microPCMs
Release rate depends largely on the polymer structure of shells, which in turn is influenced
by the conditions employed in preparation. A typical SEM morphology of microcapsules
after releasing is shown in Fig. 7. The arrows sign a broken shell-structure formed during
releasing process. Moreover, the weight ratio of core and shell will greatly affect the
permeability. For example, we have discussed that penetrability of microPCMs with average
diameter 5 μm is lower than that of 1. 5 μm. And their penetrability with mass ratio of 1:1
(core:shell) is lower than that of 3:1 and 5:1 under the same core material emulsion speed
Energy Storage in the Emerging Era of Smart Grids
120
[12]. Considering the above results, only one kind of microPCMs fabricated with mass ratio
of 1:1 and diameter of 5 μm were selected in this study to simplify the relationship between
the fabrication process and the permeability. In addition, there different shell-structures
were fabricated by controlling of pre-polymer dropping speeds of 0. 5, 1. 0 and 2. 0 ml·min
-1
,
respectively.
Fig. 7. A typical SEM morphology of broken microcapsules during releasing.
Fig. 8 shows curves of relationship between the percentage residual weight (wt. %) of core
material in microcapsules and the time course of the transmittance. Five systems, coded as
A-F, were measured in extraction solvent. The systems correspond to the following
conditions of coacervation method and prepolymer dropping speed: A(■) OSC,
2. 0 ml·min
-1
; B(●) OSC, 1. 0 ml·min
-1
; C(▲) OSC, 0. 5 ml·min
-1
; D(□) TSC, 2. 0 ml·min
-1
; E(○)
TSC, 1. 0 ml·min
-1
and F(∆) TSC, 0. 5 ml·min
-1
, respectively. Although the resultant
microcapsules had been filtered and washed with water, there was a little un-encapsulated
n-octadecane and other fabrication materials attaching on shells. Therefore, the initial
transmittances in media are 98%, 98%, 98%, 97% and 99%, which were nearly equality
values. The rate of permeation of OSC microcapsules shell decreases in the order of system
A, B and C. It can be concluded that the shell pre-polymer dropping rates affect the
penetrability directly. The total PCM permeated time from shells is just in 45 min of system
A, comparing to 90 min of system B and 125 min of system C. Especially, the release profile
of system A is directly just in one step, but systems of B and C have multi-steps.
Comparatively, the rates of permeation of TSC microcapsules decrease in the order of
system D, E and F with multi-steps. At the same time, the rate of permeation of TSC is all
less than that of OSC even at same dropping rate. Moreover, the data in systems of D, E and
F nearly do not change in the beginning 50 min, and system of F begins to change rapidly at
the time of 90 min.
The reason of above-mentioned phenomena may be attributed to two aspects. One is that
the pre-polymer concentration in solution determined by the dropping rate, will affects the
shells formation speed. Under rapider dropping rate, the shell will be formed faster with
enough shell material, which brings disfigurements, such as micro-crack, micro-cavity and
Fabrication and Characterization of MicroPCMs
121
capillary on shells. These disfigurements will lead the core material to penetrate with low
resistance. Contrarily, shells will form slowly under the situation of low pre-polymer
concentration in solution. The pre-polymer molecules will adhere on core particles
compactly. On the other hand, the channels and disfigurements of penetration in shells were
decreased by the twice-dropping fabrication method. The core material penetrates the TSC
shells need longer distance and more time. Thus, system of F presents the best resistance of
core material.
-20 0 20 40 60 80 100 120 140 160 180 200
55
60
65
70
75
80
85
90
95
100
Residual Weight (%)
Time
(
min
)
A
B
C
D
E
F
Fig. 8. Curves of the percentage residual weight (%) of core material in microcapsules in
extraction solvent. The systems correspond to the conditions of coacervation methods and
prepolymer dropping speed: A (■) OSC, 2. 0 ml·min
-1
; B(●) OSC, 1. 0 ml·min
-1
; C(▲) OSC,
0. 5 ml·min
-1
; D(□) TSC, 2. 0 ml·min
-1
; E(○) TSC, 1. 0 ml·min
-1
and F(△) TSC, 0. 5 ml·min
-1
.
2.9 Permeability coefficient of the shell (k)
1ml of pure water suspension with the percentage weight of dried microPCMs being 10%
was spread homogeneously with a wire bar on a polyethylene terephthalate (PET) film. Poly
(vinyl alcohol) (PVA) played a role of a binder between the PET film and the microcapsules.
The film was cut into squares of 1cm × 1cm. The squire films were soaked in to glass vessels
containing 30 ml of ethyl alcohol with a density of 0. 97 g·ml
-1
. The glass vessels were sealed
avoiding volatility and with light stirring at a room temperature. The penetration property
of different microcapsules was evaluated by an UV/visible spectrophotometry in ethyl
alcohol. From changes of transmittance of light, we got the core material penetrating time
and the residual weight (%) of core material. In this process, the optical density (OD) of the
dispersing medium was measured and converted into the concentration of n-octadecane
using a calibration curve,
0
0
Residual wei
g
ht (%) 100%
t
OD OD
OD
−
=× (1)
where OD
0
is the optical density of all encapsulated core material in ethyl alcohol, OD
t
is the
optical density of encapsulated core material in ethyl alcohol at a permeation time (t).
Energy Storage in the Emerging Era of Smart Grids
122
Generally, the kinetic theory of penetrability is determined by the structure and
characteristic of shell. Fundamentally, by comparing the permeability coefficient of the
shells (k), the minimum can be chosen fabricated by different preparation processes. Most of
release properties observed in experiments have been analyzed by kinetic theories based on
Fick’s Law with an assumption that the release rate is proportional to the concentration
gradient of solutes [13, 14]. As each microcapsules system has different structure shell and
core material, it is considered to be complex system [15] and required to employ different
strict treatment to understand the release mechanism and to characterize such complex
system clearly. In this study, we expect to get the compatible kinetic theory applied to the
transfer of n-octadecane out of the TSC shell though the release curves of microcapsules in
20 wt. % ethanol.
-20 0 20 40 60 80 100 120 140 160 180 200
-0.25
-0.20
-0.15
-0.10
-0.05
0.00
a
Log (Residual weight ratio )
Time (min)
0 15 30 45 60 75 90 105 120 135 150 165 180
-0.18
-0.16
-0.14
-0.12
-0.10
-0.08
-0.06
-0.04
-0.02
0.00
b
b
a
Log (Residual weight ratio )
Fig. 9. The release curves of the OSC (a) and TSC (b) shells prepared by pre-polymer
material dropping rates of 0. 5 ml·min
-1
.
Fabrication and Characterization of MicroPCMs
123
Fig. 9 shows the release curves of systems of C and F. It is linear relationship between time
and logarithmic residual weight of core of system C in Fig. 9(a). Linear regression fit the
first-order kinetic release theory,
2.303log /
mc
qqkt
∞
= (2)
where q
mc
is the residual weight of core material at time t; q
∞
is the total weight of core
material. The calculated value of k
1
is,
3
1
2.625 10k
−
=− × (3)
Fig. 9(b) shows the release curve of system F with a two decrease-linear step (line a and b)
after curve regression. Lines of a and b separate at the release time of 90 min and the release
rate of first step is lower that the of the second step. The TSC shell release curve of n-
octadecane has a special release behavior, which reflects a complex shell structure.
According calculation of equation (3), the value of k
2
and k
3
are,
4
2
3.333 10k
−
=− × (4)
4
3
5.8333 10k
−
=− × (5)
By comparing the values of k
1
, k
2
and k
3
, it shows
123
kkk>> (6)
3. Fabrication and characterization MMF-shell microPCMs
To date, microPCMs/polymer composites have been paid more attentions applying their
thermo-regulation or thermo-saving abilities. A survey of literature shows that these
composites are smart functional materials, such as thermosmart fibers, heat preservation
building materials, solar heating materials and anti-icing coating, et al [16-19]. Although
lots of investigations have been carried out, these composites have not yet been explored
to a significant extent. Nearly all researches focused on the themes of selecting of PCMs,
encapsulation methods, microPCMs characterization and thermal properties. However,
we still have little knowledge about the interfacial morphology changes between
microPCMs and matrix polymers, which will greatly affect the stability of microPCMs.
Fig. 10 illustrates the mechanism of the interfacial morphology changes between
microPCMs and matrix polymer. During a repeated phase change process with heat
transmittance in application for microPCMs/polymer composites, expansibility will
appear coming from both of microcapsules and polymeric resin with difference inflation
coefficients. The volume of microPCMs can be affected by the encapsulated PCM when
environmental temperature changes. Moreover, the above phenomena may occur micro-
cracks or fractures in matrix resin during heat absorbing and resealing; then these
structures may spoil the thin shells of microcapsule (broken or ruptured), the
encapsulated PCM will lose the shells protection [20]. Hence, the mechanical properties of
composites will decrease following with the internal cracks or microcapsules rupture [21].
Energy Storage in the Emerging Era of Smart Grids
124
These entire interface changes certainly influence and shorten the service-life of these
microPCMs/polymer composites [1].
It can be imaged from Fig. 10 that the encapsulated PCMs characteristics, microPCMs shell
properties (thickness, intension and average diameter), matrix and the interfacial adhesion
structures (microPCMs and matrix) are four main factors affecting the interfacial stability of
microPCMs/polymer composites. To simplify this complex problem in this study, the shell
property could be regarded as the only one characteristic being considered because of the
microPCMs/polymer composites with the same shell and matrix materials. Normally, the
microcapsule shell properties are determined by the weight ratios of core and shell materials
and emulsification rates [22].
Fig. 10. Illustration of the mechanism of the interfacial morphologies changes between
microPCMs and matrix polymers after repeated heat transmittance.
Based on these considerations, the purpose of this work was to fabricate novel microPCMs
containing dodecanol by an in-situ polymerization using methanol-modified melamine-
formaldehyde (MMF) as shell material and investigate the interfacial morphologies changes of
microPCMs/epoxy composites treated with a simulant thermal process with a 10-times rapid
temperature variation. A series of microPCMs with different core material (dodecanol)
contents and diameters were prepared and embedded in epoxy resin to investigate the
interfacial phenomena generated by the expansion or shrinking of the microPCMs during
temperature change. Under this simulant and controlled thermal treatment conditions, the
affects of average diameters and PCMs ratios of microPCMs on the interface morphologies of
microPCMs/epoxy composite were analyzed applied the scanning electron microscopy
(SEM). We believe these results will be guides for the fabrication and application of these
functional composites.
3.1 Fabrication method
Dodecanol (Tianjin Kemel Chemical Reagent Development Center, Tianjin, China) was used
as the PCM (core material). Its solid-liquid phase change temperature was about 21 ºC. The
Fabrication and Characterization of MicroPCMs
125
shell material was prepolymer of melamine-formaldehyde modified by methanol (Solid
content was 78. 0%, Aonisite Chemical Trade Co. , Ltd. , Tianjin). Styrene maleic anhydride
(SMA) copolymer (Scripset
®
520, USA) was applied as dispersant. Organic diluent (Butyl
glycidyl ether), bisphenol-A epoxy resin (E-51) and curing agent (amine) were supplied by
Tianjin Synthetic Material Research Institute (Tianjin, China).
The encapsulation was carried out in a 500 ml three-neck round-bottomed flask. 3. 0 g SMA
and 0. 8 g NaOH were dissolved in 100 ml water (50 °C). The pH value was adjusted to 4-5
by acetic acid solution. 10. 0 g dodecanol was added to the aqueous SMA solution, and the
mixture was emulsified mechanically under a vigorous stirring rate of 3000 r·min
-1
for 10
min using QSL high-speed disperse-machine (Shanghai Hongtai Ltd. , Shanghai, China).
Then dropped the emulsion in the bottle dipped in steady temperature flume and stirred at
a speed of 1500 r·min
-1
, and dropped 25 g mixture of prepolymer (12. 8 g) and deionized
water at a rate of 0. 25 g·min
-1
. The shell formed after 2. 5 h by heating slowly to temperature
of 60 °C. After 30 min, the temperature was elevated to 75°C directly. After polymerization
for 1. 5 h, temperature was dropped slowly at 2 °C·min
-1
to room temperature. The resultant
microcapsules were filtered and washed with water and dried in a vacuum oven.
The 5 g of dodecanol microcapsules was mixed with 1. 5 g organic diluent (Butyl glycidyl
ether) by ultrasonic vibration for 5 min. The power of ultrasonic devices was 40 W. The 10 g
bisphenol-A epoxy resin was dropped in the mixture prepared, and then the mixture was
mixed by the same ultrasonic vibration for 5 min. 2. 5 g of amine curing agent was added
and ultrasonic vibrated for 5 min. At last, the mixture prepared was casted in the PTFE
mold. After cured for 24 h at room temperature, the samples of were demoulded out.
3.2 FT-IR analyses of microPCMs synthetic structure
Fig. 11(a,b) illustrates the chemical structural formula of the MMF formation and the in-situ
polymerization process of microcapsule shells. Melamine-formaldehyde (MF) microPCMs
have been widely fabricated by in-situ polymerization because of their high mechanical
properties and compactability of shells [22]. However, it is found that the MF shells have
relatively high brittleness. This disadvantage may bring brittle broken of microPCMs under
(a) (b)
Fig. 11. Illustration of the (a) chemical structural formula of the MMF formation and (b) the
in-situ polymerization process of microcapsule shells.
Energy Storage in the Emerging Era of Smart Grids
126
an extreme temperature change process or an impact force. The methanol groups were
grafted on melamine with long branched structure to enhance the flexibility of MF-shells in
this study (Fig. 11a). As Fig. 11b shown, the MMF shell formation is an in-situ
polymerization process with the steps of W/O emulsification, MMF prepolymer adsorbed
on oil particles and prepolymer polymerization. This method has been described in our
previous report [20].
FT-IR could be applied to compare the chemical structures of MF and MMF shells, and to
confirm the encapsulation of core material. Fig. 12 (a-e) shows the FT-IR spectra of (a)
dodecanol, (b) SMA, (c) MMF, (d) MF and (e) microPCMs, respectively. The strong and
wide absorption peaks at approximately 3369 cm
−1
in Fig. 12 (a) of core material is assigned
to O-H stretching vibrations of dodecanol. The multiple strong peaks at 2925 cm
−1
and 2854
cm
−1
are associated with aliphatic C-H stretching vibrations of methyl and methylene
groups. The moderate strong peak at 1057 cm
−1
is related to C-OH stretching vibration of
primary alcohol. In Fig. 12(b), the peaks at approximately 1494 and 1603 cm
-1
are assigned to
the C=C stretching vibrations of benzene ring and the strong peaks at approximately 1858
and 1777 cm
-1
are the C=O stretching vibrations of anhydride. In Fig. 12(c,d), the strong and
wide absorption peaks at approximately 3342 and 3350 cm
-1
are attributed to the
superposition of O-H and N-H stretching vibrations. According to the work of Salaün [23],
the peaks at 1556 and 815 cm
-1
in Fig. 12. (c, d) are assigned to the vibrations of triazine ring;
and the corresponding peaks of cured MMF lie at 1559 and 815 cm
-1
. The characteristic
peaks of aliphatic primary alcohol dodecanol at approximately 2925, 2853, and 1057 cm
−1
can be observed in Fig. 12 (e) indicating that dodecanol has been microcapsulated with
MMF resin. In addition, the characteristic peaks of MF resin at approximately 1550 and 814
cm
−1
in Fig. 12 (e) indicates that dodecanol has been encapsulated as core material
successfully with MF resin as shell material.
Fig. 12. FT-IR spectra of (a) dodecanol, (b) SMA, (c) MMF, (d) MF resin, (e) microPCMs.
Fabrication and Characterization of MicroPCMs
127
3.3 Morphologies and average diameters of microPCMs
The contents of PCM in microcapsules can be estimated according to the Eq. (7) as the
theoretical value (C
t
, %),
t
C (%) 100%
core
core shell
m
mm
=×
+
(7)
where m
core
is the amount of core material (g) used and m
shell
is the amount of shell material
used (g) in synthesizing the microPCMs. The content of PCM in microcapsules (C
a
, %) also
can be estimated according to the measured melting heat according to Eq. (8),
0
(%) 100%
m
a
m
H
C
H
Δ
=×
Δ
(8)
e
E (%) 100%
a
t
C
C
=× (9)
where ΔH
m
is the melting heat of microcapsules(J/g) and
0
m
HΔ is the melting heat of
PCM(J/g). The encapsulation efficiency (E
e
, %) of microcapsules can be calculated as the
ratio of the measured PCM content in microPCMs to the theoretical value depending on the
amount of PCM and MMF prepolymer (Eq. 9) added in the system of fabrication.
The properties of microPCMs containing dodecanol synthesized by various conditions are
listed in Tab. 1. The pure dodecanol has the melting enthalpy value of 206. 9 J/g [24]. As the
SMA amounts and stirring rates greatly affecting the microPCMs morphologies and
properties [20], we firstly investigated the average diameter, C
a
and E
e
values of microPCMs
fabricated by different C
t
with the same string rate and the amount of SAM. The results
show that the average diameter, C
a
and E
e
values have increased with the increasing of C
t
.
The average diameter is in the range of 1. 55±0. 84 to 1. 99±1. 10 μm, which is not greatly
affected by C
t
. Comparatively, the average diameter of microPCMs, fabricated with the
same SAM amount (2. 0 g) and C
t
(50%) by different stirring rates (1000-4000 r·min
-1
), is in
the range of 1. 21±1. 08 to 16. 20±7. 82 μm. With the increasing of stirring rates, the average
diameters are sharply decreased. Interestingly, C
a
and E
e
values of microPCMs both
increased with the increasing of stirring rates.
Table 1. Core contents and encapsulation efficiencies of microPCMs
Energy Storage in the Emerging Era of Smart Grids
128
Fig. 13 shows the SEM morphologies (a-d) and diameter number fractions (a’-d’) of
microPCMs fabricated with different C
t
values (40, 50, 60 and 70%) under the same stirring
rate of 3000 r·min
-1
. It can be seen that all the microcapsules have the irregular spherical
shape. Some microPCMs are shrunken because of pressure or phase change. Their average
diameter is about 1-2 μm, and the different amounts of MMF have little affect on diameter of
microPCMs. Fig. 14 shows the SEM morphologies (a-d) and diameter number fractions (a’-
d’) of microPCMs fabricated with different stirring rates (1000, 2000, 3000 and 4000 r·min
-1
;
C
t
=50%). The average diameter was about 1. 2 μm when the emulsification rate was 4000
r·min
-1
. With the increasing of stirring rates from 1000 to 4000 r·min
-1
, the average diameters
decreased sharply. Also, some depressions on the surface of microcapsules were observed
due to the liquid-solid phase change induced by the temperature decreasing in the process
of synthesis of microcapsules.
Fig. 13. SEM morphologies (a-d) and diameter number fractions (a’-d’) of microPCMs
fabricated with different Ct values (40, 50, 60 and 70%) under the same stirring rate of 3000
r·min
-1
.
Fig. 14. SEM morphologies (a-d) and diameter number fractions (a’-d’) of microPCMs
fabricated with different stirring rates (1000, 2000, 3000 and 4000 r·min
-1
; C
t
=50%).
Fabrication and Characterization of MicroPCMs
129
3.4 DSC analyses of microPCMs
Fig. 15 (a) shows the DSC curves (a-e) of pure dodecanol and the microPCMs synthesized
with different C
t
values of 40, 50, 60 and 70%. For pure PCM of dodecanol, the strongest
endothermic peak at 24. 3 ºC is its phase change temperature. For each microPCMs sample,
it has one obvious endothermic peak (curve b-e). With the C
t
values increasing from 40 to
70% from microPCMs, their phase change temperatures are 20. 9, 22. 6, 23. 5 and 24. 3 ºC,
respectively. The shells of microPCMs do not greatly affect the phase change temperature of
pure dodecanol.
Fig. 15. DSC curves of (a) pure dodecanol and the microPCMs synthesized with different Ct
values (40, 50, 60 and 70%); DSC curves of (b) pure dodecanol and the microcapsules
synthesized with different stirring rates (1000-4000 r·min
-1
; SMA=2. 0 g, core/shell
(wt/wt)=1/1)).
In Fig. 15 (b), the phase change temperature and endothermic peak increased with
increasing of emulsification rates for high core encapsulation because of better distribution
of emulsifier in the emulsion system. The melting enthalpy and encapsulation efficiency (E
e
,
%) of dodecanol microcapsules synthesized at different conditions can be seen in Table 1.
And the melting enthalpy and E
e
were increasing with the increasing of C
t
values and
emulsification rates, which accorded with the DSC measurement results.
3.5 Interface morphologies of microPCMs/epoxy composites
A simulant temperature change process was designed in this study to lead the microPCMs
in composites phase change. The temperature change was in the range of 15-50 ºC, which
could suffice the phase change of dodecanol. As the epoxy had the heat-resistance ability,
this maximal temperature of this simulant process was higher than the phase change
temperature of dodecanol. At the top temperature of 50 ºC, the composites were retaining 10
min to ensure the absolute phase change of microPCMs. In order to evoke the interface
variation distinctly, this temperature change process was fast (2 ºC·min
-1
) and frequent
(repeated 10 times). As C
t
and the average diameter were two main parameters affecting the
stability of microPCMs, we paid more attention to their effects on the interface
morphologies of composites before and after the thermal treatments.
Energy Storage in the Emerging Era of Smart Grids
130
Fig. 16. SEM morphologies of microPCMs/epoxy composites (microPCMs/E-51,
wt/wt)=1/1) before (a, b, c) and after (d, e, f) a thermal treatment process with different C
t
(%) values: (a) 40%, (b) 50%, (c) 60%.
Fig. 16 shows the SEM interface morphologies of microPCMs/epoxy composites
(microPCMs/E-51, wt/wt=1/1) before (a, b, c) and after (d, e, f) the simulant thermal
treatment process with different C
t
(%) values: (a, d) 40%, (b, e) 50% and (c, f) 60%. All these
morphologies indicate that the microPCMs could be dispersed homogeneously in epoxy resin
through an ultrasonic vibration method. It would ensure the isotropic thermal transmission in
composites. In Fig. 16 (a-c), more imbedded microPCMs will make the composites more loose.
However, the interfaces of microPCMs/epoxy are compact without gaps. The shells of
microPCMs and matrix adhere tightly keeping the microPCMs steadily. Comparatively,
micro-cracks and gaps occurred after a thermal treatment in the interface of microPCMs and
epoxy matrix obviously, as shown in Fig. 16 (d-f). With the increasing of C
t
, the absorbing-
releasing of latent heat will more intensively in composites. This will give great actions to
interfaces between microPCMs and matrix polymers because of their different expand
coefficients and thermal transmission abilities. At the same time, the inherent properties of
volume expanse for PCMs in tiny microcapsules induced the internal stress in the composites
leading to separation of microPCMs and matrix. And the interface morphologies changes will
be easily produced under the repeated expand-shrink affects and the internal stress actions.
Fig. 17 shows the SEM morphologies of microPCMs/epoxy composites (MicroPCMs/E-51,
wt/wt=1/1; C
t
=50%) before (a, b, c) and after (d, e, f) a thermal treatment. These microPCMs
had different average diameters fabricated by controlling the emulsion rates of 1000, 2000 and
3000 r·min
-1
, respectively. It can be seen from Fig. 17 (a-c) that higher stirring rate will make
microPCMs with smaller average diameter, and the number of microPCMs will also increase
with the accelerating of stirring. The interfaces of microPCMs/epoxy are also compact without
gaps before the thermal treatment similar to the phenomena in Fig. 16 (a-c). In Fig. 17 (d), some
Fabrication and Characterization of MicroPCMs
131
microPCMs are deformed under the repeated expand-shrink affects and the internal stress
actions. The interface separation occurred between microPCMs and matrix as shown in Fig. 17
(e, f). Moreover, more micro-cracks appeared in the microPCMs/epoxy composites containing
microPCMs fabricated with smaller average diameter.
Fig. 17. SEM morphologies of microPCMs/epoxy composites (MicroPCMs/E-51,
wt/wt=1/1; C
t
=50%) before (a, b, c) and after (d, e, f) thermal treatment containing
microPCMs prepared by different emulsion rates: (a, d) 1000 r·min
-1
, dn=16. 20±7. 82 μm;
(b, e) 2000 r·min
-1
, d
n
=10. 67±6. 82 μm; (c, f) 3000 r·min
-1
, d
n
=6. 30±3. 58 μm.
Normally, both of C
t
and the average diameter parameters will greatly affecting the shell
thickness of microcapsules. Although the interface gaps or deformation of microPCMs had
been detected in the composites treated with a thermal process (Fig. 16 and 17), there was no
shell broken phenomenon for microPCMs embedded in matrix. The microPCMs with MMF
shells have enough mechanical properties to resist the internal stress. It can be concluded
that the internal stress generated by the expansion or shrinking of the microPCMs is the
main factor leading to the interface morphology changes and damaged of composites. And
these interface changes will affect the mechanical properties of these microPCMs/polymer
composite in application. Therefore, these above results mean that we should balance C
t
, the
average diameter and mechanical properties of microPCMs/polymer composites
systemically to satisfy the long service time of these composites.
4. Fabrication and characterization PU-shell microPCMs
A survey of literature indicates that melamine-formaldehyde (MF) resin, urea-formaldehyde
(UF) resin and polyurethane (PU) are usually selected as microcapsule shell materials for the
PCMs protection. However, there may exist ineluctable remnant formaldehyde after
forming the shell through polymerization, such as using MF and UF resins, which causes
environmental and health problems. Generally speaking, it is hard to find an effective