Environmental Monitoring Part 2 ppt
Bạn đang xem bản rút gọn của tài liệu. Xem và tải ngay bản đầy đủ của tài liệu tại đây (1.39 MB, 35 trang )
Environmental Monitoring
26
Fig. 3 presents data for pH-dependences of particle mass values obtained by RDLS method
for the cases of the Egg albumin solution with Cesium (a), the bovine serum albumin (BSA)
and the Gamma-globulin solutions with Potassium (b,c). All three graphs reveal the
formation of large particles, one order heavier than the initial protein molecule. It should be
noted that the maximum mass of nano-clusters in case of the K
+
ions in the solutions relates
to the physiological pH values.
345678
0
2
4
6
8
10
2
1
pH
M *10
6
, g/mol
2345678910
0
1
2
3
4
5
6
7
0
1
3
4
6
7
9
10
M/M
0
M*10
5
, g/mol
pH
(a) (b)
34567891011
0,0
5,0x10
5
1,0x10
6
1,5x10
6
2,0x10
6
2,5x10
6
0
2
4
6
8
10
12
14
pH
M, g/mol
M/M
0
(c)
Fig. 3. (a) pH-dependencies of scattered particle mass for Egg albumin in water solution in
presence of Cs ions (2) ( = 0,00105 mol/l), (1) - Egg albumin in pure water solution. (b) pH-
dependences of scattering particle mass for albumin, , containing ions K+. (c) pH-
dependences of scattering particle mass for -globulin water solutions, containing ions K+.
3.2 Photon-correlation spectroscopy (PCS)
The PCS method was suggested to investigate the dynamic parameters of proteins in the
aqueous solutions containing heavy metals [4, 5]. The translational diffusion coefficient D
t
is
described by the Stocks-Einstein-Debye formula as:
6
t
h
kT
D
r
Physical Mechanisms of “Poisoning” the Living Organism by Heavy Metals
27
In this formulae
h
is viscosity,
h
r - hydrodynamic radius of the particle. The normalized
experimental autocorrelation function of the scattered light intensity relates to the
translational diffusion coefficient D
t
as:
(1)
2
() exp( )
t
gDq
,
where,
q
is wave-vector,
- correlation time.
Fig. 4 shows the dependences of translation diffusion coefficient on pH for the pure gamma-
globulin solution (a) and the one containing K
+
ions (b).
3456789
0
5
10
15
D*10
-8
см
2
/с
pH
Globulin
Globulin + KCl
Fig. 4.Translation diffusion coefficient as function of pH for -Globulin water solutions with
and without K
+
ions
The
D
t
value is twice less in the latter case when studied in the isoelectric point area of
pH~6. It means that the mass of the particles in the solution with K
+
ions is one order greater
than that of the gamma-globulin molecule:
3
0
11 ~
cluster
K
p
rotein
DM
DM
,
where, M
protein
is the molecular mass of protein and M
cluster
- the mass of scattering particle.
3.3 Polarized fluorescence method
The fluorescence polarization (FP) method was used to determine the orientation correlation
time t
rot
of albumin in the solutions containing Pb
2+
and Na
+
ions. This parameter is based
on the fluorescence polarization experimental data [6] and is calculated according to the
Levshin-Perrin relation [7]:
00
11 11
3
f
l
rot
t
PP P t
,
rot
VM
t
kT kT
,
where
t
fl
is the lifetime of the excited state. The latter proportion determines linear
dependence of the
t
rot
on the mass M of the particle.
Environmental Monitoring
28
2345678
0
20
40
60
80
t
rot
, nс
pH
Fig. 5. pH-dependence of time rotation of albumin in the water solutions with Pb
2+
and Na
+
ions.
1. BSA 6,4·10
-6
M + Na+ 5,6·10
-3
M
2. BSA 6,4·10
-6
M + Pb
2
+8,3·10
-10
M
3. BSA 6,4·10
-6
M + Pb
2
+1,7·10
-7
M
4. BSA 6,4·10
-6
M + Pb
2
+6,3·10
-5
M
As Fig. 5 shows the orientation correlation time increases along with the concentration of the
heavy metal Pb
2+
ions.
For comparison, fig 6 shows the plot of relative clusters mass depends on relative
concentration - metal/protein for BSA solutions with potassium and lead ions.
Fig. 6. Relative clusters mass dependences on relative concentration - metal/protein for BSA
solutions with potassium and lead ions.
4
3
2
1
Physical Mechanisms of “Poisoning” the Living Organism by Heavy Metals
29
Thus, the FP method confirms the formation of the nano-sized clusters in the protein
solutions with presence of heavy metal ions.
4. Sorption of the ions with various ionic radii on protein surface
in the process of nano-clusters formation
In this part the sorption process of ions with various radii on the serum blood protein
surface during the nano-clusters formation stage was study. A number of static parameters
were achieved by Rayleigh-Debye light scattering, including effective masses and molecular
interaction coefficient of the particles in the proteins aqueous solution containing ions of
Na
+
, K
+
and Pb
2+
at different ionic strength. It was found that the nano-cluster formation
process depends on the ionic radius of the metal.
4.1 Results and discussion
The following table represents the metal ions as studied in this investigation:
Metal Mass, a. u. Nuclear char
g
e Ionic radius,
Å
Relative mass of cluster
11
23
Na
23 11 0,87 <2
19
39
K
39 19 1,33 20-35
82
207
Pb
207 82 1,2 >20
Table 1.
0,0
1,0x10
-3
2,0x10
-3
3,0x10
-3
4,0x10
-3
5,0x10
-3
0,0
2,0x10
-7
4,0x10
-7
6,0x10
-7
8,0x10
-7
1,0x10
-6
1,2x10
-6
1,4x10
-6
1,6x10
-6
pH=3,4
pH=5,0
pH=7,0
R
90
I mol/kg
Fig. 7. Rayleigh scattering coefficient (R
90
) as function of ionic strength of albumin water
solution containing Na
+
ions.
Environmental Monitoring
30
The mentioned above metals were used to study the dependence of the Rayleigh scattering
coefficient
R
90
on the value of the ionic strength I in the aqueous solutions of albumin
produced by “Sigma Inc.” (USA).
Fig. 7 shows the dependence of
R
90
on I for the solution with Na
+
ions, whereas Fig.8 shows
the relative masses of scattering particles dependence for this solution at pH=7.0 on
I, which
is the concentration of Na
+
ions in this case.
5,0x10
-4
1,0x10
-3
1,5x10
-3
2,0x10
-3
2,5x10
-3
3,0x10
-3
3,5x10
-3
1,0
1,1
1,2
1,3
1,4
1,5
1,6
1,7
1,8
1,9
M
P
/M
0
I mol/kg
Fig. 8. Scattering particles (M
P
) relative mass in albumin (M
0
) solution as a function of ionic
strength Na
+
.
As follows from these graphs the presence of Na
+
ions in this solution at higher ionic
strength slightly increases the masses of the scattering particles. Compared to the mass of
the albumin molecule the masses of these particles are less than twice heavier, approx. ~ 1,8.
Probably, a number of protein molecules in the albumin solution with Na
+
ions can form
dimers.
Contrary to that the effect is absolutely different with K
+
and Pb
2+
ions in the albumin
solution.
Fig. 9 shows the dependences of
R
90
on ionic strength in the BSA solution, containing K
+
ions for a number of pH values. The dependence of relative masses of scattering particles for
this solution at pH=7 is shown on Fig.10.
In this case the value of the relative mass
M
cluster
/M
protein
,which represents the mass ratio of
the nano-sized cluster to the albumin molecule, lies in the area of 20-35 for the ionic strength
around 2-3 mmol/l.
The concentration variations of the Pb
2+
ions in the albumin solution leads to a dramatic
decrease of the molecular interaction coefficient, which is the second virial coefficient
B
upon the increase of the ionic strength.
Physical Mechanisms of “Poisoning” the Living Organism by Heavy Metals
31
Fig. 9. R
90
as the function of ionic strength in albumin water solution containing K
+
ions.
0,0
5,0x10
-4
1,0x10
-3
1,5x10
-3
2,0x10
-3
2,5x10
-3
3,0x10
-3
0
5
10
15
20
25
30
35
M
B
/M
0
I mol/kg
Fig. 10. Dependence of relative masses of scattering particles for BSA solution, containing K
+
at pH=7.
As Fig. 11 shows the former changes its sign and becomes negative when the latter
reaches the values in the area of 10-15 mmol/l. This effect is due to the change in the type
of molecular interaction which is caused by the increment of the Pb
2+
ions concentration.
In this case the Coulomb repulsion between protein macromolecules, when
B is positive,
diminishes, the pure dipole attraction takes over, and
B descends below zero.
0,0
5,0x10
-4
1,0x10
-3
1,5x10
-3
2,0x10
-3
2,5x10
-3
3,0x10
-3
3,5x10
-3
4,0x10
-3
0,0
5,0x10
-6
1,0x10
-5
1,5x10
-5
2,0x10
-5
2,5x10
-5
3,0x10
-5
R
90
I mol/kg
pH=3,4
pH=4,8
pH=7,1
Environmental Monitoring
32
0,0
5,0x10
-3
1,0x10
-2
1,5x10
-2
0,0
2,0x10
-3
4,0x10
-3
6,0x10
-3
8,0x10
-3
1,0x10
-2
B
I mol/ml
Fig. 11. Dependence of B (the second virial coefficient) from ionic strength in albumin
solution with Pb
++
ions.
0,0
2,0x10
-4
4,0x10
-4
6,0x10
-4
8,0x10
-4
1,0x10
-3
0
5
10
15
20
25
M
B
/M
0
I mol/kg
Fig. 12. Dependence of relative mass value from ionic strength of albumin solution with
Pb
++
ions (pH=7, 5)
Fig. 12 shows the dependence of the relative scattering particles mass on the ionic strength
of the solution. The curve possesses a small slope rise of the relative mass. The ionic strength
Physical
Mechanisms of “Poisoning” the Living Organism by Heavy Metals
33
values in the range from 0,05 mmol/kg to 0,17 mol/kg relate to the process of monolayer
formation which takes place until the Langmuir saturation is achieved.
As graph data shows that the scattering particles masses are more than 20 times greater than
the mass of the albumin molecule. It depicts the process of the formation of the larger
particles which appear to be the nano-sized clusters generated by a number of the original
macromolecules. With the presence of Pb
2+
ions in the solution the cluster formation process
occurs at the significantly smaller ionic strength values of 0,15 mmol/kg, as compared to the
case of K
+
ions of 1,5 mmol/kg. Nonetheless, the cluster formation process runs faster in
case of Pb
2+
ions although the generated particles appear to be lighter than in the case with
K
+
ions.
5. Conclusions
The interaction of the metal ions with the charged surface of the protein in the solution
is studied by the measurement of the light scattering coefficient along with the
concentration variation of the former.
The dependence of masses of the scattering particles on the ionic strength and pH of the
solution shows the Langmuir sorption process which leads upon the monolayer
saturation to the dipole cluster formation.
The nano-sized clusters form as a result of the phase transition when the Coulomb
repulsion forces diminish and the pure dipole attraction forces take over.
The nano-cluster formation process in the protein solution depends on the ionic radii of
metal. The clusters are formed in case of the solutions containing K
+
and Pb
2+
ions,
whereas the presence of Na
+
ions in the solution reveals no effect.
Cluster formation process can explain toxic influence of heavy metal ions at the very
small concentration on the living organisms.
The work was supported by the Russian Foundation for Fundamental Research, grant No.
09-02-00438-a.
6. Acknowledgements
In memoriam of professor Yuriy M. Petrusevich (1935-2010).
I would like to thank my colleagues Yu.M. Petrusevich, K.V. Fedorova, M.A.Gurova, M.S.
Ivanova, V.P. Khlapov, A.M. Makurenkov, I.A. Sergeeva, T.N. Tikhonova, E.A.Papish,
N.V.Sokol for taking part in these investigations.
7. References
[1] Edsall J.T. et al. “Light Scattering in Solutions of Serum Albumin: effects of charge and
ionic strength” // J. of American Chem. Soc., 1950, V.72, P.4641.
[2] P.Debye. Light scattering in solutions. Journal Аppl.Phys. 15, 338-349, 1944
[3] Scathard G., Batchelder A.C., Brown A. J. Am.Chem.Soc.68 2610 (1946)
[4] Petrova G.P., Petrusevich Yu. M., Evseevicheva A.N. //General Physiology and
Biophysics, V.17(2),Р.97,(1998).
[5] Petrova G.P., at al.// Proceedings of SPIE, V.4263, p.150, (2001),
[6] Petrova G.P., Petrusevich Yu.M., Ten D.I.// Quantum Electronics, 32(10), p.897 (2002).
Environmental Monitoring
34
[7] G.P. Petrova G.P., Yu.M. Petrusevich, A.V. Boiko, D.I. Ten, I.V. Dombrovskaya, G.N.
Dombrovskii” // Proceedings of Int. Conf. Advanced Laser Technologies, ALT-05,
SPIE, V. 6344, 63441R (2006).
[8] Sergeeva I.A. et al.//Moscow University Phys.Bull. V.64,(4), P.446 (2009)
[9] Petrova G.P., Sokol N.V. The fluorescence of serum albumin solutions containing Pb and
Na ions. Moscow University Physics Bulletin, Vol. 62, Number 1, 62-64.
[10] Joseph R. Lakowicz . Principles of fluorescence spectroscopy, Plenum Press. New York,
London,1983
[11] T. N. Tikhonova, G. P. Petrova, Yu. M. Petrusevich, K. V. Fedorova, and V. V. Kashin
//Moscow University Physics Bulletin, 2011, Vol. 66, No. 2, pp. 190–195. © Allerton
Press, Inc., 2011.
3
Histological Biomarker as Diagnostic
Tool for Evaluating the Environmental
Quality of Guajará Bay – PA - Brazil
Caroline da Silva Montes,
José Souto Rosa Filho and Rossineide Martins Rocha
Universidade Federal do Pará,
Brazil
1. Introduction
It has been reported that in recent decades the level of foreign compounds known as
xenobiotics in aquatic ecosystems has increased alarmingly as a result of domestic,
industrial and agricultural effluents. In the 20th century, many thousands of organic trace
pollutants, such as polychlorinated biphenyls (PCBs),organochlorine pesticides (OCPs),
polycyclic aromatic hydrocarbons (PAHs), and dybenzon – p – dioxins (PCDDs) have
been produced and in part, released into the environment (van der Oost et al., 2003). This
has led to substantial reduction in environmental quality, adding to the deterioration of
human health and living organisms that depend on these ecosystems (Cajaravlle et al.,
2000). However, the presence of a foreign compound in a segment of an aquatic ecosystem
does not, by it self, indicate injurious effects. Connections must be established between
external levels of exposure, internal levels of tissue contamination and early adverse
effects and determining the extent and severity of such contamination only by the results
of water chemical analysis is insufficient and often overestimates the proportion and
duration of exposure to the toxic agent (van der Oost et al., 2003 & Giari et al., 2008).
Thus, studies using biomarkers are essential to complement such environmental
monitoring, given that in order to control pollution effects of effluents on the animals that
inhabit the water bodies must be understood (Martinez & Colus, 2002; Camargo &
Martinez, 2006). Biomarkers are defined as responses to any exposure evidenced in
histological, physiological, biochemistry, genetic and behavioral modification (Leonzio &
Fossi, 1993). More recent, van der Oost et al. 2003 defined biomark as a biological
indicator from an expousure to a stressor responding in various ways such a response can
be seen and adaptation as a defense. Some authors note that biomarkers are used as a
warning sign to emerging environmental problems (Au, 2004). In this type of
environmental assessment, the health of an ecosystem can be measured by the health of
its individual components (Hugget et al., 1992). It is essential to this study, as there is a
variety of responses that can be used as tools to assess the health of animals exposed to
certain chemicals, to provide information on spatial and temporal changes in pollutant
concentrations and indicate the occurrence of environmental quality or adverse ecological
consequences (Kammenga et al., 2000). In Brazil there are few studies about impact of
Environmental Monitoring
36
contaminants on tropical ecosystems, therefore tropical ecotoxicology needs further
studies on the effect of pollution on native aquatic organisms (Monserrat et al., 2007). The
biological communities of Amazonian aquatic environments are poorly known, despite its
economic and ecological importance. Belém and its surrounding areas are part of the
Amazon estuary in northern Brazil. The Combú Island, near Belém, is included on Combú
Environmental Protection Area (Law 6.083 of 11.13.1997) and corresponds to a lowland
environment region, according to the daily tidal flooding, especially during the lunar
cycles and rainy season (Ribeiro, 2004). The island’s population depends on aquatic
resources (fish and shrimp) as a source of food and income, and poses an imminent threat
to the conservation of natural resources. The species Plagioscion squamosissimus,
Hypophthalmus marginatus and Lithodoras dorsalis are economically important to the
Amazon region, since in some areas this represents the main protein source for families.
These animals occur in different types of environments, suggesting they are tolerant of a
wide range of physico-chemical variables (de La Torre et al., 2005). Thus, they are suitable
for environmental monitoring. The objective of this study was to evaluate the histological
alterations in gills and liver of the species P. squamosissimus, H. marginatu and L. dorsalis,
as well as assess the environmental influence on fish health from amazon estuary, Guajará
bay.
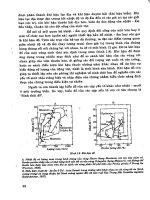
2. Material and methods
2.1 Study area
The study area is situated around the island of Combú, near Belém-PA-Brazil, located
between the coordinates 01 ° 25 'S and 48 ° 25' W. This island is inserted in the Area of
Environmental Protection Combú (Law 6.083 of 11.13.1997). This area undergoes severe
impacts that modify water quality due to increased population and its proximity to the
metropolitan area of Belém-PA-Brazil. A total of ninety-one (91) specimens were captured in
Guajará Bay and Guamá river during the dry period (July 2009). Samples were collected in
three areas (Figure 1): Area A – away from pollution sources; Area B and C – considered
impacted by the presence of domestic sewage and urban influence.
2.2 Biotic and abiotics data
During the study the physicochemical variables such as: pH, temperature, Dissolved oxygen
(DO), nitrite, nitrate and phosphate were obtained. The pH and temperature were measured
in situ using an Orion pH-meter, model 210 and a mercury thermometer. To determine the
other variables, water samples were collected at the surface layer using a Van Dorn-type
bottle. They were later processed (filtered and cooled) and taken to laboratory for analysis.
We used three fish species of interest to the local population, P. squamosissimus, L. dorsalis
and H. marginatus. These were caught by artisanal fishing, using gill nets with different
mesh sizes (25 mm, 40 mm and 50 mm). After captured, the fish were placed in plastic bags,
appropriately refrigerated in isothermal boxes and transported to the laboratory. The fish
were then examined internally and externally for gross lesions, removing a fragment of the
gills and liver. The tissue samples were fixed in Bouin's solution. After fixation, the tissues
were dehydrated in increasing concentrations of alcohol, cleared in xylene and embedded in
paraffin, obtained from 5mm thick sections and stained with HE ( hematoxylin and eosin
solution). The sections were examined and photographed using Carl Zeiss optical
microscope (Axiostar Plus1169-151).
Histological Biomarker as Diagnostic Tool for
Evaluating the Environmental Quality of Guajará Bay – PA - Brazil
37
Fig. 1. Map of study area and collection points. A (away from sources polution); B and C
(impacted).
2.3 Diagnostic histopathology
The histopathological changes were evaluated semi-quantitatively in two ways: The first
one was modified according to Schwaiger et al. (1997), which assigned a numerical value to
each animal according a degree of change: 1 (initial stage of change in some points with a
chance of recovery), 2 (occasional occurrence of localized lesions with little chance of
recovery) and 3 (widely distributed lesions in the body without chance of recovery). The
second one was adapted from Poleksic & Mitrovic - Tutundzic (1994) that examines the
Environmental Monitoring
38
calculation of the histopathological alteration index (HAI). For this, the changes were
classified as progressive stages for the deterioration of organ functions: I (do not
compromise the functioning of the organ) II (severe, affecting normal body functions) and
III (very severe and irreversible) table 1. A value of HAI was calculated for each animal
using the formula.
HAI= 10
0
∑ I+10
1
∑ II+10
2
∑ III (1)
Since I, II, III correspond to the number of stages of change, the mean HAI was divided into
five categories: 0-10 = normal tissue; 10-30 = mild to moderate damage to the tissue, 31-60 =
moderate to severe damage to the tissue, 61-100 = severe damage to the tissue , greater than
100 = irreparable damage to the tissue.
GILL/LIVER HISTOPATHOLOGY STAGE
1. Hypertrophy and hyperplasia of gill epithelium
Hypertrophy of respiratory epithelium I
Lifting of respiratory epithelium I
lamellar epithelial hyperplasia I
lamellar disarray I
Incomplete fusion of some lamellae I
Complete fusion of all lamellae II
Lamellar epithelium disruption II
Uncontrolled proliferation of tissue III
2. Changes in blood vessels
Dilation of sinus blood I
Constriction of sinus blood I
Vascular congestion II
Disruption of pillars cells II
Lamellar aneurism III
1. Changes in hepatocytes
cell hypertrophy I
cell atrophy I
Melanomacrophage centers II - III
Inflammation II
Fatty degeneration II
Necrosis II - III
2. Changes in blood vessels
Hepatitis II
Vascular congestion II
Table 1. Classification of histopathological changes of gill and liver in relation to the type,
location and stage of lesions in which they operate. Modified Poleksić and Mitrovic -
Tutundzic (1994).
2.4 Statistical analysis
The frequency of altered animals and the mean HAI for each fish caught at each site were
calculated. The occurrence of histopathological lesions and HAI were compared between
Histological Biomarker as Diagnostic Tool for
Evaluating the Environmental Quality of Guajará Bay – PA - Brazil
39
areas using the nonparametric Kruskal-Wallis tests. The differences were considered
significant p <0.05.
3. Results
Table 2. corresponds the total number of animals captured in the different study areas (A, B
and C). The results of physico-chemical variables during the study are analyzed in Table 3. The
temperature values observed are within the normal range for the tropics. Regarding pH, it was
observed that this was slightly acid in areas B and C, while the DO was lower than what is
recommended in all areas. The results of gill and liver changes are displayed in Tables 4 and 5
and Figures 2 - 8. The gills of the specimens were normal as described for teleosts, consisting of
four arches, supported by partially calcified cartilaginous tissue, each gill arch has two rows of
primary lamellae, which in turn support the secondary lamellae. The branchial lamellar
epithelium is a mosaic of primary paviment cells, mucus-secreting cells and chloride cells. The
chloride cells were less evident in light microscopy because of the color used. The secondary
lamella formed by the epithelium has a single layer of paviment cells, supported by the
basement membrane lining the pillar cells, which surround the space through which blood
circulates (Figure 5). The liver tissue of teleost fish is composed of two lobes, the right lobe
which is adjacent to the gallbladder and the left lobe near the spleen. The liver is composed of
hepatocytes, epithelial cells of the bile ducts, macrophages, blood cells and endothelial cells.
The hepatocytes are polyhedral cells with one or two large, spherical and centrally nuclei
located with evident nucleolus, and granular cytoplasm and vacuolated appearance (Figure 7).
Changes in these organizations were considered to be alterations. Several changes were
observed in gill and liver that differed significantly from the animals caught in the impacted
areas (B and C). The area A was the only one which had healthy animals, and fish with soft
lesions of type I and II and no animals with severe lesions of type III (Table 4). It was also
found that they had the lowest histopathological changes index (HAI) in the 0 to 10 range
(Table 5). Unlike the fish collected in areas B and C, where they all had some kind of change,
many were classified as degree 3 lesions, showing the most severe type III and the highest
values of HAI ranging from 41 to 91, considered moderate to severe damage, such as lamellar
aneurysm characterized by blood leakage inside the lamellae, causing disruption of pillar cells
and consequent dilation of blood vessels; lifting epithelium which is the detachment of the
lamellar epithelium; lamellar fusion, characterized by an increase in the number chloride cells
between the secondary lamellae in the respiratory tract causing reduction in the gills (Figure
6). In liver were evident such diseases: cellular hypertrophy, necrosis, presence of centers of
melanomacrophages, hepatitis and inflammation (Figure 8). Regarding the responses of
different species, it was observed that the species H. marginatus showed the lowest values
while the HAI P. squamossissimus presented the highest values. L.dorsalis and P.
squamossissimus showed more type III lesions and were therefore classified as degree 3
(Figure 4-6).
Species
Number of fish cau
g
ht
ABC
H. marginatus
10 6 10
L. dorsalis
14 15 9
P. squamossissimus
14 8 5
Table 2. Number of fish caught in different areas (A, B e C).
Environmental Monitoring
40
Variables A B C Recommended
T (°) 30 30 31 -
pH 6.1 5.8 5.9 6.0 – 9.0
DO (mg/L) 4 4.2 4.5 > 5 (mg/L)
Phosphate (mg/L) 0.01 0.01 0 0.01
Nitrite (mg/L) 0.001 0.001 0.001 0.001
Nitrate (mg/L) 1.3 1.2 1 >1
Table 3. Physico-chemical variables observed in different study areas and the value
recommended.
species Types
Gill Liver
A B C A B C
H. marginatus
I 12 17 29 12 18 24
II 3
a, b
11 13 3
a
12 9
III - 2 4 - 2 3
L. dorsalis
I 13
a
49 33 13
a
47 27
II 5
a, b
23 20 5
a, b
27 14
III - 7 4 - 7 4
P. squamossissimus
I 4
a, b
26 14 13 28 16
II 1
a, b
15 10 5
a
20 11
III - 5 3 - 5 3
Table 4. Total number of different types of histopathological lesions in gill and liver from
three fish species in study areas.
Note: Significant difference (p<0,05):
a
between A and B ;
b
between A and C.
Gill Liver
Species A B C A B C
H. marginatus
4.2 ±
a, b
0.3
54.5 ±
9.6
55.9 ±
8.3
4.2 ±
a, b
1.3
56.33±
8.7
41.4 ±
5.5
L. dorsalis
4.5 ±
a, b
2.1
65.27 ±
7.8
70.33 ±
10.6
3.94 ±
a, b
2.1
67.8 ±
14.4
63 ±
6.5
P. squamossissimus
1 ±
a, b
1.1
84.5 ±
16.5
82.8 ±
15.7
4.2 ±
a, b
0.5
91 ±
19.9
85.2 ±
24.5
Table 5. Mean and standard deviation of HAI calculated from histological alterations in gill
and liver tissue from three fish species in study areas.
Note: Significant difference (p<0,05):
a
between A and B ;
b
between A and C.
Histological Biomarker as Diagnostic Tool for
Evaluating the Environmental Quality of Guajará Bay – PA - Brazil
41
Fig. 2. Percentage of the species H. marginatus with gill and liver changes captured in the
study areas (A, B and C). 1, 2 and 3 correspond to the different degrees of alteration of
animals and health corresponds to those with no alteration.
Fig. 3. Percentage of the species L. dorsalis with gill and liver changes captured in the study
areas (A, B and C). 1, 2 and 3 correspond to different degrees of alteration of animals and
health corresponds those with no alteration.
Environmental Monitoring
42
Fig. 4. Percentage of the species P. Squamossissimus with gill and liver changes captured in
the study areas (A, B and C). 1, 2 and 3 correspond to different degrees of alteration of
animals and health corresponds to those with no alteration.
Fig. 5. Photomicrography of the gills tissue of animals captured in area. A – Normal
gill structure with primary lamella (L1) and secondary (L2) with a single layer of
pavement cells of slender appearance. 400X. B - Detail of a normal secondary lamella
showingall cell types, 1 - squamous cell, 2 - interlamellar cells and 3 – pillars cells
1000X. HE.
Histological Biomarker as Diagnostic Tool for
Evaluating the Environmental Quality of Guajará Bay – PA - Brazil
43
Fig. 6. Photomicrograph of branchial histopathology of animals captured in areas B and C. A
– Changed gill tissue with intense celular proliferation (Pc) causing severe lamellar fusion
200X. B – hypertrophy (Hp) 1000X. C – Epithelium Lifting (Arrow) 400X. D – Dilation of
sinus blood (Dl) and early aneurysm (*) 400X. HE.
Fig. 7. Photomicrography of liver tissues of animals captured in control area – Normal liver
structure with parenchyma (Ph) and veins (V) well defined 50X. B - Detail of a normal
parenchyma, Hepatocytes (Thick Arrow) and sinusoids (head Arrow) 1000X. HE
Environmental Monitoring
44
Fig. 8. Photomicrograph of hepatic histopathology of animals caught in areas B and C. A –
Changed liver tissue with intense inflamation (circle) 200X. B – Congested vein (Cg) 400X. C
– fatty degeneration (FD) 400X. D – Hepatites (HT). 200X. E – Intense melanomacrophages
centers (Cmm). 400X. F – Detail of a hepatic parenchima with necrosis ( ). 400X. HE
E
Cmm
Cmm
Histological Biomarker as Diagnostic Tool for
Evaluating the Environmental Quality of Guajará Bay – PA - Brazil
45
4. Discussion
In this study the temperature values were considered normal and slightly acidic pH.
According to Campagna (2005), there is a close relationship between pH and carbon dioxide
levels in the water, because with the discharge of sewage into rivers the water quality is
altered by pathogenic bacteria and degradable organic substances and the decomposition of
microorganisms involves the release of carbon dioxide and a consequent increase in the acidity
of water. A similar situation may have occurred in areas B and C, since these areas have
anthropogenic interference. These areas around the island showed a rapid population
occupancy process, evidenced by domestic and industrial waste (Pinheiro, 1987; COHAB,
1997), particularly worrying since this island is inserted in an environmental protection area.
The low values of DO in area A it is a typical feature of the region due to high turbidity and
low incidence of light, hence causing a decrease in DO. Histology is a sensitive tool for the
diagnosis of direct and indirect toxic effects that affect animal tissues (Braunbeck & Volk, 1993;
Heath, 1995;Ferreira et al., 2005). Therefore it is considered an excellent method for assessing
environmental quality (Freire et al., 2008). Thus this study used the histological responses of
gill and liver of fish native to the Amazon as biomarker tools. The tissue damage could clearly
differentiate the areas compromised as well as the control of the area, because healthy animals
or mild changes of type I and II were found only in area A, result totaly different from those
observed in areas B and C, where several animals showed gill lesions and hepatic diseases
classified as type III. Both gill and liver are extremely important organs because they serve for
respiration and osmoregulation and for regulating ion concentrations (Hinton et al., 1992),
hence they play a central role in metabolism (Arellano et al., 1999). Because the gills are in
direct contact with water, toxic substances can easily interfere the morphophysiology of these
organs, as for instance the use of organic pesticides (Laurent & Perry, 1991), detergents (Bolis
& Rankin, 1980), acids ( McDonald, 1983), salt (Fanta et al., 1995), industrial waste (Lindesjöö &
Thulin, 1994), ammonia (Miron et al., 2008) and heavy metals (Oliveira Ribeiro et al., 1996 ).
During the breathing process, to prevent secondary lamellae, solid agents cross the filaments
during the inflow of water, however, high concentrations of irritants dissolved in water
inevitably come into contact with the outer surface of the gill filaments and secondary lamellae
of the current circulation, which can alter the normal gill morphology, causing cell
proliferation, epithelial lifting, hypertrophy, infiltration, and aneurysm (Simonato et al., 2008).
When fish are subjected to stress, the proliferation of epithelial cells is one of the earliest
changes that occurs rapidly in order to eliminate toxic agents (Laurent & Perry., 1991). Similar
results were observed in this study since cell proliferation was the most found in all animals
from areas B and C and some from area A. The epithelial lifting, which is a more severe injury,
is caused by the change in distance of the respiratory epithelium basement membrane, causing
the inefficient absorption of oxygen (Hibiya, 1992;Nowak, 1992). Result observed by Montes et
al., 2010. Berrêdo et al. (2000) in a study conducted in Guajará Bay, showed high lead and
chromium concentrations, metals that can undermine the tissue structure in the exposed
animals. Thus we can infer that the animals evaluated in this study were responding to the
effects of toxic substances. The histological changes found in the liver were: congestion,
inflamation, hepatites, hemorrhage and necrosis. Vacuolated hepatocytes were also observed.
The first effects of the contaminants usually occur at the cellular or intracellular level (Stephan
& Mount, 1973). The melanomacrophage, also know as pigmented cells are related with the
first segmento of organism defense, therefore are responsible for storing foreign material by
capturing and processing of exogenous antigens and products of cell degradation (Bruslé et al.,
Environmental Monitoring
46
1996; Bombonato et al., 2007), as a result the increase in the amount of pigment indicate the
increasing expousure (Fernandes et al., 2009), result observed in this study since in impacted
areas the number of pigments were greater. Baldisserotto (2002) developed a classification that
relates the degree of changes in liver tissues according to the degree of pollution in aquatic
systems. These authors consider that a compromised parenchyma with several melano-
macrophages centers of already exposed tissue can be considered as highly polluted
environments, the situation seen in the specimens collected in areas B and C. Necrosis is
induced by high concentrations of toxic substances (Rocha et al., 2010), it is then considered as
a type III alteration. Some animals in the study areas had such an injury, thus we can infer a
certain degree of pollution to the area. There was no significant difference among the animals,
and despite their similar feeding habits, they responded similar to the same degree of toxicity.
The morphological changes observed in the gill and liver of juveniles evidences an early sign
of contamination in the Guajará Bay, thus indicating that these species can be used in
environmental monitoring programs. However more studies should be performed as this is a
protected area.
5. Conclusion
This study presented significant results and was effective in showing that human action can
be mischievous if not properly controlled and the proximity of the Combú island with the
urban area may be affecting water quality. In addition both the results of the pathology and
the species were excellent tools for diagnosing and determining and such data may be used
by managers as a form of environmental monitoring and possible remediation of the
impacted area as this island is a protected area.
6. Acknowledgments
We would like to thank the CNPq (conselho nacional de desenvolvimento cientifico e
tecnologico) for financial support to the project n°(552952/2007-2009)
7. References
Arellano, J.M ; Storch, V. & Sarasquete, C. (1999). Histological changes and copper
accumulation in liver and gills of the senegales Sole solea senegalensis. Ecotoxicology
and Environmental Safety, Vol. 44, No. 1, pp 62-72.
Au, D.W.T. (2004). The application of histo-cytopathological biomarkers in marine pollution
monitoring: a review. Marine pollution bulletin, Vol. 48, No. 9-10, pp 817-834.
Baldisseroto, B. (2002). Fisiologia de peixe aplicada a piscicultura, 211p. Santa Maria, SC, Brazil.
Berrêdo, J.F ; Mendes, E.P.C.B. ; Mendes, A.C. ; Corrêa, G.C.S. & Neves, F.C.O. (2000). Transporte
e comportamento geoquímico de metais pesados no estuário guajarino/pa - brasil. v
workshop ecolab (ecossistemas costeiros amazônicos), Vol. 1, Macapá, AP, Brazil.
Bolis, L.; Rankin, J.C. (1980). Interactions between vascular actions of detergent and
catecholamines in perfused gills of european eel, Anguilla anguilla L. and brown
trout, Salmo trutta L. Journal of fish biology, Vol. 16, pp. 61-73.
Bombonato, M.T.S.; Rochel, S.S.; Vicentini, C.A. & Vicentini, I.B.F. (2007). Estudo
morfológico do tecido hepático de leporinus macrocephalus. acta scientiarum –
biological sciences, Vol. 29, No. 1, pp. 81-85, 2007.
Histological Biomarker as Diagnostic Tool for
Evaluating the Environmental Quality of Guajará Bay – PA - Brazil
47
Braunbeck, T. & Volkl, A. (1993). Toxicant-induced cytological alterations in fish liver as
biomarkers of environmental pollution? a case study on hepatocellular effects of dini-
tro-o-cresol in golden ide (Leuciscus idus melanotus). in: fish ecotoxicology and ecophysiology
(Ed.) 55–80, Braunbeck, T.; Hanke, W. & Segner, H. Birkhäuser verlag, Basel.
Bruslè, J. & Anadon, G.G. (1996). The structure and fuction of fsh liver. in: Fish morphology
horizon of new research. (Ed.), p 16, Munshi, J.S.D. & Dutta, H.M, Beirute.
Cajaravlle, M.P.; Benianno, J.M.; Blasco, J.; Porte, C.; Sarasquete, C. & Viarengo, A. (2000)
The use of biomarkers to assess the impact of pollution in coastal environments of
the iberian península: a pratical approach. The science of the total environment.
No.247, pp. 295-311.
Camargo, M.M.P. &, Martinez, C.B.R. (2007) Histopathology of gills, kidney and liver of a
neotropical fish caged in na urbam stream. Neotropical ichthyology, Vol. 5, No.3, pp.
327-336.
Campagna, A.F. (2005) Toxicidade dos sedimentos da bacia hidrográfica do rio monjolinho
(são carlos-sp): ênfase nas substâncias cobre, aldrin e heptacloro. Dissertação
(mestrado em zootecnia), universidade de são paulo, Pirassununga, Brazil.
COHAB. (1997) Relatório ambiental da região metropolitana de belém. Belém.
Conama. (2005). Ministério do meio ambiente. conselho nacional de meio ambiente. portaria nº 357
de 17 de março de 2005. Brasília.
Fanta, E. (1995). Gill structure of antartic fishes notothenia (gobinotothen) gibberifrons and
trematomusnewnesi (notothenidae) stressed by salinity changes and some
behavioral consequences. anta. rec., Vol. 39, pp. 25-39.
Fernandes, C., Fontaínhas-fernandes, A.; Ferreira, M. & Salgado, M.A. (2009) Oxidative stress
response in gill and liver of liza saliens, from the esmoriz-paramos coastal lagoon,
portugal. Archives of environmental contamination toxicology, No.52, pp. 262-269.
Ferreira, M.; Moradas-ferreira, P. & Reis-henriques, M.A. (2005) Oxidative stress biomarkers
in two resident species, mullet (Mugil cephalus) and flouder (Platichthys flesus), from
a polluted site in river douro estuary, portugal. aquatic toxicology, No. 71, pp. 39-48.
Freire, M.M ; Santos, V.G.; Ginuino, I.S.F.; Arias, A.R.L. (2008) Biomarcadores na avaliação
da saúde ambiental dos ecossistemas aquáticos. oecologia brasilienses, Vol. 12, No. 3,
pp. 347-354.
Giari, L.; Simoni, E.; Manera, M. & Dezfuli, B.S. (2008) histo-cytological responses of
Dicentrarchus labrax (l.) following mercury exposure. Ecotoxicology and
environmental safety, Vol. 70, pp. 400-410.
Heath, A.G. (1995) Water pollution and fish physiology.(ed. 2). Boca Raton.
Hibiya, T. (1982). An atlas of fish histology, normal and pathological features. New york,
kodansha tokio.
Hinton, D.E.; Baumen, P.C.; Gardener, G.C.; Hawkins, W.E.; Hendricks, J.D.; Murchelano,
R.A. & Okhiro, M.S. (1992). Histopathological biomarker . in: biomarkers: biochemical,
physiological and histological markers na anthropogenic stress society of environmental
toxicology and chemistry special publication series (eds), p 155-210. Huggett, R.J.;
Kimerle, R.A.; Merhle, P.M. & Bergman, H.L. Chelsea, MI, USA.
Huggett, R.J.; Kimerle, R.A. & Mehrle, P.M. (1992). Biomarkers biochemical, physiological, and
histological markers of anthropogenic stress. Bergman, h.l. (ed). Boca Raton, FL, USA.
Kammenga, J.E.; Dalliner, R.; Donker, M.H.; Kohler, H.R.; Simonsen V.; Triebskorn, R. & Weeks,
J.M. (2000) Biomarkers in terrestrial invertebrates for ecotoxicological Soil risk
assessment. Revist of Environmental Contamination Toxicology. Vol. 164, pp. 93-147.
Laurent, P. & Perry, S.F. (1991) Environmental effects on fish gill morphology. physiology
zoology. Vol.64, pp. 4-25.
Environmental Monitoring
48
Leonzio, C. & Fossi, M.C. (1993) Nondestructive biomarkers strategy: perspectives and
applications: in: Nondestructive biomarkres in vertebrates (eds). 297-312. Fossi, M.C &
Leonzio, C. London.
Lindesjöö, E. & Thulin, J. (1994). Histopathology of skin and gills of fish in pulp mill
effluents. Aquatic organisms, Vol. 18, pp. 81-93.
Martinez, C.B.R. & Souza, M.M. (2002) Acute effects of nitrite on ion regulation in two
neotropical fish species. Comparative biochemistry and physiology,Vol. 133ª, pp. 151-160.
McDonald, D.G. (1983). The effects of h
+
upon the gills pf freshwater fish. Canadian journal of
zoology, Vol. 61, pp. 691-703.
Miron, D.S.; Moraes, B.; Becker, A.G.; Crestani, M.; Spanevello, R.; Loro, V.L. &
Baldisserotto, B. (2008) Ammonia and ph effects on some metabolic parameters
and gill histology of silver catfish, Rhamdia quelen (Heptapteriadae). Aquaculture,
Vol. 277, pp. 192-196.
Monserrat, J.M.; Martinez, P.E.; Geracitano, L.A.; Amado, L.L.; Martins, C.M.G.M.; Pinho,
G.L.L.; Chaves, I.S.; Ferreira-cravo, M.; Ventura-lima, J. & Bianchini, A. (2007)
Pollution biomarkers in estuarine animals: critical review and new perspectives.
Comparative biochemistry and physiology part c, No.146, pp. 221-234.
Montes, C.S.; Ferreira, M.A.P; Santos, S.S.D.; von Ledebur, E.I.C.F. & Rocha, R.M. (2010)
Branchial histopathological study of brachyplatystoma rousseauxii (castelnau,
1855) in the guajará bay, belém, pará state, brazil. acta scientiarium biolical science,
Vol. 32, No. 1, pp. 87-92.
Nowak, B. (1992) Histological changes in gill induced by residues of endossulfan. Aquatic
toxicology, Vol. 23, pp. 65-84.
Oliveira-ribeiro, C.A. (1996) Lethal effects of inorganic mercury on cells and tissues of
trichomycterus brasilienseis (pisces; siluroidei). Biocellular. Vol.20, No.3,pp.171-178.
van der Oost, R ; Beyer, J.; Vermeulen, N.P.E. (2003) Fish bioaccumulation and biomarkers
in environmental risk assessment: a review. Enviromental toxicology and
pharmacology, Vol. 13, pp. 57-149.
Pinheiro, R.V.L. (1987) Estudo hidrodinâmico e sedimentológico do estuário guajará – belém (pa).
Dissertação (mestrado em geociências) universidade federal do pará, belém, PA, Brazil.
Poleksic, V. & Mitrovic-Tutundzic, V. (1994) Fish gills a monitor of sublethal and choronic
effects of pollution. in: muller, r.; lloyd, r. sublethal and chronic effects of pollutants
of freshwater fish. oxford: fishing news books. No. 30, pp. 339-352.
Ribeiro, K.T.S. (2004) Água e a saúde humana em belém. belém. cejup.
Rocha, R.M.; Coelho, R.P.; Montes, C.S.; Santos, S.S.D. & Ferreira, M.A.P. (2010) Avaliação
histopatológica do fígado de Brachyplatystoma rousseauxii (castelnau, 1855) da Baía
do guajará, belém, pará. Ciência animal brasileira (ufg), Vol. 11, pp. 101-109.
Schwaiger, J.; Wanke, R.; Adam, S.; Pawert, M.; Honnen, W. & Triebskorn, R. (1997) The use
of histopathological indicators to evaluate contaminant related stress in fish.
Dordretch. Journal Aquatic Ecosystem Stress Recovery, Vol.6, No 1, pp. 75-86.
Simonato J.D.; Guedes, C.L.B. & Martinez, C.B.M. (2008) biochemical, physiological and
histological changes in the neotropical fish prochilodus lineatus exposed to diesel oil.
Ecotoxicol environmental safety No. 69, pp. 112-120.
Stephan, C.E. & Mount, D.J. (1973) Use of toxicity tests with fish in water polution control, In:
Biological methods for the assessment of water quality. Vol 528, pp. 164-177, Philadephia.
de la Torre, F.R.; Ferrari, L. & Salibián, A. (2005) Biomarkers of a native fsh species
(Cnesterodon decemmaculatus) applicationto the water toxicity assessment of a peri-
urban polluted river of Argentina. Chemosphere, Vol.59, No. 4, pp. 577-583.
Part 2
Advances in Environmental
Monitoring Research and Technologies