báo cáo hóa học: "Using hierarchical clustering methods to classify motor activities of COPD patients from wearable sensor data" pdf
Bạn đang xem bản rút gọn của tài liệu. Xem và tải ngay bản đầy đủ của tài liệu tại đây (1.55 MB, 14 trang )
BioMed Central
Page 1 of 14
(page number not for citation purposes)
Journal of NeuroEngineering and
Rehabilitation
Open Access
Research
Using hierarchical clustering methods to classify motor activities of
COPD patients from wearable sensor data
Delsey M Sherrill
1
, Marilyn L Moy
2
, John J Reilly
2
and Paolo Bonato*
1,3
Address:
1
Dept of Physical Medicine and Rehabilitation, Harvard Medical School, Spaulding Rehabilitation Hospital, Boston MA, USA,
2
Dept of
Medicine, Harvard Medical School, Brigham and Women's Hospital, Boston MA, USA and
3
The Harvard-MIT Division of Health Sciences and
Technology, Cambridge MA, USA
Email: Delsey M Sherrill - ; Marilyn L Moy - ; John J Reilly - ;
Paolo Bonato* -
* Corresponding author
Abstract
Background: Advances in miniature sensor technology have led to the development of wearable
systems that allow one to monitor motor activities in the field. A variety of classifiers have been
proposed in the past, but little has been done toward developing systematic approaches to assess
the feasibility of discriminating the motor tasks of interest and to guide the choice of the classifier
architecture.
Methods: A technique is introduced to address this problem according to a hierarchical
framework and its use is demonstrated for the application of detecting motor activities in patients
with chronic obstructive pulmonary disease (COPD) undergoing pulmonary rehabilitation.
Accelerometers were used to collect data for 10 different classes of activity. Features were
extracted to capture essential properties of the data set and reduce the dimensionality of the
problem at hand. Cluster measures were utilized to find natural groupings in the data set and then
construct a hierarchy of the relationships between clusters to guide the process of merging clusters
that are too similar to distinguish reliably. It provides a means to assess whether the benefits of
merging for performance of a classifier outweigh the loss of resolution incurred through merging.
Results: Analysis of the COPD data set demonstrated that motor tasks related to ambulation can
be reliably discriminated from tasks performed in a seated position with the legs in motion or
stationary using two features derived from one accelerometer. Classifying motor tasks within the
category of activities related to ambulation requires more advanced techniques. While in certain
cases all the tasks could be accurately classified, in others merging clusters associated with different
motor tasks was necessary. When merging clusters, it was found that the proposed method could
lead to more than 12% improvement in classifier accuracy while retaining resolution of 4 tasks.
Conclusion: Hierarchical clustering methods are relevant to developing classifiers of motor
activities from data recorded using wearable systems. They allow users to assess feasibility of a
classification problem and choose architectures that maximize accuracy. By relying on this
approach, the clinical importance of discriminating motor tasks can be easily taken into
consideration while designing the classifier.
Published: 29 June 2005
Journal of NeuroEngineering and Rehabilitation 2005, 2:16 doi:10.1186/1743-
0003-2-16
Received: 07 June 2005
Accepted: 29 June 2005
This article is available from: />© 2005 Sherrill et al; licensee BioMed Central Ltd.
This is an Open Access article distributed under the terms of the Creative Commons Attribution License ( />),
which permits unrestricted use, distribution, and reproduction in any medium, provided the original work is properly cited.
Journal of NeuroEngineering and Rehabilitation 2005, 2:16 />Page 2 of 14
(page number not for citation purposes)
Background
Field Monitoring of Motor Activities
During the past decade, the interest of researchers and cli-
nicians has focused on wearable sensors and systems as
means to monitor motor activities in the home and the
community settings [1-3]. Objective measures of physical
activities outside of the clinical setting are sought because
subject report is notoriously inaccurate. For instance, Pitta
et al. [4] showed that subjects overestimated time spent
walking, cycling, and standing, and underestimated time
spent sitting and lying. They used a triaxial accelerometer
to quantify time spent in a standardized protocol of walk-
ing, cycling, standing, sitting, and lying in patients with
chronic obstructive pulmonary disease (COPD). They vid-
eotaped the performance of the protocol and asked sub-
jects to estimate time spent in each activity. Differences
between outcomes from videotape and the accelerometer
ranged from 0% (sitting) to 10% (lying). In contrast, dif-
ferences between videotape and patient report ranged
from 18% (lying) to 59% (walking).
The simplest device to monitor motor activities consists of
a single accelerometer positioned on the body segment
mostly involved in the motor activity of interest [3]. Ped-
ometers and step counters are the most popular among
these devices. Since the mid-nineties, researchers have uti-
lized this approach to estimate overall level of activity and
energy expenditure (e.g. [5,6]). A number of studies have
been devoted to investigate clinical uses of systems based
on a single accelerometer. Among others, Steele et al. [7,8]
measured human movement in three dimensions over 3
days and showed that the magnitude of the acceleration
vector is correlated with existing clinical measures such as
the six-minute walk distance, FEV1 (forced expiratory vol-
ume in 1s), dyspnea, and Physical Function domain of
health-related quality of life. Moy et al [9] showed that
monitoring of ambulation in patients with COPD over
two-week periods in the home environment correlates
with global assessments of health-related quality of life
such as General Health and Mental Health on the SF-36.
The limitations of these devices are that they record only
ambulation, do not assess upper arm movements, cannot
discriminate changes in grade and intensity of workload,
and do not assess concomitant systemic responses.
To overcome at least some of the limitations of devices
based on a single accelerometer, researchers have devel-
oped ambulatory and wearable systems to simultaneously
monitor the movement of multiple body segments.
Although there is a trade-off in simplicity of use, the abil-
ity of these systems to measure the orientation (due to the
effect of gravity) and acceleration of individual segments,
as well as intersegmental coordination, has opened the
door to a variety of applications requiring the identifica-
tion of specific activities. In the late nineties, several
research teams [10-13] attained greater than 70% sensitiv-
ity to each of 4 classes of activity: sitting, standing, lying,
and dynamic movement. Researchers used data-loggers
connected to miniature accelerometers that were attached
to the sternum/waist (bi- or triaxial) and one or both
thighs (uniaxial), and data were collected under control-
led laboratory conditions. Using a 5-sensor configuration,
Foerster and Fahrenberg [13] subdivided the 4 classes into
13 separate tasks: 3 types of sitting, 4 types of lying, 5
types of dynamic motion, and standing. Sensitivity for the
different tasks ranged between 82 and 98%.
During the past five years, numerous research teams fur-
ther developed the potential of accelerometer-based sys-
tems to monitor motor activities in the field. Among
others, Schasfoort et al [14] first focused on quantifying
upper body activity by means of accelerometers. The
development of the technique was followed by its appli-
cation to the assessment of the degree of impairment and
activity limitation in patients with complex regional pain
syndrome type I [15]. Sherrill et al [16] explored the use
of an activity monitor to gather information related to the
level of independence of individuals similar to what is
typically accomplished by a Functional Independence
Measure assessment [17]. Bussmann et al [18] utilized an
accelerometer-based system to assess mobility in transtib-
ial amputees. Other research teams explored the use of
accelerometers to monitor motor patterns in patients with
Parkinson's disease [19-22] and in post-stroke individuals
following rehabilitation [23,24].
In the studies mentioned thus far, the algorithms devel-
oped and utilized to identify different motor activities
constitute a key point of the proposed methods. Various
approaches have been developed by our team and others
ranging from the application of simple rule-based classifi-
ers [12,23,25,26] to complex pattern recognition algo-
rithms involving a combination of neural networks and
neuro-fuzzy inference systems [16,19]. When clear differ-
ences are known a priori to exist among the motor activi-
ties to be identified (e.g. sitting vs. walking), simple rule-
based classifiers are usually sufficient. However, when the
activities of interest are complex, and the distinctions
among them more subtle and subject to individual varia-
bility, more advanced pattern recognition algorithms are
called for. In most real-world situations, the set of motor
activities under investigation includes members of both
categories. A hierarchical approach such as that proposed
by Mathie et al. [2] appears to offer a suitable compro-
mise. In Mathie et al.'s classification scheme, movements
were categorized very generally at the top of the hierarchy
(activity vs. rest) and then subdivided, over 4 additional
levels, into progressively more specialized submovements
using a binary decision at each node. The authors
achieved an average 97% accuracy in identifying 15
Journal of NeuroEngineering and Rehabilitation 2005, 2:16 />Page 3 of 14
(page number not for citation purposes)
submovements (7 static postures, 5 postural transitions,
and 3 dynamic categories).
The methods described in this paper can be viewed as an
extension of Mathie et al.'s framework to include a greater
variety of dynamic activities of the upper and lower
extremities. In particular, for the COPD population (the
target patient population of the application described in
this manuscript) it is important to distinguish subtypes of
ambulation because they correspond to different levels of
physical exertion: walking up stairs or up an incline is
more fatiguing than walking on level ground or descend-
ing stairs or an incline. For such activities, it is not clear at
the outset which features of the accelerometer data will
best distinguish these conditions. Indeed, there is no guar-
antee that the data even contain sufficient information to
make such distinctions in all cases, or in every subject, due
to individual variations in body type and pattern of move-
ment. Our essential approach is to rely on clustering tech-
niques to explore the data set for each individual, assess
whether distinct clusters correspond to different motor
tasks, determine whether simple rules can contrast clus-
ters associated with different tasks, and evaluate the need
for merging clusters when the information derived from
accelerometer data appears insufficient to sort out differ-
ent motor tasks.
Medical Application
To demonstrate the efficacy of the proposed approach, a
data set recorded from patients with COPD is utilized.
Monitoring motor activities in patients with COPD is of
great clinical interest. COPD is predicted to be the third
most frequent cause of death in the world by 2020 [27]. It
afflicts more than 15 million Americans, results in more
than 15 million physician office visits each year, and
causes approximately 150 million days of disability per
year [28]. The total direct cost of medical care related to
COPD is approximately $15 billion per year [29]. COPD
is a steadily progressive, debilitating disease for which
existing medical therapies are largely ineffective. With
decreasing lung function, patients are at increased risk for
hospitalizations, need for supplemental oxygen therapy,
decreased exercise capacity, and death. Physical exercise in
particular is a crucial component to the medical treatment
of COPD to prevent deconditioning, to improve health-
related quality of life, and to optimize response to surgical
interventions [30]. Hence the improvement of exercise
capacity is a major goal in the treatment of patients with
COPD.
Celli et al [31] showed that exercise tolerance, which
reflects the systemic consequences of COPD, added to the
predictive power to predict mortality of FEV1, the long-
held 'gold standard' measure of disease progression in
COPD. Exercise tolerance can be assessed in the clinical
setting via the progressive incremental cardiopulmonary
exercise test. Performed either on a treadmill or stationary
bicycle, cardiopulmonary exercise testing yields integra-
tive information about the metabolic, cardiovascular, and
ventilatory processes that occur during exercise. Exercise
tolerance can also be measured indirectly via timed walk-
ing tests, the advantages of which are simplicity, minimal
resource requirements, and general applicability. How-
ever, the disadvantages of timed walking tests include
dependence on patient and administrator motivation,
effects of learning, and a potential for inter-test variability
if the administrators give differing instructions or encour-
agement during separate tests over time [32].
Furthermore, neither the cardiopulmonary exercise test
nor timed walking tests capture work performed by the
upper extremities. It has been demonstrated that unsup-
ported arm exercise in patients with COPD produces dys-
synchronous breathing, and thus dyspnea and sensation
of muscle fatigue [33]. During unsupported arm work, the
accessory muscles of inspiration help position the torso
and arms. It is hypothesized that the extra demand placed
on these muscles during arm exertion leads to early
fatigue, an increased load on the diaphragm, and dyssyn-
chronous thoracoabdominal inspirations. Therefore accu-
rate measurement of upper as well as lower extremity
exercise capacity is important in assessing these patients.
Patients with COPD experience daily fluctuations in their
clinical status, with "good and bad days" occurring as a
function of airway secretions, humid weather, and other
environmental factors. Moreover, COPD patients demon-
strate widely variable exercise capacities even when they
have identical degrees of airflow obstruction by pulmo-
nary function tests [34]. These factors strongly motivate
the development of a wearable, individually-customiza-
ble system to monitor activity in the home and commu-
nity for days or weeks at a time as a supplement (or
alternative) to controlled laboratory tests administered at
a single point in time. To date, a number of researchers
[7,8,26,30,35] have conducted preliminary studies to
evaluate the relevance of field measures in COPD patients
with encouraging results. It is thus particularly appropri-
ate to utilize data recorded from COPD patients as a dem-
onstration of the motor activity classification techniques
proposed in this paper. In the following sections, we sum-
marize the data collection protocol, describe the proce-
dures to estimate features of the acceleration data,
demonstrate the use of clustering methods for analysis of
the feature sets, and discuss the generalization of the pro-
posed approach to building classifiers of motor activities
from field data.
Journal of NeuroEngineering and Rehabilitation 2005, 2:16 />Page 4 of 14
(page number not for citation purposes)
Methods
Data Collection
We gathered data from six individuals with severe COPD
in a controlled clinical environment (Brigham &
Women's Hospital Division of Pulmonary Rehabilita-
tion). The subjects ranged in age from 51 to 80 years
(mean age 63). Biaxial accelerometers were mounted on
the lateral aspect of each subject's right and left forearm
(approximately 10 cm proximal to the wrist joint) and on
the lateral aspect of the right and left thigh (approximately
10 cm proximal to the knee joint). The sensitive axes were
oriented to capture accelerations in the up-down and
anteroposterior directions. Note that location of the sen-
sors is described assuming a reference position of upright
stance with arms at the sides and palms facing the midline
of the body. An additional biaxial sensor was placed on
the sternum to sense up-down and mediolateral motions
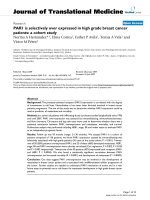
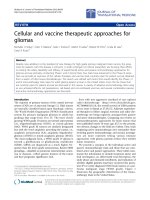
of the trunk. Subjects were outfitted with a Vitaport 3
ambulatory recorder (Temec B.V., The Netherlands,
shown in Figure 1), worn about the waist, to digitally sam-
ple (128 Hz) and store 10 channels of data continuously
throughout the experiment. Care was taken to secure
wires and minimize the impact of the system on the abil-
ity of patients to move freely.
The subjects were asked to perform 10 tasks according to
a pre-defined protocol for at least one minute each. The
protocol included three aerobic exercises typical of the
prescribed pulmonary rehabilitation exercise regimen for
these patients (walking on a treadmill, cycling on a
Ambulatory recorder & accelerometersFigure 1
Ambulatory recorder & accelerometers. This system was utilized to gather accelerometer data from right and left fore-
arm and right and left thigh from COPD patients performing a set of motor tasks in a controlled clinical environment. The sen-
sor units shown in the picture are the biaxial accelerometers used in the study.
Journal of NeuroEngineering and Rehabilitation 2005, 2:16 />Page 5 of 14
(page number not for citation purposes)
stationary bike, and cycling on an arm ergometer), five
tasks representing ambulation in a free-living environ-
ment (level walking in a hallway, ascending/descending a
ramp, and ascending/descending stairs), and two other
free-living activities, folding laundry in a seated position
and sweeping the floor with a broom. These last two
motor tasks were considered to assess whether it is possi-
ble to reject tasks that are somehow similar from a biome-
chanical point of view to the ones of interest, i.e. aerobic
exercises and tasks representing ambulation. Identifying
the full range of movement conditions would allow the
assessment of patients' overall mobility in addition to
their compliance with a prescribed exercise routine. Note
that for certain tasks, such as climbing stairs, it was not
possible to gather data continuously for an entire minute
in every subject due to the physically demanding nature of
those tasks. The experimenter kept a written log of the
subject's activities and used a manual marker to segment
the recording. The experimental protocol was reviewed
and approved by the Brigham & Women's Hospital panel
of the Partners HealthCare Human Research Committee.
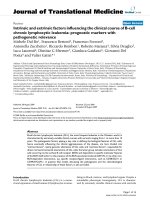
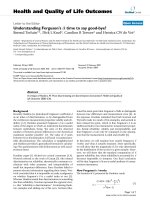
Examples of accelerometer signals for a few motor tasks
from one subject are shown in Figure 2. Data are pre-
sented for four motor tasks, i.e. level walking in a hallway,
cycling, ascending a ramp, and ascending stairs. Signals
from the accelerometers positioned on the right and left
legs oriented in the antero-posterior and up-down direc-
tions are plotted. These examples demonstrate differences
and similarities in patterns of accelerometer data across
motor tasks. For instance, data related to cycling are
noticeably different from data related to level-walking. On
the other hand, more subtle differences mark accelerome-
ter data recorded while the subject was ascending stairs
and signals gathered while the subject was ascending a
ramp.
Pre-processing and Feature Extraction
All processing routines were developed using Matlab (The
MathWorks, Natick MA). Data were digitally filtered (5
th
order elliptical lowpass, fc = 15 Hz, transition bandwidth
1 Hz, passband tolerance 0.5 dB, minimum stopband
attenuation 20 dB, non-causal implementation) to
remove high-frequency (noise) components unrelated to
limb or trunk movement. Further, to separate compo-
nents related to applied accelerations from those related
to body segment orientation changes, a highpass digital
filter was applied (2
nd
order elliptical, fc = 0.5 Hz, transi-
tion bandwidth 0.5 Hz, passband tolerance 0.5 dB, mini-
mum stopband attenuation 20 dB, non-causal
implementation).
Extraction of epochs for further analysis was performed by
sliding a 3s window through the recording at 1s intervals
to extract the epochs. Note that this resulted in a 66%
overlap between successive epochs. Then the following 9
features were extracted per epoch for each channel (or pair
of channels, as indicated):
I. Time series features (3):
• Mean (prior to highpass filtering) was calculated as a
measure of limb orientation and/or posture (all other fea-
tures were derived from the highpass filtered data)
• RMS energy for each channel was calculated as a meas-
ure of magnitude of the overall acceleration applied to
each body segment
• Range of each channel, a measure of peak acceleration
II. Spectral features (2):
• Dominant frequency component (i.e. 0.5 Hz bin with
greatest energy) between 0.5 and 15 Hz
• Ratio of energy in dominant frequency component to
the total energy below 15 Hz (an estimate of how much
the signal is dominated by a particular frequency, i.e. its
periodicity)
III. Correlation features (4):
• Range of autocorrelation function, a measure of the
modulation of the signal (unbiased estimate)
• Value of the crosscorrelation function at zero lag (for all
possible pairs of arm and leg channels), an approximate
measure of intersegmental coordination.
• Peak value of the crosscorrelation function (for time-
lags between -0.5 to 0.5 s), a measure of similarity of the
movement patterns across body segments.
• Time-lag corresponding to the peak of the crosscorrela-
tion function, which is a measure of the delay between
movement of pairs of body segments
All features were assessed initially for consistency and var-
iability across tasks using data visualization techniques.
Certain features were excluded from further analysis of
motor tasks associated with ambulation because they
were found to interfere with reliable separation of these
tasks. First, all features derived from sensors on the arms
were excluded because their position can vary greatly. For
instance, during a particular ambulatory task, the individ-
ual might swing his or her arms freely, hold on to a railing
with one arm, or carry an object, whereas the goal is to
identify the task regardless of such variations. Second,
because the present aim is to identify the task regardless of
Journal of NeuroEngineering and Rehabilitation 2005, 2:16 />Page 6 of 14
(page number not for citation purposes)
speed, the dominant frequency feature for all channels
was excluded because of its dependence on speed of loco-
motion. It is foreseeable that one could use this feature in
the future in order to assess speed, which would be useful
for marking conditions that are more physically taxing. In
total there were 48 feature values per epoch in the ambu-
latory task analysis. Data were normalized across subjects.
Principal components analysis [36] was performed to fur-
ther reduce the dimensionality by transforming the data
and retaining the first 6 components, which accounted for
about 90% of the total variance. This step was necessary
due to the small sample size.
Analysis Procedures
The first stage in assessing the degree of similarity among
classes was to visualize the reduced feature set in two
dimensions with a scatter plot of the 1
st
and 2
nd
principal
components. This was useful to build intuition about the
structure of the data set, but a more objective method for
similarity analysis is desirable from an automation stand-
point. An objective measure of similarity would enable
more systematic analysis of how task identification accu-
racy is affected by the merging of classes.
In order to measure the distinguishability of a subset of
tasks on the basis of features derived from accelerometer
data, clusters were defined based on class labels, and then
the correspondence between labels and the natural
groupings in the data was measured. Because we start with
knowledge of the data labels, this is a reversal of the classic
unsupervised learning paradigm where clusters are
defined based on properties of the data and then used to
Accelerometer data samplesFigure 2
Accelerometer data samples. Accelerometer signals are shown over a window of 5s corresponding to a few cycles of the
following motor tasks: level walking, cycling, walking up an incline, and walking up stairs. Data are shown for the accelerome-
ters positioned on left and right thigh with axes oriented in the antero-posterior and up and down directions.
0 1 2 3 4 5
-3
-2
-1
0
1
Up stairs
0 1 2 3 4 5
-3
-2
-1
0
1
Time (s)
0 1 2 3 4 5
-2
-1
0
1
2
Right le g (ant/post)
Level walking
0 1 2 3 4 5
-2
-1
0
1
2
Left le g (ant/post)
0 1 2 3 4 5
-3
-2
-1
0
1
Cycling
0 1 2 3 4 5
-3
-2
-1
0
1
0 1 2 3 4 5
-3
-2
-1
0
1
Right leg (up/down)
Up incline
0 1 2 3 4 5
-3
-2
-1
0
1
Left leg (up/down)
Time (s)
Journal of NeuroEngineering and Rehabilitation 2005, 2:16 />Page 7 of 14
(page number not for citation purposes)
label the data. In the unsupervised problem, the number
of clusters is rarely known a priori. A typical approach is
to try a range of possible values for the number of clusters,
and then choose the clustering that maximizes a pre-
defined cluster quality index (CQI). Our approach uses
CQI to measure cluster similarity by calculating its value
for each pair of clusters.
Two of the most widely cited CQIs in the machine learn-
ing literature are Dunn's index [37] and the Davies-Boul-
din index [38]. Bezdek and Pal [39] presented a
framework for generalizing Dunn's index so that virtually
any combination of metrics for cluster separation and
cluster size could be used to define an index of cluster
quality. The Generalized Dunn's "intercluster distance"
V
GD
for a given cluster pair is the separation between clus-
ters normalized by their average diameter (hence favoring
tight, spherical groupings spaced far apart):
The separation, δ, and diameter, ∆, can be computed in a
variety of ways. Bezdek and Pal [39] presented six possible
methods for computing δ and three methods for comput-
ing ∆, and evaluated the performance of all possible com-
binations on six benchmark data sets. Based on the
successful performance results obtained in their simula-
tions, we selected the following definitions of δ and ∆:
In Eq. 1–3, X
i
denotes the set of data points in the cluster
corresponding to the i
th
task, x
i
denotes a data point con-
tained in X
i
(i.e. a vector of feature values derived from
one epoch of sensor data), |X
i
| the number of data points
in the i
th
cluster, and µ
i
the centroid of X
i
(i.e. mean over
all x
i
in X
i
). All vector distances are Euclidean, i.e.
. The separation δ is the sum of
the pairwise Euclidean distances between the centroid of
one cluster and all points in the other cluster, and vice
versa, divided by the total number of points in both clus-
ters. Cluster diameter ∆ is the average distance between
data points in the cluster and the cluster centroid, multi-
plied by a factor of 2 to convert each radius to a diameter.
Having chosen a CQI to measure similarity, the next step
was to define a hierarchy based on this information. Spe-
cifically, we used a linkage algorithm to build a dendro-
gram, a diagram in which similar objects are joined by
links whose vertical position indicates the level of similar-
ity between the objects. The average linkage algorithm, or
UPGMA (Unweighted Pair Group Method with Arithme-
tic Averages [40]), was selected because of its demon-
strated robustness to outliers [39]. This algorithm forms
links between two objects based on the average distance
between all pairs of lower-ranking objects. From the den-
drogram, a sequence of merging steps was derived starting
from the bottom level (no merging), and moving up one
node at a time, where each node represents the merging of
two lower nodes.
Implementation and Testing
To assess the effect of successive merges on the accuracy of
ambulatory task discrimination, a simple classifier was
applied at each point in the sequence. Linear discriminant
analysis (LDA) was selected for classification because its
parameterization is minimal and it is therefore well suited
to small data sets. Each level of merging was trained and
tested independently with a balanced set of data; i.e. a
data set sampled equally from each class. 75% of samples
in the data set were used to train the classifier, and the
remaining 25% were used in the testing. In addition, the
entire training and testing process was repeated for 100
rotations of the data set so that the performance estimates
(sensitivity and misclassification) would be less depend-
ent on epoch selection and less sensitive to outliers. Sensi-
tivity was defined as the number of times a task was
correctly detected divided by the number of epochs corre-
sponding to that task. Misclassification was defined as the
number of identifications of a particular task arising from
other tasks (i.e. incorrect detections of that task) divided
by the number of epochs corresponding to other tasks.
Results
High-level Classification
At the top level of the hierarchy, the set of 10 tasks was
split into three subcategories (ambulatory, sedentary with
legs moving, and sedentary with legs stationary) using a
simple threshold-based approach similar to that of
Mathie et al [2]. For all six subjects, 100% sensitivity and
0% misclassification were achieved by the following
criteria:
1) If mean of right thigh accelerometer (up-down axis) is
greater than 0.6 g, task is sedentary; otherwise, task is
ambulatory.
2) If task is sedentary and RMS of right thigh accelerome-
ter (anteroposterior axis) is high (e.g. greater than 0.1 g),
legs are moving; otherwise, legs are stationary.
VXX
XX
XX
GD s t
st
st
(,)
(,)
() ()
=
+
()
()
δ
1
2
1
∆∆
δµµ(,) (,) (,)XX
XX
dx dx
st
st
st
xX
ts
xX
ss tt
=
+
+
()
∈∈
∑∑
1
2
∆()
(, )
X
dx
X
i
ii
xX
i
ii
=
()
∈
∑
23
µ
dxy x y x y
T
(,)=−=
Journal of NeuroEngineering and Rehabilitation 2005, 2:16 />Page 8 of 14
(page number not for citation purposes)
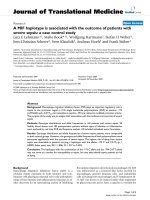
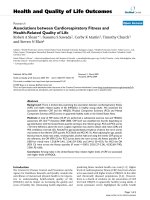
In Figure 3, mean of the right thigh accelerometer (up-
down axis) and RMS of the right thigh accelerometer
(anteroposterior axis) are plotted for epochs representing
all six subjects studied in order to demonstrate the efficacy
of this approach. However, it is clear that more features
will need to be taken into account in order to make further
distinctions among tasks, and it is uncertain whether there
is sufficient information in the data to make such distinc-
tions in all cases. In the following we demonstrate the use
of the CQI/cluster merging methods described earlier by
focusing on identification of 6 ambulatory tasks: walking
on a treadmill, level walking in a hallway, ascending/
descending stairs, and ascending/descending a ramp.
Ambulatory Task Classification
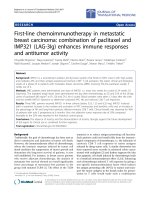
Results for LDA-based classification of six ambulatory
tasks are summarized in Figure 4. Only three out of the six
subjects had at least 25 epochs available for all ambula-
tory tasks, therefore results are shown only for these three
subjects (herein referred to as A, B, and C). For subjects A
and B, sensitivity improved from 79% to 98% and mis-
classification decreased from 4.2% to 1.9% as the number
High level separation of tasks (6 subjects)Figure 3
High level separation of tasks (6 subjects). A scatter plot of the root mean square (RMS) value of the accelerometer data
recorded in the antero-posterior direction from the right thigh vs. the mean value of the accelerometer data recorded from
the same sensor unit in the up-down direction demonstrates that certain categories of tasks can be easily discriminated using a
simple ruled-based approach. In fact, the plane can be divided into three regions containing the samples associated with motor
tasks related to ambulation, motor tasks performed in a seated position with legs moving, and motor tasks performed in a
seated position with legs stationary respectively.
-0.2 0 0.2 0.4 0.6 0.8 1 1.2
0.05
0.1
0.15
0.2
0.25
0.3
0.35
0.4
0.45
0.5
Mean R thigh (up-down)
RMS R thigh (antero-posterior)
Ambulatory
tasks
Seated tasks (legs moving)
Seated tasks (legs stationary)
treadmill
stationary bicycle
up incline
sweeping floor
folding laundry
arm ergometer
level walking
down incline
up stairs
down stairs
Journal of NeuroEngineering and Rehabilitation 2005, 2:16 />Page 9 of 14
(page number not for citation purposes)
of clusters decreased. For subject C, the merging of tasks
did not lead to substantial improvement because accuracy
was already quite high in the unmerged case.
Overall it appears that the method strongly favors merg-
ing tasks as much as possible. This is not a surprising
result since the probability of correctly classifying a sam-
ple by chance increases from 17% to 50% as the number
of clusters decreases from 6 to 2. The final decision about
what level of merging is appropriate must take into con-
sideration the context of the application. For instance, in
the case of COPD activity monitoring, the eventual goal is
to track physiological response over time associated with
variously strenuous activities. Therefore we would hesitate
to merge the tasks, for instance, of stair ascent and stair
descent because of the very different metabolic costs
associated with those activities. However, merging level
walking together with walking down an incline is an
acceptable loss of refinement if the overall detection accu-
racy is improved. Alternatively, an application might call
for a minimum level of sensitivity, in which case one
would choose the minimally merged set (i.e. that with the
greatest number of distinct clusters) meeting that crite-
rion. For example, setting a minimum sensitivity of 90%
Merging clusters for ambulatory tasksFigure 4
Merging clusters for ambulatory tasks. The barplots show sensitivity and misclassification for different levels of merging
for the three subjects from which it was possible to gather sufficient data to explore discriminating among motor tasks associ-
ated with ambulation. While for Subj C an accurate discrimination of 6 tasks was obtained and thus no dramatic change is
shown in sensitivity and misclassification when merging clusters, for Subj A and Subj B the increase in sensitivity and decrease
in misclassification when merging clusters is significant. Sensitivity above 90% can be achieved while discriminating among 4
motor tasks.
0%
2%
4%
6%
65432
No. of distinct classes after merging
Subj A
Subj B
Subj C
70%
80%
90%
100%
%Sensitivity% Misclassification
**
0% misclassification
rate for Subj C
*
Journal of NeuroEngineering and Rehabilitation 2005, 2:16 />Page 10 of 14
(page number not for citation purposes)
would lead to selection of the 4-cluster configuration for
subjects A and B and selection of the original unmerged
configuration for Subject C.
Detailed results for these subjects are shown in Figures 5,
6, and 7. Dendrograms of the cluster hierarchy, bar plots
of percent sensitivity and misclassification by task, and
scatter plots of the 1
st
and 2
nd
principal components of the
unmerged configuration are shown for comparison. All
three plots within a figure share a common color scheme.
For subject B, Figure 5 illustrates how the cluster hierarchy
shown in the dendrogram at left reflects the internal struc-
ture of the data that is visualized in the scatter plot at right.
Specifically, the bottom three tasks in the dendrogram
(level walking, down incline, and up incline), with a fairly
low linkage distance (0.6–0.7) are those with the most
overlap in the scatter plot. The next level up in the dendro-
gram is walking on a treadmill, and in the scatter plot it is
apparent that the corresponding points form a cluster that
is near but not overlapping with the first three. The
remaining two tasks are well separated in the scatter plot
from the first four tasks and from one another, and in fact
Classifier results for Subj BFigure 5
Classifier results for Subj B. Dendrogram, results of the LDA, and scatter plot of 1
st
and 2
nd
principal components are
shown for Subj B. The scatter plot shows that while the clusters associated with walking up stairs and walking down stairs are
clearly separated, the clusters associated with the other motor tasks significantly overlap. This is consistently shown, but in a
more quantitative way, by the dendrogram that also suggests a strategy for merging clusters. When such strategy is adopted
and an LDA algorithm is used, sensitivity and misclassification improve as shown by barplots. Dotted lines in the barplots are
indicative of the mean value of sensitivity and misclassification across tasks.
0 25 50 75 100% 0 5 10 15 20%
LDA Results (using test set)
% Sensitivity % Misclassification
level
walking
down
incline
up
incline
treadmill
up
stairs
down
stairs
0
0.2
0.4
0.6
0.8
1
1.2
1.4
1.6
Task
Linkage distance
Dendrogram (based on training set)
-5 0 5 10
-6
-4
-2
0
2
4
6
Principal Components
1st
2nd
down incline
up stairs
level walking
up incline treadmill
down stairs
0
0.2
0.4
0.6
0.8
1
1.2
1.4
1.6
Journal of NeuroEngineering and Rehabilitation 2005, 2:16 />Page 11 of 14
(page number not for citation purposes)
the linkage distances for these tasks are relatively high
(1.4–1.6).
In Figure 6, the dendrogram for subject A is also reflective
of the relationships among task clusters that are evident in
the accompanying scatter plot. Namely, there is a clear
three-way split in the scatter plot data, which corresponds
to three natural groupings. What is suggested by the scat-
ter plot corresponds to the second and third levels of
merging in the dendrogram, with the task of walking on a
treadmill showing the greatest linkage distance from the
other two sections. This example also shows that the den-
drogram is not strictly left-branching in all cases.
In the scatter plot for Subject C, shown at right in Figure
7, all six of the ambulatory tasks are well separated on the
basis of just the first two principal components. Indeed,
every task is identified with high accuracy, as seen in the
bar plots for the performance characteristics. The structure
of the dendrogram is consistent with these results as well,
because even the lowest tier has a comparatively high link-
age distance (≥ 1.75). This example demonstrates that
merging is not necessary in every case.
Discussion
We began this paper by reviewing recent work on using
accelerometers to monitor motor activities in the labora-
tory and field. In particular, we focused on Mathie et al's
[2] hierarchical framework as a useful way to formulate
Classifier results for Subj AFigure 6
Classifier results for Subj A. Dendrogram, results of the LDA, and scatter plot of 1
st
and 2
nd
principal components are
shown for Subj A. The information is herein presented as in Figure 5. However, different relationships among clusters are
shown in this figure. Accordingly, a different strategy to merge clusters was adopted.
-5 0 5 10
-4
-3
-2
-1
0
1
2
3
4
5
level
walking
down
incline
up
incline
treadmill
up
stairs
down
stairs
0
0.2
0.4
0.6
0.8
1
1.2
1.4
1.6
Linkage distance
Task
Dendrogram (based on training set) LDA Results (using test set)
% Sensitivity % Misclassification
Principal Components
0 25 50 75 100% 0 5 10 15 20%
1st
2nd
down incline
up stairs
level walking
up incline treadmill
down stairs
Journal of NeuroEngineering and Rehabilitation 2005, 2:16 />Page 12 of 14
(page number not for citation purposes)
the problem, and developed a methodology that would
extend this framework to handle more complex dynamic
tasks involving the upper and lower extremities. The
approach we have described combines existing cluster
analysis techniques (i.e. CQI, average linkage, dendro-
grams) in a way that is, to our knowledge, novel. To dem-
onstrate the application of this approach to a real data set,
the application of monitoring exercise and free-living
activities in subjects with COPD by means of accelerome-
ters was used. High-level classifications of the COPD data
did not require use of special techniques. Separation of
tasks into three primary groups was easily accomplished
using thresholds on two of the features derived from the
accelerometer signals for data across all 6 subjects. How-
ever for the discrimination of ambulatory tasks the merg-
ing technique was necessary in two out of the three
subjects for which enough data were available to explore
the classification of ambulatory tasks. Merging tasks was
necessary when clusters associated with some of the
motor tasks significantly overlapped. In the two subjects
for whom merging of clusters was necessary, the tech-
nique allowed us to improve average sensitivity by more
than 12% while retaining resolution of 4 tasks. In the
third subject, the detection was very good even for the
unmerged set, so merging did not have much effect on
performance.
Classifier results for Subj CFigure 7
Classifier results for Subj C. Dendrogram, results of the LDA, and scatter plot of 1
st
and 2
nd
principal components are
shown for Subj C. Contrary to what seen for Subj A and B, for Subj C the overlap among clusters is minimal and thus merging
clusters does not appear to be necessary.
-5 0 5 10
-4
-3
-2
-1
0
1
2
3
4
5
6
level
walking
up
incline
down
incline
treadmill
up
stairs
down
stairs
0
0.5
1
1.5
2
2.5
Task
Linkage distance
Dendrogram (based on training set) LDA Results (using test set)
% Sensitivity % Misclassification
0 25 50 75 100% 0 5 10 15 20%
Principal Components
1st
2nd
down incline
up stairs
level walking
up incline treadmill
down stairs
Journal of NeuroEngineering and Rehabilitation 2005, 2:16 />Page 13 of 14
(page number not for citation purposes)
An advantage of the technique proposed in this paper is
the considerable flexibility that it allows in choosing algo-
rithms to be used at different levels of the classifier hierar-
chy. This was demonstrated by our use of a simple rule-
based approach for discriminating ambulatory tasks and
tasks performed in a seated position in conjunction with
the use of LDA for distinguishing different types of ambu-
latory motor tasks. At any point of the procedure, the user
may select the approach that he/she considers most likely
to lead to reliable classification, and to reject merging of
clusters associated with certain motor tasks because their
discrimination is essential from a clinical point of view. If
merging is not acceptable from a clinical point of view, the
user has the option of either modifying the analysis to
account for the limited sensitivity and specificity attaina-
ble with the available data set (e.g. by substituting a differ-
ent classification algorithm), or adding wearable sensors
to gather information that may better distinguish pairs of
motor tasks associated with overlapping clusters.
It is worth mentioning that the methods demonstrated
herein are not limited to the particular type of data col-
lected in this experiment. They can be applied to nearly
any time series data of one or more features derived from
multiple sensors such as gyroscopes, EMG, and recon-
struction of continuous kinematic variables via wearable
sensors [16,41-43]. This work can also be used to identify
which subsets of tasks are most difficult to identify based
on the features available, and thereby help to diagnose
what type of sensor would help for distinguishing the task
(i.e. which type of sensor in what location would help
improve the classification of motor activities).
The application of the proposed technique to data gath-
ered from COPD patients points to an important area of
research in wearable systems. Monitoring the health status
of individuals undergoing cardiopulmonary rehabilita-
tion is indeed an important clinical application of weara-
ble systems. We believe that clinicians would be able to
better manage patients with COPD if information related
to the patient's level of motor activity and associated sys-
temic responses were monitored. We also believe that
monitoring would optimize exercise capacity achieved
and sustained by patients with COPD after participating
in a pulmonary rehabilitation program. Wearable sensors
are now available to monitor respiratory rate, heart rate,
and oxygen saturation in an unobtrusive way over exten-
sive periods of time [44,45]. As wearable systems that
include accelerometers and other inertial sensors have
become readily available [1], the need has grown for tools
such as we have proposed that facilitate the systematic
design of classifiers to identify motor activities. The next
step in our research on patients with COPD will be to
study the association of motor activities and systemic
responses. Data mining visualization techniques [46] will
be key in exploring ways to present this information to cli-
nicians in a manner suitable to prompt clinical interven-
tions when necessary.
Competing interests
The author(s) declare that they have no competing
interests.
Authors' contributions
All authors contributed to identifying the need for moni-
toring COPD patients and developing experimental pro-
cedures to gather clinically relevant data for the study.
DMS and PB contributed to designing the algorithms uti-
lized in the study. All authors contributed to the discus-
sion of the results.
Acknowledgements
The authors would like to thank the following members of the Brigham &
Women's Hospital Division of Pulmonary Rehabilitation for their assistance
in coordinating the scheduling and testing of patients in the study: Carol
Fanning, Sarah Hooper, Susan Peterson, and Priscilla Perruzzi. Also we are
appreciative of the efforts of Matthew Lazzara during the earliest phases of
data collection.
References
1. Bonato P: Wearable sensors/systems and their impact on bio-
medical engineering. IEEE Engineering in Medicine and Biology 2003,
22:18-20.
2. Mathie MJ, Celler BG, Lovell NH, Coster ACF: Classification of
basic daily movements using a triaxial accelerometer. Medi-
cal & Biological Engineering & Computing 2004, 42:679-687.
3. Mathie MJ, Coster ACF, Lovell NH, Celler BG: Accelerometry:
providing an integrated, practical method for long-term,
ambulatory monitoring of human movement. Physiological
Measurment 2004, 25:R1-R20.
4. Pitta F, Troosters T, Spruit MA, Mortier S, Barbier V, Coosemans I,
van Vliet M, Decramer M, R G: Physical Activity Level during
Daily Life in COPD Patients and Age Matched Healthy Con-
trols – Preliminary Results. 100th International Conference of the
American Thoracic Society; May 21–26; Orlando (Florida) 2004.
5. Kochersberger G, McConnell E, Kuchibhatla MN, Pieper C: The reli-
ability, validity, and stability of a measure of physical activity
in the elderly. Archives of Physical Medicine and Rehabilitation 1996,
77:793-795.
6. Bouten CV, Koekkoek KT, Verduin M, Kodde R, Janssen JD: A triax-
ial accelerometer and portable data processing unit for the
assessment of daily physical activity. IEEE Trans Biomed Eng
1997, 44:136-147.
7. Steele BG, Belza B, Cain K, Warms C, Coppersmith J, Howard J: Bod-
ies in motion: monitoring daily activity and exercise with
motion sensors in people with chronic pulmonary disease. J
Rehabil Res Dev 2003, 40:45-58.
8. Steele BG, Belza B, Hunziker J, Holt L, Legro M, Coppersmith J, Buch-
ner D, Lakshminaryan S: Monitoring daily activity during pulmo-
nary rehabilitation using a triaxial accelerometer. J
Cardiopulm Rehabil 2003, 23:139-142.
9. Moy ML, Blackadar T, Mentzer SJ, Reill JJ: Cumulative Field Moni-
toring of Ambulation in COPD. 100th International Conference of
the American Thoracic Society; May 21–26; Orlando (Florida) 2004.
10. Busser HJ, de Korte WG, Glerum EB, van Lummel RC: Method for
objective assessment of physical work load at the workplace.
Ergonomics 1998, 41:1519-1526.
11. Bussmann JB, Tulen JH, van Herel EC, Stam HJ: Quantification of
physical activities by means of ambulatory accelerometry: a
validation study. Psychophysiology 1998, 35:488-496.
12. Aminian K, Robert P, Buchser EE, Rutschmann B, Hayoz D, Depairon
M: Physical activity monitoring based on accelerometry: val-
Publish with Bio Med Central and every
scientist can read your work free of charge
"BioMed Central will be the most significant development for
disseminating the results of biomedical research in our lifetime."
Sir Paul Nurse, Cancer Research UK
Your research papers will be:
available free of charge to the entire biomedical community
peer reviewed and published immediately upon acceptance
cited in PubMed and archived on PubMed Central
yours — you keep the copyright
Submit your manuscript here:
/>BioMedcentral
Journal of NeuroEngineering and Rehabilitation 2005, 2:16 />Page 14 of 14
(page number not for citation purposes)
idation and comparison with video observation. Medical & Bio-
logical Engineering & Computing 1999, 37:304-308.
13. Foerster F, Fahrenberg J: Motion pattern and posture: correctly
assessed by calibrated accelerometers. Behavior research meth-
ods, instruments, & computers 2000, 32:450-457.
14. Schasfoort FC, Bussmann JB, Stam HJ: Ambulatory measurement
of upper limb usage and mobility-related activities during
normal daily life with an upper limb-activity monitor: a fea-
sibility study. Medical & Biological Engineering & Computing 2002,
40:173-182.
15. Schasfoort FC, Bussmann JB, Stam HJ: Impairments and activity
limitations in subjects with chronic upper-limb complex
regional pain syndrome type I. Arch Phys Med Rehabil 2004,
85:557-566.
16. Sherrill DM, Bonato P, De Luca CJ: A neural network approach
to monitor motor activities. 2nd Joint Meeting of the IEEE Engineer-
ing in Medicine and Biology Society and the Biomedical Engineering Society;
Houston 2002.
17. Keith RA: The Functional Independence Measure. Advances in
Clinical Rehabilitation 1987, 1:6-18.
18. Bussmann JB, Grootscholten EA, Stam HJ: Daily physical activity
and heart rate response in people with unilateral transtibial
amputation for vascular disease. Arch Phys Med Rehabil 2004,
85:240-244.
19. Keijsers NL, Horstink MW, van Hilten JJ, Hoff JI, Gielen CC: Detec-
tion and assessment of the severity of levodopa-induced dys-
kinesia in patients with Parkinson's disease by neural
networks. Mov Disord 2000, 15:1104-1111.
20. Manson AJ, Brown P, O'Sullivan JD, Asselman P, Buckwell D, Lees AJ:
An ambulatory dyskinesia monitor. J Neurol Neurosurg Psychiatry
2000, 68:196-201.
21. Keijsers NLW, Horstink MWIM, Gielen SCAM: Movement param-
eters that distinguish between voluntary movements and
levodopa-induced dyskinesia in Parkinson's disease. Human
Movement Science 2003, 22:67-89.
22. Sherrill DM, Hughes R, Salles SS, Akay M, Standaert D, Bonato P:
Using wearable technology to monitor motor fluctuations in
Parkinson's disease. 9th International Congress of Parkinson's Disease
and Movement Disorders; March 5–8; New Orleans (Lousiana) 2005.
23. Uswatte G, Miltner WH, Foo B, Varma M, Moran S, Taub E: Objec-
tive measurement of functional upper-extremity movement
using accelerometer recordings transformed with a thresh-
old filter. Stroke 2000, 31:662-667.
24. Bonato P, Hughes R, Sherrill DM, Black-Schaffer R, Akay M, Knorr B,
Stein J: Using wearable sensors to assess quality of movement
after stroke. 65th Annual Assembly American Academy of Physical Med-
icine and Rehabilitation; October 7–9; Phoenix (Arizona) 2004.
25. Foerster F, Smeja M: Joint amplitude and frequency analysis of
tremor activity. Electromyogr Clin Neurophysiol 1999, 39:11-19.
26. Steele BG, Holt L, Belza B, Ferris S, Lakshminaryan S, Buchner D:
Quantitating physical activity in COPD using a triaxial
accelerometer. Chest 2000, 117:1359-1367.
27. Murray CJL, Lopez AD: Mortality by cause for eight regions of
the world: global burden of disease study. Lancet 1997,
349:1269-1276.
28. Croxton TL, Weinmann GG, Senior RM, Wise RA, Crapo JD, Buist
AS: Clinical research in chronic obstructive pulmonary dis-
ease: needs and opportunities. Am J Respir Crit Care Med 2003,
167:1142-1149.
29. Sullivan SD, Ramsey SD, Lee TA: The Economic Burden of
COPD. Chest 2000, 117:5S-9S.
30. Moy ML, Mentzer SJ, Reilly JL: Ambulatory monitoring of cumu-
lative free-living activity. IEEE Engineering in Medicine and Biology
2003, 22:89-95.
31. Celli BR, Cote CG, Marin JM, Casanova C, Montes de Oca M, Mendez
RA, Pinto Plata V, Cabral HJ: The body-mass index, airflow
obstruction, dyspnea, and exercise capacity index in chronic
obstructive pulmonary disease. N Engl J Med 2004,
350:1005-1012.
32. Guyatt GH, Pugsley SO, Sullivan MJ, Thompson PJ, Berman L, Jones
NL, Fallen EL, Taylor DW: Effect of encouragement on walking
test performance. Thorax 1984, 39:818-822.
33. Celli BR, Rassulo J, Make BJ: Dyssynchronous breathing during
arm but not leg exercise in patients with chronic airflow
obstruction. N Engl J Med 1986, 314:1485-1490.
34. Pineda H, Haas F, Axen K, Haas A: Accuracy of pulmonary func-
tion tests in predicting exercise tolerance in chronic obstruc-
tive pulmonary disease. Chest 1984, 86:564-567.
35. Coronado M, Janssens JP, de Muralt B, Terrier P, Schutz Y, Fitting JW:
Walking activity measured by accelerometry during respira-
tory rehabilitation. J Cardiopulm Rehabil 2003, 23:357-364.
36. Jolliffe IT: Principal Components Analysis New York: Springer-Verlag;
1986.
37. Dunn JC: A fuzzy relative of the ISODATA process and its use
in detecting compact well-separated clusters. Journal of
Cybernetics 1973, 3:32-57.
38. Davies DL, Bouldin DW: A cluster separation measure. IEEE
Transactions on Pattern Analysis and Machine Intelligence 1979,
1:224-227.
39. Bezdek JC, Pal NR: Some new indexes of cluster validity. Sys-
tems, Man and Cybernetics, Part B, IEEE Transactions on 1998,
28:301-315.
40. Sokal RR, Michener CD: A statistical method for evaluating sys-
tematic relationships. Sci Bull University of Kansas 1958,
38:1409-1438.
41. Aminian K, Najafi B, Bula C, Leyvraz P-F, Robert P: Spatio-temporal
parameters of gait measured by an ambulatory system using
miniature gyroscopes. Journal of Biomechanics 2002, 35:689-699.
42. Mayagoitia RE, Nene AV, Veltink PH: Accelerometer and rate
gyroscope measurement of kinematics: an inexpensive alter-
native to optical motion analysis systems. Journal of
Biomechanics 2002, 35:537-542.
43. Najafi B, Aminian K, Loew F, Blanc Y, Robert PA: Measurement of
stand-sit and sit-stand transitions using a miniature gyro-
scope and its application in fall risk evaluation in the elderly.
IEEE Transactions on Bio-Medical Engineering 2002, 49:843-851.
44. Asada HH, Shaltis P, Reisner A, Rhee S, Hutchinson RC: Mobile
monitoring with wearable photoplethysmographic
biosensors. IEEE Eng Med Biol Mag 2003, 22:28-40.
45. Dunne LE, Brady S, Smyth B, Diamond D: Initial development and
testing of a novel foam-based pressure sensor for wearable
sensing. J Neuroengineering Rehabil 2005, 2:4.
46. Fayyad U, Grinstein G, Wierse A: Information Visualization in Data Min-
ing and Knowledge Discovery San Francisco, CA: Morgan Kaufmann;
2002.