báo cáo hóa học: " The development of postural strategies in children: a factorial design study" doc
Bạn đang xem bản rút gọn của tài liệu. Xem và tải ngay bản đầy đủ của tài liệu tại đây (325.72 KB, 11 trang )
BioMed Central
Page 1 of 11
(page number not for citation purposes)
Journal of NeuroEngineering and
Rehabilitation
Open Access
Research
The development of postural strategies in children: a factorial
design study
Maurizio Schmid*
1
, Silvia Conforto
1
, Luisa Lopez
2
, Paolo Renzi
3
and
Tommaso D'Alessio
1
Address:
1
Dipartimento di Elettronica Applicata, Università degli Studi "Roma TRE", Italy,
2
Unità di Neurologia Infantile, Università degli Studi
di Roma "Tor Vergata", Italy and
3
Dipartimento di Psicologia, Università degli Studi di Roma "La Sapienza", Italy
Email: Maurizio Schmid* - ; Silvia Conforto - ; Luisa Lopez - ;
Paolo Renzi - ; Tommaso D'Alessio -
* Corresponding author
Postural ControlDevelopmentChildren
Abstract
Background: The present study investigates balance control mechanisms, their variations with
the absence of visual input, and their development in children from 7 to 11 years old, in order to
provide insights on the development of balance control in the pediatric population.
Methods: Posturographic data were recorded during 60 s trials administered on a sample
population of 148 primary school children while stepping and then quietly standing on a force plate
in two different vision conditions: eyes closed and eyes open. The extraction of posturographic
parameters on the quiet standing phase of the experiment was preceded by the implementation of
an algorithm to identify the settling time after stepping on the force plate. The effect of different
conditions on posturographic parameters was tested with a two-way ANOVA (Age × Vision), and
the corresponding eyes-closed/eyes-open (Romberg) Ratios underwent a one-way ANOVA.
Results: Several posturographic measures were found to be sensitive to testing condition (eyes
closed vs. eyes open) and some of them to age and anthropometric parameters. The latter
relationship did not explain all the data variability with age. An evident modification of postural
strategy was observed between 7 and 11 years old children.
Conclusion: Simple measures extracted from posturographic signals resulted sensitive to vision
and age: data acquired from force plate made it possible to confirm the hypothesis of the
development of postural strategies in children as a more mature selection and re-weighting of
proprioceptive inputs to postural control in absence of visual input.
Background
Postural control has been studied throughout a century
and a half [1], and the development of balance character-
istics associated with the emergence and refinement of
motor control has been investigated for three decades [2].
Central Nervous System (CNS) responses and
developmental changes occurring in the first years of life
have been deeply studied by Assaiante [3], and Woollacott
Published: 30 September 2005
Journal of NeuroEngineering and Rehabilitation 2005, 2:29 doi:10.1186/1743-0003-2-29
Received: 17 December 2004
Accepted: 30 September 2005
This article is available from: />© 2005 Schmid et al; licensee BioMed Central Ltd.
This is an Open Access article distributed under the terms of the Creative Commons Attribution License ( />),
which permits unrestricted use, distribution, and reproduction in any medium, provided the original work is properly cited.
Journal of NeuroEngineering and Rehabilitation 2005, 2:29 />Page 2 of 11
(page number not for citation purposes)
and Shumway-Cook [4]. The quantitative analysis of
human movement and posture has been generally
exploited on children population to study biomechanical
effects on gross motor skills driven by the presence of
diverse pathologies, such as Cerebral Palsy [5-8], Spinal
Cord Injury [9], and Muscular Dystrophies [10,11]. Start-
ing from the work of Williams et al [12], in more recent
years researchers extended the application of quantitative
posturography to fine cognitive or learning disabilities
[13], autism [14,15], Developmental Coordination Disor-
der (DCD) [16], Attention Deficit Hyperactivity Disorder
(ADHD) [17], and dyslexia [18].
Quantitative posturography can thus be applied to obtain
functional markers on fine competencies and their devel-
opment. For instance, a perturbation in posture with chal-
lenges such as a compliant surface [19], or a concurrent
cognitive task [20], can help to enlighten possible adjust-
ment strategies or deficiencies, or to monitor balance con-
trol variations with age [21]. However, findings obtained
from other researchers show some contradictions with the
above: as an example, the study of simple orthostatic pos-
ture with eyes open has been proven unsuccessful in dif-
ferentiating controls from autistic patients [15], and
children with DCD from controls [16]. Thus, this applica-
tion field, though promising, needs to be more deeply
investigated.
The quantitative analysis of postural control is generally
based on data acquired by a force plate that allows one to
determine the instantaneous position of the Ground
Reaction Force application point, which is referred to as
Centre of Pressure (CoP). Several parameters in the time
and/or frequency domain [22] are then extracted from
these data, or from surrogate functions derived from them
[23]. Even if this technique does not allow direct detection
of body oscillations, which can be estimated through the
use of ad hoc motion analysis systems, the relative sim-
plicity of the set up has encouraged researchers to consider
the CoP oscillations as an indirect measure of postural
sway [24].
When dealing with posturographic measures, the detec-
tion of the stabilization time after stepping on the force
plate is crucial: the majority of the parameters used to
define the postural ability are summary measures, and
their application is based on the assumption of stationar-
ity, in that the statistical properties of the underlying data
do not significantly change over time. In presence of a
transitory response to an event, such as standing up from
a chair or stepping on the force plate, this assumption can-
not be considered as valid. Thus the transitory response
should be excluded from the analysis. By analysing the
first and second order moment of the CoP trajectory, Car-
roll and Freedman [25] estimated this non-stationary
interval to be about 20 seconds long. This assumption can
be however challenged by considering that the transitory
phase due to a similarly demanding perturbation, such as
the Sit to Stand task, has been estimated in about 3 sec-
onds [26]. Carpenter et al. [27] showed that the first order
moment of the CoP Power Spectral Density could give
insights on the duration of the transitory response.
A significant age dependence of the postural measures has
been demonstrated [28,29]: from a longitudinal study,
Kirschenbaum et al. [30] showed that the control strategy
to maintain balance does not follow a simple linear rela-
tionship with age, but a step-like transition at the age of 6
to 8 years occurs. This hypothesis can be linked to a clear
rise in normalized stability limits to adult levels at age 7,
as calculated by Riach and Starkes [31] by asking children
to lean as far as they could in the four directions (forward,
backward, left, and right) while standing. These results
suggest that, at that age, the exploratory behaviour is
reached, and thus the child has to work with a new strat-
egy, which takes into account both open loop and closed
loop components of balance control. By analysing pos-
tural responses to unpredicted translations of the base of
support, Sundermier et al. [32] hypothesized that the
development of postural control follows the maturation
of fine competencies in muscle coordination.
A variety of posturographic parameters have been shown
to depend on biomechanical and anthropometric factors,
such as height or weight [33], and when extracting the
CoP mean amplitude on a sample population ranging
from 7 to 80 years, Peterka showed no changes with age if
normalization with height was performed [34].
Table 1: Population anthropometric data
Age Group Y7 Y9 Y11
N413828
Age (yrs) 7.0 ± 0.3 (Range 6.5–7.5) 9.0 ± 0.3 (Range 8.0–9.8) 11.0 ± 0.3 (Range 10.5–12.0)
Height (m) 1.22 ± 0.06 1.34 ± 0.07 1.46 ± 0.06
Weight (kg) 25.3 ± 4.7 32.5 ± 7.1 43.1 ± 8.7
BMI (kg/m
2
) 17.0 ± 2.1 18.0 ± 2.8 20.0 ± 3.1
Journal of NeuroEngineering and Rehabilitation 2005, 2:29 />Page 3 of 11
(page number not for citation purposes)
Thus, the question remains as to whether there is any reli-
able marker extracted from posturographic data that can
give insights on the development of balance control, and
whether age significantly affects posturographic data or
changes as simply the result of anthropometric factors.
Aim of the present study is to investigate mechanisms
involved in the development of postural stability by
attempting to answer these questions.
Methods
Participants
148 children were selected from classes of three different
grades in one primary school, after obtaining proper
informed consent from parents and teachers to participate
in the study. None of the children had educational needs
or certified disabilities. After the collection of height and
weight, they were screened with a three-sided testing pro-
cedure: Quantitative Posturography, Physical Examina-
tion for Neurological Subtle Signs (PANESS), and
Teachers' Rating. For the present study, PANESS Assess-
ment [35] and Teachers' Rating were used for inclusion
criteria for the sample population, and by excluding sub-
jects outside 10
th
-90
th
percentile, the resulting sample size
for data analysis on Quantitative Posturography was
reduced to 107 children, divided into three age groups (n
= 41 for Seven Years' Group, Y7, n = 38 for Nine Years'
Group, Y9, and n = 28 for Eleven Years' Group, Y11).
Table 1 summarizes data on participants, and Table 2 pro-
vides information on PANESS and Teachers' Rating.
Procedure
A posturographic test was performed, which consisted of
2 tests of upright stance (lasting 60 seconds each) corre-
sponding to two different conditions: standing with eyes
Table 2: Teachers' Rating and PANESS Assessment
Teachers' Rating
Cluster Definition Score
Read and Write reading: speed and correctness writing: tract quality and
correctness oral language production (vocabulary richness and
fluency and structure)
Scoring 0–3
0 is best score
Arithmetics Arithmetics text: reading and placing numbers
Arithmetcs logic: operations
Sequences: understands and repeats sequences days, months,
alphabets and multiplication tables
Scoring 0–3
0 is best score
Attention and Movement Motor activity in the gym/garden: follow instructions without
confusing left-right, in/out
Motor activity in class: from being able to sit still, to fine
movements to gross movements he cannot avoid Attention:
attention span
Scoring 0–3
0 is best score
Behavior: creativity: having many interests
Social behavior: being integrated in class group and having friends
Team working: following group rules
Autonomy: not needing continuous instructions
Scoring 0–3
0 is best score
PANESS*
Cluster Definition Score
Errors errors on tip-toe walking
errors on heel walking
errors on nose-finger (right)
errors on nose-finger (left)
scoring 0–3, depending on total number of
errors (oscillations or falls during walking,
misses or wrong fingers during other tests)
Precision Index-little tapping on thumb (right)
Index-little tapping on thumb (left)
Tandem walking
sequence of movements is correct from index
to little with no repetitions or misses
independently of rhythm Scoring 0–3.
Rhythm Index-little tapping on thumb (right)
Index-little tapping on thumb (left)
Tandem walking
the self chosen rhythm is kept during task
independently of misses of repetitions.
Scoring 0–3.
*Adapted from Denckla [35].
Total scores for PANESS and Teachers' Rating were obtained by summing each cluster value. Subjects were excluded if at least one total score was
outside [10–90] percentile.
Journal of NeuroEngineering and Rehabilitation 2005, 2:29 />Page 4 of 11
(page number not for citation purposes)
open (EO), and standing with eyes closed (EC). Between
tests an interval of 2 minutes was allowed.
Participants were asked to select a comfortable side-by-
side feet position, with their arms relaxed, then make a
step forward and position themselves in the middle of the
force plate, as indicated by stickers, maintaining a quiet
stance. Data acquisition started immediately prior to the
subject stepping on the force plate. Illumination and
noise were kept under control: diffuse artificial illumina-
tion of approximately 40 lux, no remarkable fixed sound
sources, experiment performed during lesson time.
Table 3: Posturographic Parameters Definition
Posturographic Parameter Acronym Definition
Mean Velocity MV
Mean Amplitude MA
Sway Area SA
Mean Frequency MF
Mean Power Frequency{AP, ML} MPF
{AP, ML}
Centroidal Frequency {AP, ML} CF
{AP, ML}
Frequency at 95% {AP, ML} F95
{AP, ML}
T represents the total time for processing (30 s), and CoP
{AP, ML}
are considered as purged of their mean value
1
22
0
T
COP t
t
COP t
t
dt
AP ML
T
∂
∂
+
∂
∂
∫
() ()
1
0
T
COP t dt
R
T
()
∫
1
2
0
T
COP t
t
COP t
COP t
t
COP t
AP
ML
ML
AP
T
∂
∂
⋅−
∂
∂
⋅
()
()
()
()
∫∫
dt
1
2
22
0
0
T
COP t
t
COP t
t
dt
T
CoP t dt
AP ML
T
R
T
∂
∂
+
∂
∂
()
∫
() ()
π
∫∫
fP fdf
Pfdf
COP
Fc
COP
Fc
⋅
∫
∫
{AP,ML}
{AP,ML}
()
()
/
/
0
2
0
2
fP fdf
Pfdf
COP
Fc
COP
Fc
2
0
2
0
2
⋅
∫
∫
{AP,ML}
{AP,ML}
()
()
/
/
f P fdf P fdf
COP
f
COP
Fc
:(). ()
/
{AP,ML} {AP,ML}
00
2
095
∫∫
=⋅
Pf CoPtedt
COP
jft
T
{AP,ML}
{AP,ML}
()=
()
∫
1
2
2
0
2
π
π
Journal of NeuroEngineering and Rehabilitation 2005, 2:29 />Page 5 of 11
(page number not for citation purposes)
Relevant force and torque components were low-pass fil-
tered (corner frequency 20 Hz, 8
th
order elliptical filter,
stopband attenuation 80 dB at 30 Hz, attenuation slope
135 dB/octave) and fed to an AD converter (100 samples/
s, DAQCard™-AI-16E-4, by National Instruments Corpo-
ration), and then processed to obtain the Centre of Pres-
sure trajectories in both antero/posterior and medio/
lateral directions, CoP = {CoP
AP
(t), CoP
ML
(t)}. The maxi-
mum of the vertical component of the ground reaction
force marked the subject's stepping on the force plate.
Feature Extraction
A set of 10 summary measures were extracted from CoP
data. All of them are defined and summarized in Table 3,
and denoted as Posturographic Parameters (PP).
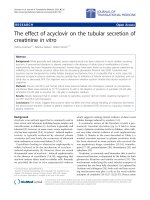
A sample of processed data is represented in Figure 1.
Together with the CoP
AP
trajectory over time, the time his-
tory of the corresponding instantaneous mean frequency
has been depicted: Following the rationale exposed in
[27], in the present work the instantaneous mean fre-
quency (IMF) of the CoP
AP
trajectory was considered as a
marker for the time needed to stabilize, its value was esti-
mated, for every time instant t, using a complex covari-
ance approach [36]. The settling time T
set
was then defined
as the time instant when the steepest decrease of IMF
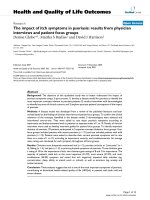
occurs. This choice can be justified from experimental evi-
dence, i.e. the behaviour of parameters object of the anal-
ysis. Using the Mean Amplitude as an example, Figure 2
shows how, after T
set
, the actual value of the parameter
does not remarkably vary over time. The same applies for
all the parameters object of the analysis.
All PPs were calculated by retaining the first 30 seconds
after T
set
. Four of them can be directly extracted from the
CoP trajectory, while the remaining six are used to charac-
terize the shape of the Power Spectral Density: in particu-
lar, the Mean Power Frequency and the Centroidal
Frequency are respectively representative of the barycentre
and the dispersion of the Power Distribution in the fre-
quency domain, i.e. the Power Spectral Density. F95% is
finally representative of the overall breadth of the
Spectrum.
PPs underwent statistical analysis, and, for each of them,
the corresponding Romberg Ratio (RR), defined as the EC
condition measure divided by the EO measure, was also
computed and fed to statistics, as described in the
following.
Acquired dataFigure 1
Acquired data. A sample of time histories for the Centre of Pressure trajectory in Antero-Posterior direction (CoP
AP
, light
gray), and instantaneous mean frequency extracted from CoP
AP
. The settling time T
set
is also shown (black dotted line). All the
Posturographic Parameters were calculated over the time period [T
set
, T
set
+30].
Journal of NeuroEngineering and Rehabilitation 2005, 2:29 />Page 6 of 11
(page number not for citation purposes)
Instantaneous Mean FrequencyFigure 2
Instantaneous Mean Frequency. A sample of time history for the Instantaneous Mean Frequency for the Centre of Pres-
sure Antero-Posterior (upper panel), and the Mean Amplitude value, as calculated by using 30 s starting from the correspond-
ing time instant (lower panel). The settling time T
set
used for the actual parameter estimation is also shown (black vertical line).
Journal of NeuroEngineering and Rehabilitation 2005, 2:29 />Page 7 of 11
(page number not for citation purposes)
Statistical Analysis
All PPs were analyzed through a two-way ANOVA, with
vision (EO vs. EC) and age as factors. Each condition was
then separately analyzed for parameters exhibiting age
effect, in the following way: Bartlett's test verified homo-
geneity of variances, and for parameters exhibiting differ-
ent variances, Welch's ANOVA was run instead of
traditional ANOVA; a Post Hoc Test for trend was also
applied to different age groups.
For the whole population sample, possible relationships
between PPs (dependent variables) and selected subject-
specific parameters (predictors) were sought to test if dif-
ferences were dependent on anthropometric factors, such
as body mass (m), height (h), and body mass index (BMI
= m/h
2
). The linear correlation between parameters and
predictors was measured through the Pearson product-
moment coefficient of correlation (r), and deemed relia-
ble if a two-tailed test of significance applied to this coef-
ficient, had p ≤ 0.05. The percentage of each PP variance
that can be explained by each reliable predictor was then
calculated, and denoted as σ
exp
2
.
Then, to test changes for significant interaction between
age and vision, the Romberg Ratios (RR) for each param-
eter underwent a one-way ANOVA, with age as factor.
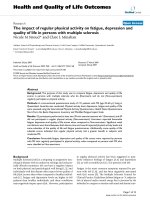
Results
Figure 3 summarizes sample population mean values and
standard deviations for all PPs. Mean Values in EO condi-
tions for Mean Velocity, Mean Amplitude and Sway Area
were all fairly higher than those obtained on a healthy
population of young adults [37]. The same did not apply
to all the frequency features: Mean Power Frequency in
antero-posterior (AP) direction was higher in children
than in adults whereas the corresponding Centroidal Fre-
quency was almost equal: thus, in children the CoP trav-
elled faster, farther, and with substantially different
spectral features than in adults.
As far as the differential analysis is concerned, most of the
PPs were affected by vision, partly as a function of age: the
effect of vision was statistically significant in MV, SA, MA,
and in all the spectral parameters. This effect was more
evident in amplitude parameters, thus confirming that,
Posturographic parametersFigure 3
Posturographic parameters. Mean values and standard errors in each age group, divided by vision condition. Underneath
each column pair, the corresponding Romberg Ratio mean values and standard deviation is shown.
Mean Velocity
EO EC EO EC EO EC
0
10
20
1.35r0.40 1.38r0.50 1.36r0.38
RR
Y7 Y9 Y11
(mm/s)
Sway Area
EO EC EO EC EO EC
0
10
20
30
40
50
60
70
80
2.04r1.25 2.33r2.01 1.79r0.92
RR
Y7 Y9 Y11
(mm
2
/s)
Mean Amplitude
EO EC EO EC EO EC
0
3
6
9
12
1.40r0.36 1.33r0.51 1.18r0.30
RR
Y7 Y9 Y11
(mm)
Mean Frequency
EO EC EO EC EO EC
0.1
0.2
0.3
0.4
0.5
1.04r0.37 1.09r0.31 1.18r0.29
RR
Y7 Y9 Y11
(Hz)
Mean Power Frequency ML
EO EC EO EC EO EC
0.20
0.25
0.30
0.35
0.40
1.05r0.55 1.17r0.56 1.29r0.50
RR
Y7 Y9 Y11
(Hz)
Centroidal Frequency ML
EO EC EO EC EO EC
0.4
0.6
0.8
1.0
1.2
1.27r0.78 1.22r0.66 1.56r0.97
RR
Y7 Y9 Y11
(Hz)
Frequency 95% ML
EO EC EO EC EO EC
0.6
0.8
1.0
1.2
1.4
1.07r0.41 1.12r0.40 1.29r0.43
RR
Y7 Y9 Y11
(Hz)
Mean Power Frequency AP
EO EC EO EC EO EC
0.20
0.25
0.30
0.35
0.40
0.45
1.10r0.65 1.07r0.44 1.45r0.70
RR
Y7 Y9 Y11
(Hz)
Centroidal Frequency AP
EO EC EO EC EO EC
0.4
0.6
0.8
1.0
1.2
1.20r0.76 1.24r0.70 1.59r0.60
RR
Y7 Y9 Y11
(Hz)
Frequency 95% AP
EO EC EO EC EO EC
0.6
0.8
1.0
1.2
1.4
1.08r0.43 1.06r0.40 1.49r0.69
RR
Y7 Y9 Y11
(Hz)
Journal of NeuroEngineering and Rehabilitation 2005, 2:29 />Page 8 of 11
(page number not for citation purposes)
regardless of age, CoP displacement and velocity
increased without visual input.
As reported in Table 4, age affected MA, i.e. the lower the
age, the greater the CoP displacement. Moreover, two fre-
quency parameters in AP direction, F95
AP
, and CF
AP
, were
significantly affected by vision: the spectrum of CoP in AP
direction was fairly broadened, even if MPF
AP
did not sig-
nificantly increase. Moreover, F95
AP
was also dependent
on the interaction, i.e. its variations with respect to vision
were significantly different depending on age.
Table 5 shows one-way ANOVA results for the effect of age
on MA, CF
AP
, and F95
AP
in both vision conditions: Mean
Amplitude did not significantly vary in EO, whereas a sig-
nificant (p < 0.005) and non-random (Test for Trend p <
0.05) effect of age was revealed in EC; CoP mean devia-
tion from its mean position actually decreased with age in
no-vision condition (EC), and from Bartlett's Test it can
also be speculated that the decrease in variance could be a
sign of more homogeneous behaviour. The broadening of
the spectrum enlightened by the previous results was prin-
cipally due to the significant increase of F95
AP
with age in
EC condition (Test of Trend p < 0.005), with a significant
change in F95
AP
variability.
The correlation with anthropometric and biomechanical
factors yielded the following results: only frequency
parameters in EC condition, namely CF
AP
and F95
AP
, were
found to be slightly dependent on mass and height, but
none of them could be satisfactorily predicted by these
factors (see Table 6), as the percentage of explained vari-
ance did not exceed 10% in any of them. MPF
AP
was
slightly dependent on height, though the percentage of
explained variance was only 4%. Thus, the confounding
effect driven by the chosen anthropometric factors can be
disregarded in this study.
As a final point, the Romberg Ratios (EC/EO) revealed
mean values greater than 1 for all the parameters (see
Table 4: Two-Way ANOVA p-values for posturographic parameters
PP Age Vision Interaction
MV - (0.44) ** (p < 0.001) - (0.99)
SA - (0.15) ** (p < 0.001) - (0.50)
MA * (0.014) ** (p < 0.001) - (0.31)
MF - (0.18) - (0.15) - (0.40)
MPF
ML
- (0.82) - (0.13) - (0.23)
CF
ML
- (0.89) * (0.022) - (0.46)
F95
ML
- (0.42) * (0.036) - (0.28)
MPF
AP
- (0.18) * (0.046) - (0.14)
CF
AP
* (0.034) * (0.013) - (0.24)
F95
AP
* (0.030) * (0.009) * (0.032)
-: Not Significant
*: p < 0.05
**: p < 0.005
Table 5: Effect of age on Posturographic Parameters
PP Age Bartlett's Test Test for Trend
MA (EO) - (0.22) * (0.046) - (0.21)
MA (EC) ** (0.0037) ** (0.0003) * (0.01)
CF
AP
(EO) - (0.27) * (0.044) - (0.38)
CF
AP
(EC) - (0.10) - (0.417) * (0.035)
F95
AP
(EO) - (0.51) - (0.929) - (0.70)
F95
AP
(EC) ** (0.005) - (0.704) ** (0.002)
- : Not Significant
* : p < 0.05
** : p < 0.005
One-way ANOVA with post hoc tests for PPs resulting in a significant effect of age, separated for vision condition: Welch ANOVA test was applied
for unequal variances resulting from Bartlett's Test (i.e. on first three rows).
Journal of NeuroEngineering and Rehabilitation 2005, 2:29 />Page 9 of 11
(page number not for citation purposes)
Figure 3): in particular, a significant effect of age on MPF
AP
and F95
AP
was revealed, which could be the result of a sig-
nificant broadening of the Power Spectral Density in EC
condition in Y11. Welch's test revealed significant differ-
ences on RR variances for MPF
AP
and F95
AP
(see Table 7).
Discussion
A large number of posturographic measures were sensitive
to the testing condition (i.e. eyes open vs. eyes closed). If
the trajectory of the CoP can be considered as an indirect
measure of postural sway, and thus a marker for the con-
trol of stance, the presented results confirm the well-
known thesis that visual input contribution plays a
relevant role in postural stabilization. From the results on
MV, SA, and MA, it is indeed possible to state that, with
eyes closed, the CoP displacement and velocity increased
relative to eyes open. It is known that also young adults
can improve postural performance by using visual targets
[38], and that closing eyes affects postural measures [22].
Ratios between EC and EO in the present study, however,
were rather different from those obtained by Prieto [22]
on young adults: restricting the analysis to time domain
measures, thus including MF which is a surrogate param-
eter for time domain measures, similar ratios resulted for
MV, SA, and MF. On the other hand, MA ratios tended to
young adults' figures only at 11 years, while remaining
higher for the other ages. For the frequency domain meas-
ures, all RR on both CF and F95 revealed higher values
than young adults [22], while no comparison was possi-
ble for MPF, which is by definition different from the
Median Frequency computed by Prieto. Moreover, Prieto
removed very low frequency (f < 0.15 Hz) shares to
spectral measures, and thus a comparison could be
affected by this choice.
A graphical schema of changes in postural sway is repre-
sented in Figure 4. A non monotonous trend with age was
present: the control of balance, though not to be consid-
ered complete at the last stage (Y11), was rather different
from the early stages (Y7 and Y9), and confirmed the
hypothesis of a nonlinear development of postural
control, consistent with [30,31]. To be more specific, if the
overall postural performance could be summarized
through the MA measure, a clear transition occurred
between 9 and 11 years. At 7 and 9 years, the possible
presence of a change of strategy in EC condition did not
compensate for the absence of vision, thus resulting in an
overall increase of MA. At 11 years, a change on the
Table 6: Anthropometric effect on posturographic parameters
PP Mass Height BMI
p σ
exp
2
p σ
exp
2
p σ
exp
2
MPF
AP
(EC) - (0.061) - * (0.040) 4.0% - (0.40) -
CF
AP
(EC) * (0.013) 5.8% * (0.009) 6.3% - (0.18) -
F95
AP
(EC) * (0.0055) 7.1% * (0.0058) 7.0% - (0.0945) -
- : Not Significant
* : p < 0.05
** : p < 0.005
Regression Analysis on PP resulting in a dependence with at least one anthropometric factor. p-value, and percentage of the explained variance with
the corresponding anthropometric predictor, if significant.
Table 7: Romberg Ratios: effect of age
RR Age Welch's Test Test for Trend
SA - (0.35) - (0.30) - (0.49)
MA - (0.14) - (0.053) - (0.051)
MPF
AP
* (0.025) * (0.045) * (0.020)
CF
AP
- (0.13) -(0.24) - ()
F95
AP
** (0.0012) * (0.015) ** (0.0014)
- : Not Significant
* : p < 0.05
** : p < 0.005
One-way ANOVA p-values for Romberg Ratios, with age as factor: significance, Welch's Test for variances, and post hoc test of trend.
Journal of NeuroEngineering and Rehabilitation 2005, 2:29 />Page 10 of 11
(page number not for citation purposes)
efficacy of strategy occurred, as confirmed by the signifi-
cant variations on the spectral features of the CoP trajec-
tory, both in antero-posterior and in medio-lateral
directions, which determined a significant decrease of MA
RR in Y11 with respect to Y9 and Y7. The invariance of
both MV and its corresponding Romberg Ratio may con-
ceal two diverse behaviours: at 7 and 9 years, the line inte-
gral increased with occluded vision mostly due to the
increase of the oscillation amplitude, while at 11 it rises
because of an increase in frequency of self-sustained oscil-
lations. Basically, when the child is younger, up to 9 years,
her/his postural control with eyes closed relies on major
adjustments, characterized by more ample oscillations,
and the child probably needs to move to different spots
and remain on those until the next adjustment. After that
age, data of the present work would suggest that the child
can apply minor adjustments that happen over a smaller
trajectory, but with higher frequency components, as
shown by the substantial increase of F95%
AP
, and there is
no need for big excursions, although overall the path
remains constant. The substantial increase of data varia-
bility in Romberg Ratios for F95%
AP
in Y9 with respect to
Y7 and Y11 confirms the hypothesis of a change in strat-
egy around that age. This evidence is in accordance with
the hypothesis of a more mature selection and re-weight-
ing of proprioceptive inputs to postural control: a major
role of this kind of afferents could result in an increase of
the high frequency contributions to postural sway [39],
and thus in a broadening of the spectrum. The presented
results are in accordance with the presence of a non line-
arity in balance control processes, as evidenced by Hay
and Redon [40], who justify this step-like behaviour
through the refinement of on-line control, once the feed-
forward mode has been efficiently developed, and by
Baumberger et al. [41], who showed that the age of 10 is
a critical point in the development of the visual control of
stability.
Conclusion
The obtained results are in favour of a non monotonic
development of postural strategies in children, slightly
dependent on anthropometric factors: the role of vision
clearly varies within the studied age range, and probably
the maturation of balance control is not yet complete,
even at the age of 11. Finally, another question is to be
unveiled: is the maturation of balance control paralleled
by a corresponding change in cognitive processes? The
application of dual tasks, such as a concurrent cognitive
one, in the execution of quiet stance trials could help in
providing information on this issue.
Acknowledgements
The authors are indebted to Prof. Aurelio Cappozzo, who provided the
force plate for the experiments, to PsyD Annalisa Conte, for her help in
data collection, and to the anonymous reviewers for their constructive
feedbacks and comments. The help of the class teachers of the "Istituto
Comprensivo Indro Montanelli" is greatly acknowledged. Work partially
supported by MIUR.
References
1. Romberg MH: A Manual of the Nervous Diseases of Man London, Eng-
land: Sydenham Society; 1853.
2. Kohen-Raz R: Developmental patterns of static balance ability
and their relation to cognitive school readiness. Pediatrics
1970, 46(2):276-285.
3. Assaiante C: Development of locomotor balance control in
healthy children. Neurosci Biobehav Rev 1998, 22(4):527-532.
4. Woollacott MH, Shumway-Cook A: Changes in posture control
across the life span–a systems approach. Phys Ther 1990,
70(12):799-807.
5. Damiano DL, Abel MF: Relation of gait analysis to gross motor
function in cerebral palsy. Dev Med Child Neurol 1996,
38(5):389-396.
6. Nashner LB, Shumway-Cook A, Marin O: Stance posture control
in selected group of children with cerebral palsy: Deficits in
sensory organization and muscular coordination. Exp Brain
Res 1983, 49:393-409.
7. Ferdjallah M, Harris GF, Smith P, Wertsch JJ: Analysis of postural
control synergies during quiet standing in healthy children
and children with cerebral palsy. Clin Biomech 2002,
17(3):203-210.
8. Harris GF, Riedel SA, Matesi D, Smith P: Standing postural stabil-
ity assessment and signal stationarity in children with cere-
bral palsy. IEEE Trans Biomed Eng 1993, 1:35-42.
9. Smith PA, Hassani S, Reiners K, Vogel LC, Harris GF: Gait analysis
in children and adolescents with spinal cord injuries. J Spinal
Cord Med 2004, 27:S44-S49.
Postural development schemaFigure 4
Postural development schema. A schematical represen-
tation of three parameters extracted from each population:
the minor axis is proportional to the Sway Area, whereas the
major axis is proportional to Mean Amplitude. Code lumi-
nance is proportional to F95
AP
(0.75 Hz corresponds to
white, and 1.5 Hz to black). For each age group, inner ellipses
turned out for Eyes Open condition, and outer ellipses for
Eyes Closed. * Young adults' values are taken from Prieto et
al. [22]
SA = 24 mm
2
/s SA = 24 mm
2
/s SA = 24
mm
2
/s
SA = 24 mm
2
/s
MA = 7 mm
F95%
AP
(Hz)
Age Group
Y7 Y9 Y11 Young Adults*
Publish with BioMed Central and every
scientist can read your work free of charge
"BioMed Central will be the most significant development for
disseminating the results of biomedical research in our lifetime."
Sir Paul Nurse, Cancer Research UK
Your research papers will be:
available free of charge to the entire biomedical community
peer reviewed and published immediately upon acceptance
cited in PubMed and archived on PubMed Central
yours — you keep the copyright
Submit your manuscript here:
/>BioMedcentral
Journal of NeuroEngineering and Rehabilitation 2005, 2:29 />Page 11 of 11
(page number not for citation purposes)
10. Ribot-Ciscar E, Trefouret S, Aimonetti JM, Attarian S, Pouget J, Roll
JP: Is muscle spindle proprioceptive function spared in mus-
cular dystrophies? A muscle tendon vibration study. Muscle
Nerve 2004, 29(6):861-866.
11. Barrett R, Hyde SA, Scott OM, Dubowitz V: Changes in center of
gravity in boys with Duchenne muscular dystrophy. Muscle
Nerve 1988, 11(11):1157-1163.
12. Williams H, Fisher J, Tritschler K: Descriptive analysis of static
postural control in 4, 6 and 8 year old normal and motori-
cally awkward children. American Journal of Physical Medicine 1983,
62(1):12-26.
13. Poblano A, Ishiwara K, de Lourdes Arias M, Garcia-Pedroza F, Marin
H, Trujillo M: Motor control alteration in posturography in
learning-disabled children. Arch Med Res 2002, 33(5):485-488.
14. Kohen-Raz R, Volkmar FR, Cohen DJ: Postural control in children
with autism. J Autism Dev Disord 1992, 22(3):419-432.
15. Molloy CA, Dietrich KN, Bhattacharya A: Postural stability in chil-
dren with autism spectrum disorder. J Autism Dev Disord 2003,
33(6):643-652.
16. Geuze RH: Static balance and developmental coordination
disorder. Hum Mov Sci 2003, 22:527-548.
17. Jucaite A, Fernell E, Forssberg H, Hadders-Algra M: Deficient coor-
dination of associated postural adjustments during a lifting
task in children with neurodevelopmental disorders. Dev Med
Child Neurol 2003, 45(11):731-742.
18. Moe-Nilssen R, Helbostad JL, Talcott JB, Toennessen FE: Balance
and gait in children with dyslexia. Exp Brain Res 2003,
150(2):237-244.
19. Ferdjallah M, Harris GF, Wertsch JJ: Instantaneous postural sta-
bility characterization using time-frequency analysis. Gait
Posture 1999, 10:129-134.
20. Fawcett AJ, Nicolson RI: Automatisation deficits in balance for
dyslexic children. Percept Mot Skills 1992, 75(2):507-529.
21. Forssberg H, Nashner LM: Ontogenetic development of pos-
tural control in man: Adaptation to altered support and vis-
ual conditions during stance. J Neurosci 1982, 2:545-552.
22. Prieto TE, Myklebust JB, Hoffmann RG, Lovett EG, Myklebust BM:
Measures of postural steadiness: differences between
healthy young and elderly adults. IEEE Trans Biomed Eng 1996,
45:956-965.
23. Laughton CA, Slavin M, Katdare K, Nolan L, Bean JF, Kerrigan DC,
Phillips E, Lipsitz LA, Collins JJ: Aging, muscle activity, and bal-
ance control: physiologic changes associated with balance
impairment. Gait Posture 2003, 18(2):101-108.
24. Foudriat BA, Di Fabio RP, Anderson JH: Sensory organization of
balance responses in children 3–6 years of age: a normative
study with diagnostic implications. Int J Pediatr Otorhinolaryngol
1993, 27(3):255-271.
25. Carroll JP, Freedman W: Nonstationary properties of postural
sway. J Biomech 1993, 26(4–5):409-416.
26. Hennington G, Johnson J, Penrose J, Barr K, McMulkin ML, Vander
Linden DW: Effect of bench height on sit-to-stand in children
without disabilities and children with cerebral palsy. Arch Phys
Med Rehabil 2004, 85(1):70-76.
27. Carpenter MG, Frank JS, Winter DA, Peysar GW: Sampling dura-
tion effects on centre of pressure summary measures. Gait
Posture 2001, 13(1):35-40.
28. Shumway-Cook A, Woollacott MH: The growth of stability: pos-
tural control from a development perspective. J Mot Behav
1985, 17(2):131-147.
29. Usui N, Maekawa K, Hirasawa Y: Development of the upright
postural sway of children. Dev Med Child Neurol 1995, 37:985-996.
30. Kirshenbaum N, Riach CL, Starkes JL: Non-linear development of
postural control and strategy use in young children: a longi-
tudinal study. Exp Brain Res 2001, 140:420-431.
31. Riach CL, Starkes JL: Stability limits of quiet standing postural
control in children and adults. Gait Posture 1993, 1:105-111.
32. Sundermier L, Woollacott M, Roncesvalles N, Jensen J: The devel-
opment of balance control in children: comparisons of EMG
and kinetic variables and chronological and developmental
groupings. Exp Brain Res 2001, 136:340-350.
33. Chiari L, Rocchi L, Cappello A: Stabilometric parameters are
affected by anthropometry and foot placement. Clin Biomech
2002, 17:666-677.
34. Peterka RJ, Black FO: Age-related changes in human posture
control: motor coordination tests. J Vestib Res 1990, 1(1):87-96.
35. Denckla MB: Revised Neurological Examination for Subtle
Signs. Psychopharmacol Bull 1985, 21(4):773-800.
36. Conforto S, D'Alessio T: Real time monitoring of muscular
fatigue from dynamic surface myoelectric signals using a
complex covariance approach. Med Eng Phys 1999,
21(4):225-234.
37. Schmid M, Conforto S, Camomilla V, Cappozzo A, D'Alessio T: The
sensitivity of posturographic parameters to acquisition
settings. Med Eng Phys 2002, 24:623-631.
38. Lee DN, Lishman JR: Visual proprioceptive control of stance. J
Hum Mov Stud 1975, 1:87-95.
39. Giacomini PG, Alessandrini M, Evangelista M, Napolitano B, Lanciani
R, Camaioni D: Impaired postural control in patients affected
by tension-type headache. Eur J Pain 2004, 8:579-583.
40. Hay L, Redon C: Feedforward versus feedback control in chil-
dren and adults subjected to a postural disturbance. Exp Brain
Res 1999, 125:153-162.
41. Baumberger B, Isableau B, Fluckiger M: The visual control of sta-
bility in children and adults: postural readjustments in a
ground optical flow. Exp Brain Res 2004, 159:33-46.