báo cáo hóa học: " Pairing virtual reality with dynamic posturography serves to differentiate between patients experiencing visual vertigo" ppt
Bạn đang xem bản rút gọn của tài liệu. Xem và tải ngay bản đầy đủ của tài liệu tại đây (313.92 KB, 7 trang )
BioMed Central
Page 1 of 7
(page number not for citation purposes)
Journal of NeuroEngineering and
Rehabilitation
Open Access
Research
Pairing virtual reality with dynamic posturography serves to
differentiate between patients experiencing visual vertigo
Emily A Keshner*
1,2,5
, Jefferson Streepey
1
, Yasin Dhaher
1,2,4
and
Timothy Hain
3
Address:
1
Sensory Motor Performance Program, Rehabilitation Institute of Chicago, Room 1406, 345 East Superior St., Chicago, IL 60611 USA,
2
Department of Physical Medicine and Rehabilitation, Feinberg School of Medicine, Northwestern University, 345 East Superior St., Chicago, IL
60611 USA,
3
Department of Physical Therapy and Human Movement Science, Feinberg School of Medicine, Northwestern University, 645 N.
Michigan Ave., Chicago, IL 60611 USA,
4
Biomedical Engineering Department, Northwestern University, 2145 Sheridan Road, Evanston, IL 60208-
3107 USA and
5
Dept. of Physical Therapy, College of Health Professions, Temple University, Jones Hall 600, 3307 Broad St., Philadelphia PA
19140 USA
Email: Emily A Keshner* - ; Jefferson Streepey - ; Yasin Dhaher - ;
Timothy Hain -
* Corresponding author
Abstract
Background: To determine if increased visual dependence can be quantified through its impact
on automatic postural responses, we have measured the combined effect on the latencies and
magnitudes of postural response kinematics of transient optic flow in the pitch plane with platform
rotations and translations.
Methods: Six healthy (29–31 yrs) and 4 visually sensitive (27–57 yrs) subjects stood on a platform
rotated (6 deg of dorsiflexion at 30 deg/sec) or translated (5 cm at 5 deg/sec) for 200 msec. Subjects
either had eyes closed or viewed an immersive, stereo, wide field of view virtual environment
(scene) moved in upward pitch for a 200 msec period for three 30 sec trials at 5 velocities. RMS
values and peak velocities of head, trunk, and head with respect to trunk were calculated. EMG
responses of 6 trunk and lower limb muscles were collected and latencies and magnitudes of
responses determined.
Results: No effect of visual velocity was observed in EMG response latencies and magnitudes.
Healthy subjects exhibited significant effects (p < 0.05) of visual field velocity on peak angular
velocities of the head. Head and trunk velocities and RMS values of visually sensitive subjects were
significantly larger than healthy subjects (p < 0.05), but their responses were not modulated by
visual field velocity. When examined individually, patients with no history of vestibular disorder
demonstrated exceedingly large head velocities; patients with a history of vestibular disorder
exhibited head velocities that fell within the bandwidth of healthy subjects.
Conclusion: Differentiation of postural kinematics in visually sensitive subjects when exposed to
the combined perturbations suggests that virtual reality technology could be useful for differential
diagnosis and specifically designed interventions for individuals whose chief complaint is sensitivity
to visual motion.
Published: 9 July 2007
Journal of NeuroEngineering and Rehabilitation 2007, 4:24 doi:10.1186/1743-0003-4-24
Received: 12 January 2007
Accepted: 9 July 2007
This article is available from: />© 2007 Keshner et al; licensee BioMed Central Ltd.
This is an Open Access article distributed under the terms of the Creative Commons Attribution License ( />),
which permits unrestricted use, distribution, and reproduction in any medium, provided the original work is properly cited.
Journal of NeuroEngineering and Rehabilitation 2007, 4:24 />Page 2 of 7
(page number not for citation purposes)
Background
Visual vertigo is defined as dizziness provoked by visual
environments with full field of view repetitive or moving
visual patterns [1]. For example, patients with visual ver-
tigo report discomfort in supermarkets and when viewing
crowds and traffic. Visual vertigo is present in many
patients with a history of a peripheral vestibular disorder.
There is also a subset of patients who have no history of
vestibular disorder and who test negative for vestibular
deficit on traditional clinical tests, but who still report
severe reactions to visual motion. In fact, dizziness and
vertigo, dizziness, and unsteadiness are frequently
encountered symptoms in ENT, neurology, and general
practice [2].
It has been suggested that patients with visual vertigo ben-
efit from exercises involving visuo-vestibular conflict [3]
which assumes that their visual sensitivity emerges from
an inability to adapt to a conflict between visual and ves-
tibular inputs. If this were the case, we would expect these
individuals to demonstrate impaired postural control as
well. Increased visual dependence has been demonstrated
to produce an altered postural sway during quiet stance
when placed in a disorienting visual environment [4],
however, visual inputs are not considered to be responsi-
ble for the generation of healthy automatic postural reac-
tions [5,6]. Thus, we hypothesized that increased visual
sensitivity would emerge as changes in the angular veloc-
ity of the automatic postural reactions that linearly
reflected changes in the angular velocity of the visuospa-
tial environment.
Methods
Subjects
Six healthy young adult (29–31 yrs) subjects (HS) and
four subjects (VS) diagnosed as having visual vertigo (27–
57 yrs) participated in these experiments. Healthy subjects
were free from musculoskeletal and neurological disor-
ders. All subjects responded to the Situational Character-
istics Questionnaire and the Dizziness Handicap
Inventory. Subjects provided written consent in accord-
ance with the Institutional Review Board, Feinberg School
of Medicine, Northwestern University. One VS subject
(VS1) developed profound sensitivity to visual stimuli
with no known etiology. ENG and MRI of the brain were
normal as was her general neurological examination
except for extremely poor smooth visual pursuit. VS2
experienced dizziness when standing up, performing
rapid head movements, walking in a dark room, and in
busy sensory environments after being treated with an
intravenous antibiotic in 2003. General neurological
examination, ENG testing, and rotatory chair testing was
normal. The dynamic illegible 'E' test [7] in which subjects
attempt to read a Snellen chart while their head is rotated
in yaw was reduced by 4 lines. Both VS3 and VS4 had
migraine associated vertigo and developed visual sensitiv-
ity 2 years post onset of BPPV. In response to the question-
naires, all VS subjects report being bothered by elevator
and motor vehicle travel, and by complex visual environ-
ments such as grocery stores.
Procedures
Subjects stood barefoot with feet in parallel and shoulder-
width apart on a platform (Neurocom, Inc.) that was dor-
siflexion rotated 6 deg at 30 deg/sec for 200 ms and held
in that position for 800 ms. Additionally, 9 catch trials of
anterior translation (5 cm at 5 deg/sec for 1 sec) of the
platform were randomly inserted into the experimental
period. The platform was placed within a single-wall vir-
tual reality system. The screen in our system consisted of
back projection material measuring 2.6 m × 3.2 m. An
Electrohome Marquis 8500 projector throws a full-color
stereo workstation field (1024 × 768 stereo) at 120 Hz
onto the screen that fills the horizontal and vertical field
of view. A dual processor PC with a nVidia Quadro
[FX3000G] graphics card created the imagery projected
onto the wall using the CAVELib (VRCO, Inc) VR library.
The field sequential stereo images generated by the PC
were separated into right and left eye images using liquid
crystal stereo shutter glasses worn by the subject (Crystal
Eyes, StereoGraphics Inc.) which limit the horizontal and
vertical field of view to 100° and 55° of binocular vision.
The projected image (scene) consisted of a 30.5 m wide by
6.1 m high by 30.5 m deep room containing round col-
umns with patterned rugs and a painted ceiling. [See
Additional File 1 to view a movie of a subject standing on
the platform in front of the virtual environment and wear-
ing the shutter glasses].
Subjects either closed their eyes (DARK) or viewed the vis-
ual scene as it rotated upward in pitch at 5 velocities: 0
(NV), 30, 45, 60, and 90 deg/sec for a period of 200 ms.
After a 10 sec period of quiet stance, the platform and vis-
ual scene simultaneously pitched upward. The catch trials
were also performed with four of these visual conditions
(DARK, NV, 30, and 60 deg/sec). In the NV (natural
vision) condition, the correct scene perspective was con-
tinuously updated by motion capture markers placed on
the shutter glasses to provide feedback about position of
the head in space with a total display system delay of 25
ms. Three 30 sec trials were presented for each visual con-
dition with platform and visual stimulus motion begin-
ning after 10 sec of quiet stance.
Data Analysis
Three-dimensional kinematic data was collected from
reflective markers at 120 Hz using a six-camera Motion
Analysis system (Motion Analysis, Inc.) and low-pass fil-
tered at 4 Hz using a 4
th
order Butterworth digital filter.
Peak angular displacement was derived using commercial
Journal of NeuroEngineering and Rehabilitation 2007, 4:24 />Page 3 of 7
(page number not for citation purposes)
software (Kintrak, Motion Analysis, Inc). Root mean
square values were calculated over a 250 ms period (auto-
matic reactions) following onset of platform motion, and
over a 1000 ms (recovery) period for the head in space
(from the marker placed above the left temple on the back
of the head), trunk in space (from the marker on T1 and a
virtual marker consisting of the average location of the
right and left hip markers), and the head with respect to
trunk. These data were averaged across the 3 trials of each
visual condition. Statistical comparisons were performed
within subjects and across scene velocities with the Wil-
coxon matched pairs test. HS and VS subjects were com-
pared with the Wilcoxon signed ranks test.
Electromyographic (EMG) responses were recorded for
the left soleus (SOL), tibialis anterior (TA), vastus media-
lis (VM), biceps femoris (BF), erector spinae (ES), and
abdominal (ABD) muscles with pairs of active parallel bar
electrodes (Delsys, Inc.). Raw EMG data were filtered
through identical analog low-pass filters (8-pole, Bessel)
with a 500 Hz cutoff frequency prior to analog to digital
conversion. Rectification and low pass filtering was done
digitally. EMG data were examined for individual trials to
determine the latency of the first peak of the EMG
response, defined as the first peak rising 3 standard devia-
tions above resting level activity, following onset of plat-
form motion. EMG response latencies were not affected
by the different visual velocities, thus they were averaged
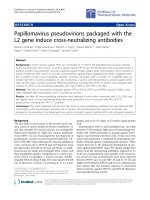
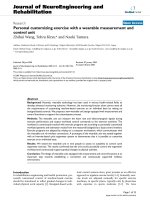
(Left). Average peak angular velocity of the head in space in the first 250 ms following stimulus onset at each velocity of the scene for the HS (grey) and the VS (red) subjectsFigure 1
(Left). Average peak angular velocity of the head in space in the first 250 ms following stimulus onset at each velocity of the
scene for the HS (grey) and the VS (red) subjects. Starred values are significantly less than other scene velocities (p < 0.05).
(Right) Average peak angular velocity of the trunk in space across the 1000 ms period of the trial at each velocity of the scene
for the HS (grey) and the VS (red) subjects. Starred values are significantly less than VS subjects (p < 0.05).
Table 1: Mean ± SD EMG Onset Latency (ms) Across All Scene Conditions
HS VS1, 3, 4 VS2
SOL 31 ± 24 33 ± 15 87 ± 16
TA 41 ± 27 42 ± 26 137 ± 11
BF 20 ± 4 35 ± 3 108 ± 18
VM 18 ± 7 23 ± 3 236 ± 76
ES 19 ± 4 28 ± 10 220 ± 35
ABD 19 ± 3 40 ± 23 164 ± 67
Journal of NeuroEngineering and Rehabilitation 2007, 4:24 />Page 4 of 7
(page number not for citation purposes)
across visual velocities (Table 1). Area under the curve of
each EMG signal was calculated for 6 periods following
onset of the response: 20–50 ms, 40–100 ms, 80–120 ms,
120–220 ms, 240–340 ms, and 350–700 ms.
We also described 3-dimensional motion of head with
respect to trunk during the 9 anterior translations of the
platform. To do this, we used a joint coordinate system
representation [8]. The first rotation was flexion-extension
(pitch) through an angle
θ
f/e
about the head medial-lateral
axis (y-axis) followed by rotation (yaw) through an angle
θ
int/ext
about the superior/inferior axis of the trunk (z-axis).
The last rotation was the lateral bending (roll)
θ
b
which
takes place about the floating axis obtained as a result of
the cross product of the two axes of rotation.
Results
EMG response latencies and magnitudes
There was no significant effect of visual velocity on latency
of the muscle EMG responses. All of the imposed pertur-
bations (i.e., dorsiflexion rotations of the platform, ante-
rior translations of the platform, and upward pitch
rotations of the visual scene) were expected to generate an
initial posterior sway response. In the healthy subjects, the
earliest muscle responses occurred in the trunk and hip
muscles (Table 1) suggesting that they were exhibiting a
hip strategy response [9] for stabilization. VS1, VS3, and
VS4 exhibited their earliest responses in the trunk and
thigh. VS2 exhibited longer latencies of EMG onset than
the other subjects (Table 1). In the HS, EMG response
magnitudes increased in SOL, BF, ES, and ABD in the
recovery portion of the response (350–1000 ms after the
platform rotation). There was a trend of increasing magni-
tude with increasing visual velocity although this was not
significant. VS1 demonstrated a similar pattern with
increased ABD activity throughout the trial. VS2 exhibited
the greatest response magnitude in BF when the visual
scene was moved in pitch.
Head and trunk kinematics
The most dramatic effect in VS subjects was RMS values of
the head in space that were significantly larger across the
period of the trial than in HS for all but the DARK condi-
tion (p < 0.05). Both HS and VS subjects had significantly
smaller head velocities during NV than with all other
scene velocities (p < 0.05) in the first 250 ms of the trial
(Fig. 1). But only HS subjects were able to maintain this
significantly smaller head velocity when the scene velocity
was equal to platform velocity. Trunk in space also exhib-
ited significantly greater RMS values in VS than HS in the
first 250 ms of the trial as well as higher velocities across
the trial period (p < 0.005) (Fig. 1).
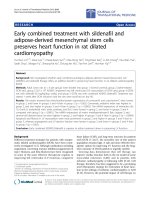
Examination of the raw data of the head in space immedi-
ately following the platform and visual scene disturbances
(Fig. 2) reveals that HS produced a small extensor motion
of the head (mean latency = 98 ± 27 ms) which was unaf-
fected by the presence of, or change in velocity of the vis-
ual scene. This response was followed by head flexion in
HS (mean latency = 359 ± 44 ms) and a gradual return to
initial head position.
VS1 and VS2 also produced the initial extensor motion
(Fig. 2), but with longer latencies (135 ± 35 ms and 171 ±
37 ms, respectively). The next peak of flexor motion
emerged with a considerably greater magnitude in the vis-
ually sensitive than in the healthy subjects (Fig. 2). VS1,
who reported visual sensitivity but had no clinical vestib-
ular signs, produced steep flexor responses of the head
(average latency of 263 ± 72 ms) which would be expected
if this individual were counteracting the upward velocities
Angular excursion of the head in space for 2 sec before and 2 sec after onset of the platform and scene motionFigure 2
Angular excursion of the head in space for 2 sec before and 2
sec after onset of the platform and scene motion. Dashed
vertical lines indicate the 200 msec period between onset
and termination of the platform and visual scene distur-
bances. The first trial of each visual velocity is plotted for one
healthy subject (black line), VS1 (blue line), and VS2 (red
line).
Journal of NeuroEngineering and Rehabilitation 2007, 4:24 />Page 5 of 7
(page number not for citation purposes)
of the optic flow field. The latencies exhibited by VS1 are
very consistent with the reported 180–200 ms latencies
for visual reaction times [10] with additional time to com-
pensate for the delays required for force production in the
system [11]. The magnitude of these responses increased
with increasing visual velocity. The flexion responses of
the head in VS2, who exhibited subtle clinical signs of a
vestibular deficit, were also large and were often followed
by a steep extension response previously seen in the unsta-
ble head behavior of patients with bilateral labyrinthine
deficit [12]. The two subjects that had been previously
diagnosed with BPPV (VS3 and VS4) exhibited head kine-
matics similar to HS.
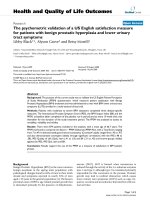
When the peak velocity of the head and trunk were exam-
ined relative to scene velocity there was a slight difference
in the gain of the head response between the two groups
in the first 250 ms following scene onset that was mostly
due to the responses of VS1 (Fig. 3). But, except for VS1
and VS2 at 30/sec, VS subjects exhibited a response gain
plateau in the trunk across scene velocities unlike HS sub-
jects that exhibited decreasing trunk gains with increasing
Gain of head (left) and trunk in space (right) angular velocity with respect to scene velocity in the first 250 ms following stimu-lus onsetFigure 3
Gain of head (left) and trunk in space (right) angular velocity with respect to scene velocity in the first 250 ms following stimu-
lus onset. Each HS is represented by a different symbol. VS1 is the blue square, VS2 is the red circle, VS3 is the green diamond,
and VS4 is the brown triangle.
Journal of NeuroEngineering and Rehabilitation 2007, 4:24 />Page 6 of 7
(page number not for citation purposes)
scene velocity. In the next 250 ms, there was a distinct sep-
aration from all of the other subjects in the response gains
of the head for VS1 and VS2. Five of the six HS exhibited
response gains between 0.5 and 1 with a downward trend
as scene velocity increased. VS3 and VS4 exhibited the
same response pattern within the same response band-
width. VS1 and VS2, however, exhibited head with respect
to scene velocity response gains that were greater than one
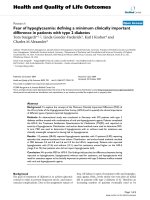
for scene velocities up to 60°/sec. Peak to peak velocities
of the head relative to the trunk across the period of the
trial further differentiated between the VS subjects (Fig. 4).
VS1 and VS2 exhibited much larger motions of the head
with respect to the trunk than did the healthy subjects.
The 2 subjects with a history of vestibular disorder, how-
ever, exhibited peak velocities of head with respect to
trunk that were similar to (VS4), or smaller (VS3) than,
the HS.
Out of plane motions of the head
During platform translations, out of plane motions of the
head were not apparent in the dark. But RMS values of out
of plane motion increased significantly (p < 0.04) in VS
subjects when averaged across the conditions where the
visual scene was visible (Fig. 5).
Discussion
Changes in velocity of the optic flow field had no signifi-
cant effect on EMG responses in the lower limb and trunk.
This was not true of the kinematic responses of the head
which clearly differed between subjects as visual scene
velocity increased. If responses of the head in space were
consistent across all scene velocities, then we could
assume we were observing responses to the mechanical
perturbation of the platform. HS, however, were able to
minimize motion of the head in space with a scene reflect-
ing natural vision and with the scene that moved at the
same velocity as the physical disturbance, but not when
scene the scene was dark or when scene velocity was
greater than feedback from the physical disturbance.
Mean ± SD of the RMS values across 1 sec of head excursions in the pitch (grey), yaw (blue), and roll (green) planes for healthy (HS) and visually sensitive (VS) subjectsFigure 5
Mean ± SD of the RMS values across 1 sec of head excursions in the pitch (grey), yaw (blue), and roll (green) planes for healthy
(HS) and visually sensitive (VS) subjects.
Peak velocity of the head with respect to trunk across the 1000 ms period of the trial at each scene velocity is shown for the mean ± SD across all healthy subjects (black bar), VS1 (blue bar), VS2 (red bar), VS3 (green bar), and VS4 (brown bar)Figure 4
Peak velocity of the head with respect to trunk across the
1000 ms period of the trial at each scene velocity is shown
for the mean ± SD across all healthy subjects (black bar), VS1
(blue bar), VS2 (red bar), VS3 (green bar), and VS4 (brown
bar).
Publish with BioMed Central and every
scientist can read your work free of charge
"BioMed Central will be the most significant development for
disseminating the results of biomedical research in our lifetime."
Sir Paul Nurse, Cancer Research UK
Your research papers will be:
available free of charge to the entire biomedical community
peer reviewed and published immediately upon acceptance
cited in PubMed and archived on PubMed Central
yours — you keep the copyright
Submit your manuscript here:
/>BioMedcentral
Journal of NeuroEngineering and Rehabilitation 2007, 4:24 />Page 7 of 7
(page number not for citation purposes)
Head and trunk angular velocities of the VS subjects oscil-
lated longer and were generally larger than the HS in all
planes of motion and at all scene velocities indicating a
marginally stable system. Different response latencies and
direction of head motion across VS subjects implies that
each subject was relying on a different control mecha-
nism. The striking motion of the head in space in the same
direction as the optic flow field, and the large short
latency response gains in VS1, even when the platform
moved at the same velocity as the visual scene, suggest
that this subject was unable to integrate the visual and
motion feedback. Large response gains of the head that
continued across the first 500 ms period of the trial in VS2
suggest that this individual was particularly sensitive to
the initial acceleration of the visual stimulus. VS2 also
exhibited much longer EMG response latencies and sus-
tained large magnitudes of head with respect to trunk
motion when the scene was dark. These results are remi-
niscent of vestibular deficient individuals who have
delayed EMG responses and reduce trunk motion to
maintain postural stability, but are unable to stabilize the
head in space [11,12]. Clinical testing of this individual
did suggest a subtle labyrinthine deficit due to gentamicin
toxicity. VS3 and VS4 locked their head to their trunk to
reduce head velocity in space from which we infer that
they were relying on proprioceptive inputs to stabilize the
head, perhaps as a result of learning to adapt to unreliable
vestibular inputs when they were diagnosed with BPPV.
Conclusion
Although each of the patients studied here complained of
dizziness and postural disturbances when exposed to busy
visual environments, there were disparate effects of com-
bining visual and base of support disturbances on the sta-
bilizing responses of their head and trunk. We believe that
these results support the use of virtual reality technology
for differential diagnosis and specifically designed inter-
ventions for individuals whose chief complaint is sensitiv-
ity to visual motion.
Competing interests
The author(s) declare that they have no competing inter-
ests.
Authors' contributions
EAK designed the study, analyzed and interpreted the data
and wrote the paper. JS conducted the experiment and
made a substantial contribution to data reduction and
analysis. YD developed the model and was involved in
interpretation of that data. TCH recruited VS patients and
performed the physical examinations. All authors read
and approved the final manuscript.
Additional material
Acknowledgements
We thank VRCO, Inc. for supplying the CAVE library software. This work
was supported by National Institute of Health grants DC05235 from the
NIDCD and AG16359 from the NIA.
References
1. Bronstein AM: The visual vertigo syndrome. Acta Otolaryngol
Suppl 1995, 520 Pt 1:45-48.
2. Yardley L, Owen N, Nazareth I, Luxon L: Prevalence and presen-
tation of dizziness in a general practice community sample
of working age people. Br J Gen Pract 1998, 48(429):1131-1135.
3. Bronstein AM: Visual vertigo syndrome: clinical and posturog-
raphy findings. J Neurol Neurosurg Psychiatry 1995, 59(5):472-476.
4. Guerraz M, Yardley L, Bertholon P, Pollak L, Rudge P, Gresty MA,
Bronstein AM: Visual vertigo: symptom assessment, spatial
orientation and postural control. Brain 2001, 124(Pt
8):1646-1656.
5. Nashner L, Berthoz A: Visual contribution to rapid motor
responses during postural control. Brain Res 1978,
150(2):403-407.
6. Peterka RJ, Benolken MS: Role of somatosensory and vestibular
cues in attenuating visually induced human postural sway.
Exp Brain Res 1995, 105(1):101-110.
7. Longridge NS, Mallinson AI: The dynamic illegible E-test. A tech-
nique for assessing the vestibulo-ocular reflex. Acta Otolaryngol
1987, 103(3-4):273-279.
8. Grood ES, Suntay WJ: A joint coordinate system for the clinical
description of three-dimensional motions: application to the
knee. J Biomech Eng 1983, 105(2):136-144.
9. Horak FB, Nashner LM: Central programming of postural
movements: adaptation to altered support-surface configu-
rations. J Neurophysiol 1986, 55(6):1369-1381.
10. Talkowski ME, Redfern MS, Jennings JR, Furman JM: Cognitive
requirements for vestibular and ocular motor processing in
healthy adults and patients with unilateral vestibular lesions.
J Cogn Neurosci 2005, 17(9):1432-1441.
11. Keshner EA, Allum JH, Pfaltz CR: Postural coactivation and adap-
tation in the sway stabilizing responses of normals and
patients with bilateral vestibular deficit. Exp Brain Res 1987,
69(1):77-92.
12. Keshner EA: Head-trunk coordination during linear anterior-
posterior translations. J Neurophysiol 2003, 89(4):1891-1901.
Additional file 1
Click here for file
[ />0003-4-24-S1.avi]