báo cáo hóa học: " A pilot study on pupillary and cardiovascular changes induced by stereoscopic video movies" pptx
Bạn đang xem bản rút gọn của tài liệu. Xem và tải ngay bản đầy đủ của tài liệu tại đây (411.4 KB, 7 trang )
BioMed Central
Page 1 of 7
(page number not for citation purposes)
Journal of NeuroEngineering and
Rehabilitation
Open Access
Research
A pilot study on pupillary and cardiovascular changes induced by
stereoscopic video movies
Hiroshi Oyamada
1
, Atsuhiko Iijima
1
, Akira Tanaka
2
, Kazuhiko Ukai
3
,
Haruo Toda
1
, Norihiro Sugita
4
, Makoto Yoshizawa
4
and Takehiko Bando*
1
Address:
1
Division of Integrated Physiology, Niigata University Graduate School for Medical and Dental Sciences, Asahi-machi1, Niigata, 951-
8510, Japan,
2
Department of Human Support System, Faculty of Symbiotic Systems Science, Fukushima University, Fukushima, Japan,
3
Department of Applied Physics, Waseda University, Tokyo, Japan and
4
Research Division on Advanced Information Technology, Information
Synergy Center, Tohoku University, Sendai, Japan
Email: Hiroshi Oyamada - ; Atsuhiko Iijima - ; Akira Tanaka -
u.ac.jp; Kazuhiko Ukai - ; Haruo Toda - ; Norihiro Sugita - ;
Makoto Yoshizawa - ; Takehiko Bando* -
* Corresponding author
Abstract
Background: Taking advantage of developed image technology, it is expected that image
presentation would be utilized to promote health in the field of medical care and public health. To
accumulate knowledge on biomedical effects induced by image presentation, an essential
prerequisite for these purposes, studies on autonomic responses in more than one physiological
system would be necessary. In this study, changes in parameters of the pupillary light reflex and
cardiovascular reflex evoked by motion pictures were examined, which would be utilized to
evaluate the effects of images, and to avoid side effects.
Methods: Three stereoscopic video movies with different properties were field-sequentially rear-
projected through two LCD projectors on an 80-inch screen. Seven healthy young subjects
watched movies in a dark room. Pupillary parameters were measured before and after presentation
of movies by an infrared pupillometer. ECG and radial blood pressure were continuously
monitored. The maximum cross-correlation coefficient between heart rate and blood pressure,
ρ
max
, was used as an index to evaluate changes in the cardiovascular reflex.
Results: Parameters of pupillary and cardiovascular reflexes changed differently after subjects
watched three different video movies. Amplitudes of the pupillary light reflex, CR, increased when
subjects watched two CG movies (movies A and D), while they did not change after watching a
movie with the real scenery (movie R). The ρ
max
was significantly larger after presentation of the
movie D. Scores of the questionnaire for subjective evaluation of physical condition increased after
presentation of all movies, but their relationship with changes in CR and ρ
max
was different in three
movies. Possible causes of these biomedical differences are discussed.
Conclusion: The autonomic responses were effective to monitor biomedical effects induced by
image presentation. Further accumulation of data on multiple autonomic functions would
contribute to develop the tools which evaluate the effects of image presentation to select applicable
procedures and to avoid side effects in the medical care and rehabilitation.
Published: 4 October 2007
Journal of NeuroEngineering and Rehabilitation 2007, 4:37 doi:10.1186/1743-0003-4-37
Received: 1 June 2006
Accepted: 4 October 2007
This article is available from: />© 2007 Oyamada et al; licensee BioMed Central Ltd.
This is an Open Access article distributed under the terms of the Creative Commons Attribution License ( />),
which permits unrestricted use, distribution, and reproduction in any medium, provided the original work is properly cited.
Journal of NeuroEngineering and Rehabilitation 2007, 4:37 />Page 2 of 7
(page number not for citation purposes)
Introduction
Taking advantage of recent developments in the image
technology, new trials of efforts to promote health by uti-
lizing images are expected. Images may be applied to the
medical care, or may be used as the tools to monitor the
effects of the care. One of the prerequisite of these trials is
the understanding of biomedical influences evoked by
visual stimulation. The biomedical influences evoked by
presentation of images have been studied in efforts to pre-
vent biomedical hazards such as asthenopia and other
symptoms of the VDT syndrome evoked by using video
displays in the business offices [1-6]. Results of these stud-
ies indicated that autonomic responses, including cardio-
vascular and ocular responses, would provide valuable
information.
In this study, changes in the pupillary light reflex and car-
diovascular reflex evoked by watching three different ster-
eoscopic video movies were measured in healthy young
subjects, and related with the subjective assessment of dis-
comfort measured as scores of the questionnaire collected
at the same time. It is shown that biomedical effects
evoked by presentation of video movies were different
depending on the properties of video movies. Possible
causes of these differences are discussed. Accumulation of
the knowledge may provide the efficient tool to select
proper images applicable to the cases, and to evaluate
properly the effects of treatments in the field of medical
care and rehabilitation. Such estimation is also necessary
to avoid the side effect or aggravation due to improper
stimuli. Some of the preliminary data were reported in the
abstract form [7].
Methods
Subjects
Subjects were seven (five male and two female) medical
students (23.0 ± 0.9 years). The procedures and general
purpose of the experiments were explained to subjects,
but no information on the expected results was given. The
Bioethics Committee of the Niigata University School of
Medicine approved the experiments in this study, and all
subjects gave the informed consents to participate in the
study.
Presentation of motion pictures
Three stereoscopic movies of 5-min-long were used as the
test stimuli. The digital signals of the movies were fed to a
liquid-crystalline display, and total brightness of a frame
in the movie was monitored by a photocell on the screen,
which was positioned in front of the display. The binocu-
lar disparity was roughly evaluated by the MATLAB soft-
ware (MathWorks, Inc), in which the separation of the
central objects in even and odd frames of the movie was
calculated.
Among three movies, two were made of computer graph-
ics (CG), and the other was the real scenery taken by a
camera in a car of the roller coaster (R), which gave strong
vection sensation in all subjects, probably because the
quick changes in the apparent velocities of objects in the
scenery would invoke the past experiences of subjects.
One of the CG movies was an imaginary work, in which
various objects were moving violently without a consist-
ent story through the movie (movie A). The other CG
movie dealt with an imaginary ancient world in which
many kinds of dinosaurs approached the subjects with the
progression of the story, and finally the subject was
attacked by a tyrannosaurus (movie D).
Other properties of the movies were as follows. Firstly,
brightness in two CG (A and D) movies was changed fre-
quently. Their mean brightness was in the same range, but
switching in the brightness was much frequent in the
movie D. The movie R had stable and high brightness.
Secondly, the degree of binocular disparity is larger in two
CG movies (largest in the movie D) than in the movie R.
Thirdly movies D and R had a kind of story, which pro-
ceeded from the beginning to the end, while blocks of
frames were not temporally continuous in the movie A.
Subjects watched three different video images in a ran-
dom order in a day. Before the presentation of each video
movie, five minutes of rest were allowed for each subject,
which were necessary to prepare the stable condition of
subjects, and to collect stable cardiovascular data as the
control. Just after presentation of the movie, measure-
ment of pupillary parameters was quickly performed.
Then, five minutes of the rest were again allowed to collect
cardiovascular data. The same subjects repeated the exper-
iments within two weeks at the corresponding time zone
in each day to avoid the influence of the circadian rhythm
of pupillary parameters [8].
Stereoscopic movies in digital video cassettes were con-
sisted with the sequential frames of odd and even fields,
which provided images to the left and right eyes with the
binocular disparity necessary for stereoscopic vision. They
were replayed by a video cassette recorder (WV-D10000,
Sony Co.), fed to a signal distributor, and then were rear-
projected by two aligned liquid-crystalline display (LCD)
projectors (TH-L795J, Matsushita Elec. Co., XGA, total of
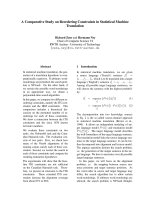
1400 lm) onto an 80-inch screen (Fig. 1). By an electronic
distributor, even and odd fields of the images were allot-
ted to each of the two LCD projectors. Each of two projec-
tors had a polarizing filter, orthogonal to each other.
Subjects sat in a chair at 2 m from the screen, wearing
polarizing-glasses and watching motion pictures in the
80-inch screen, with the comfortable posture in the dark
room (illuminance, 10 l× at the floor of the room just in
front of the screen). The size of the images in the screen
Journal of NeuroEngineering and Rehabilitation 2007, 4:37 />Page 3 of 7
(page number not for citation purposes)
was 120 cm (length) × 160 cm (width). The visual angle
was vertically 17 deg, and horizontally 22 deg, because the
distance between the subject and the screen was 2 m.
Measurement of pupil diameter
Pupil diameters were measured by an infrared pupillom-
eter (Iriscorder C7364, Hamamatsu Photonics Co.), in
which a charge-coupled device (CCD) camera took the
image of a pupil with a sampling rate of 1/60 sec. This
camera had an effective field of 30 mm × 22.5 mm. The
field was illuminated by a light-emitting diode (LED)
with a peak wavelength of 890 nm. Another LED in the
pupillometer (peak wavelength, 660 nm; maximum
intensity, 10 μW) was lit for 1 sec to induce the pupillary
light reflex. Measurements of the pupil were performed in
the dark room (illuminance, 10 lx). In the control, the
parameters of the pupil were measured after the rest of 5
min in the dark room. After presentation of movies, they
were measured just after presentation in the dark room.
Then the difference in the brightness of video movies
might contribute to the differences in the pupillary
parameters, but it was not the case in this study (see Dis-
cussion, changes in pupillary parameters). Data were col-
lected by an interface (PCI-MIO-16XE-10, National
Instruments Co.) by the aid of the LabVIEW (National
Instruments Co.) and stored in a hard disk. Original data
were also stored in a digital tape by using a data-recorder
(RD135T, TEAC Co.).
A polynomial curve was fitted to the rising or falling time
course of the pupillary light responses. The maximal
velocity and acceleration of pupillary constriction, and the
maximal velocity of re-dilation of the pupil in the light
reflex were calculated by the first- and second-order differ-
entiation of the fitted curve.
Amplitudes of the pupillary light reflex are dependent on
the pupil diameter before light stimulation (baseline
pupil diameter, D1). We then adopted the constriction
ratio [9], CR, to balance the differences in D1 as follows:
CR = (D1–D2)/D1, where D2 was the diameter of the
pupil at the peak of the light reflex. The CR
ratio
was defined
as (CRaf/CRbf), to evaluate the changes in CR before
(CRbf) and after (CRaf) presentation of movies.
Measurement of blood pressure and ECG
ECG (electrocardiogram) (Nihon-Koden Co.) and radial
blood pressure (JENTOW770, Colin Japan Co.) were con-
tinuously collected by a data-collection system at a sam-
pling rate of 1 kHz with 12 bit resolution. Data in the rest
time before and after video presentation (5 min each),
and those during video presentation (5 min) were ana-
lyzed. Heart rate (min
-1
) was calculated from the recipro-
cal of the inter-R-wave interval of the ECG signal. Mean
blood pressure (mmHg) was obtained as the mean value
of the pressure signal over one heartbeat. Beat-to-beat
mean pressure and heart rate were interpolated by a cubic
spline function and were re-sampled every 0.469 sec to
yield corresponding beat-to-beat data, denoted by BP and
HR, respectively. The data is filtered through a band-pass
filter with the bandwidth between 0.08 Hz and 0.12 Hz to
extract Mayer wave components. At time t, Hanning win-
dow whose interval is [t-60, t+60] in second is used to seg-
ment BP and HR into 2 min-long data. After this
processing, the normalized cross-correlation function
ρ(τ) between BP and HR is calculated. The ρ
max
was
defined as the maximum cross-correlation coefficient ρ(τ)
for the positive τ [10,11]. The ρ
max
would be 1, if changes
in the heart rate depend completely on changes in blood
pressure. But it is ordinarily lower than 1, because the
heart rate depends also on the biological noises embed-
ded in the baroreflex loop. When noises are increased, for
example, by emotional inputs, ρ
max
is lowered. The ρ
max
would be also lowered, if the vascular resistance changes
without the corresponding change in pulse rate. On the
other hand, increased ρ
max
would be induced by the
reduction of biological noises. The contribution of noises
may be lowered by the stimuli that drive cardiac reactions
to prepare movements of the body.
Data analysis
Subjects evaluated their physical conditions during the
rest before and after presentation of movies by filling out
The ρ
max
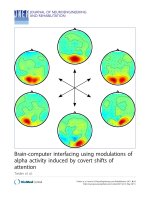
of a subject obtained in the consecutive three days (day 1, day 2 and day 3) during video presentation of the movie D is shown respectivelyFigure 1
The ρ
max
of a subject obtained in the consecutive three days
(day 1, day 2 and day 3) during video presentation of the
movie D is shown respectively. The mean and SE of ρ
max
obtained in the rest before and after presentation of the
movies ρ
max_control
are also shown (control, n = 6).
Journal of NeuroEngineering and Rehabilitation 2007, 4:37 />Page 4 of 7
(page number not for citation purposes)
a questionnaire with 10 items on a seven-point rating
scale [12].
We used the paired t-test (two tailed) to compare means.
Pearson's correlation coefficient was used to assess the
relationship between two parameters. We used the SPSS
software (release 10.07J, SPSS, Inc.) for statistical analy-
ses.
Results
The scores of the questionnaire (the last column in Table
1) increased significantly after the subjects watched any of
three video movies (p < 0.02, for movie D, and p < 0.05,
for movie A and R, paired t-test), indicating that they felt
some discomforts by watching 3D movies or possibly by
restriction of body movement with various equipments in
the experiment.
Pupillary parameters
Seven subjects watched three different video movies in a
random order in a day, and the test was repeated two
times within two weeks. Then total of 21 trials for each of
three movies was performed. The changes in data
obtained in the day1, day2 and day3 were not different
each other (ANOVA, LSD and Bonferroni), and therefore,
data in these 21 trials were pooled. The baseline pupil
diameters (D1) were measured just before the onset of
light stimulus which induced the pupillary light reflex.
The D1_video, which was obtained after presentation of
video movies, was significantly smaller than the
D1_control, which obtained before presentation in all of
three movies (Table 1). In addition, values of the
D1_video for any of three video movies were not signifi-
cantly different each other. The pupil diameters at the
peak of the light reflex (D2) were also significantly smaller
after presentation of movies.
The constriction ratio of the light reflex, CR, was signifi-
cantly larger after presentation of the movies D (p < 0.01,
paired t-test) and A (p < 0.05) than the control obtained
before presentation (the control) (Table 1), while after
presentation of the movie R the CR was not significantly
different from the control (p > 0.05). Other parameters of
the pupillary light reflex, i.e., the latency of the constric-
tion, the velocity of constriction (vc), the velocity of re-
dilation (vd), the acceleration of constriction (ac), and the
time at the peak of constriction (peak time) were not sig-
nificantly different before and after presentation of mov-
ies A, D and R.
Cardiovascular reflex
Heart rate and blood pressure were continuously moni-
tored. The ρ
max
was calculated for 2 min. Then the data
window was shifted by 10 seconds, and the ρ
max
was again
calculated. In this way, 18 points of the ρ
max
were
obtained between 60 and 230 seconds following the onset
of the movie. In Fig. 1, the values of the ρ
max
measured
when a subject watched movie D in the first, second and
third days are plotted against the time after the onset of
the movie.
To evaluate the changes in the ρ
max
, the ρ
max_ratio
was
defined. Firstly the ρ
max
at each of the 18 points along the
time following the onset of a movie was calculated
(ρ
max_test
). Secondly the values of ρ
max
at the correspond-
ing points in the rest before and after presentation were
averaged (ρ
max
_
control
). The standardized ρ
max
is defined as
the ρ
max_test
/ρ
max_control
at each of 18 points. Thirdly the
mean of the standardized ρ
max
for 18 points gave the
ρ
max_ratio
. In Table 2, the mean ρ
max_control
, the mean
ρ
max_test
as well as the ρ
max_ratio
are shown. The mean
ρ
max_test
was significantly larger than the mean ρ
max_control
when the subject watched the movie D (p < 0.05, paired t-
test), while the mean values of the ρ
max_test
were not signif-
icantly different after presentation of movies A and R (p >
0.05).
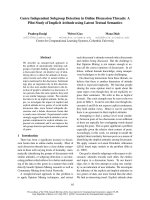
Correlation between objective and subjective indices
The CR
ratio
obtained after the subject watched movie D or
R was correlated significantly with the difference in the
scores of questionnaire (p < 0.01) (Table 3, Pearson's coef-
ficient of correlation, n = 21, and Fig. 2B–C), while after
presentation of the movie A, they were not correlated sig-
nificantly (p > 0.05) (Fig. 2A). Increased discomfort after
presentation of movies is indicated as the positive values
Table 1: The pupil parameters and the scores of questionnaire obtained before (control) and after presentation of movies A, D and R
D1 [mm] D2 [mm] CR latency [msec] vc [mm/sec] vd [mm/sec] ac [mm/sec2] peak time [sec] score of
questionnaire
Control 6.62 ± 0.89 5.25 ± 1.03 0.21 ± 0.07 303 ± 29 3.99 ± 1.29 1.14 ± 0.36 32.1 ± 11.3 1.10 ± 0.24 32.4 ± 10.2
movie A 5.95 ± 0.98** 4.48 ± 1.06** 0.25 ± 0.09* 304 ± 28 4.33 ± 1.27 1.14 ± 0.42 34.8 ± 12.7 1.10 ± 0.27 36.1 ± 10.3*
movie D 6.08 ± 0.92** 4.54 ± 0.93** 0.26 ± 0.08** 300 ± 32 4.35 ± 1.11 1.16 ± 0.48 32.3 ± 9.6 1.10 ± 0.20 38.0 ± 14.1**
movie R 6.15 ± 0.86** 4.77 ± 0.92** 0.23 ± 00.8 306 ± 33 4.02 ± 1.37 1.10 ± 0.43 32.2 ± 11.5 1.06 ± 0.18 36.7 ± 11.3*
mean ± SD. D1: baseline pupil diameter just before light stimulation to induce the light reflex (mm), D2: pupil diameter at the peak of the light reflex (mm), CR: the amplitude
of the pupillary light reflex (D1–D2) divided by D1, latency: the latency of the pupillary light reflex (msec), vc: the velocity of constriction (mm/sec), vd: the velocity of re-
dilation (mm/sec), ac: the acceleration of the constriction (mm/sec
2
), peak time: time at the peak of the pupillary light reflex (sec), and the scores of the questionnaire. *, p <
0.05, **, p < 0.01. Paired t-test (two-tailed).
Journal of NeuroEngineering and Rehabilitation 2007, 4:37 />Page 5 of 7
(page number not for citation purposes)
of the differences in scores of the subjective evaluation in
Fig. 2.
The correlation of the ρ
max_ratio
with the difference in the
scores of questionnaire was not significant when the sub-
jects watched any of three movies (p > 0.05) (Fig. 2D–F,
and Table 4). In addition, the CR
ratio
was not correlated
with the ρ
max_ratio
(p > 0.05) (Table 5).
Discussion
Changes in pupillary parameters
The diameter of the pupil is controlled both by sympa-
thetic and parasympathetic activities [13]. Pupil is con-
stricted by increased contraction of the pupillary
constrictor muscle, which is innervated by parasympa-
thetic short ciliary and oculomotor nerves, and/or by
decreased tension of the pupillary dilator muscles, inner-
vated by sympathetic nerves. The parasympathetic oculo-
motor neurons are in the dorso-rostral oculomotor
nucleus in the midbrain. Sympathetic innervation is orig-
inated from the cervical and superior thoracic segments of
the spinal cord. Changes in pupillary size may reflect the
balance of sympathetic and parasympathetic tones, and
are the good measure of the sustained state of the auto-
nomic function. On the other hand, the pupillary light
reflex is controlled through the arc through the retinal
ganglion cells, the pretectum, and the parasympathetic
oculomotor neurons. Changes in parameters of the pupil-
lary light reflex depend probably on the activation levels
of the brain stem structures related to this reflex arc.
In point of view of the sustained autonomic function, it is
suggested that parasympathetic tone prevailed over sym-
pathetic tone after presentation of any of three movies,
because baseline pupillary sizes were decreased (Table 1).
The miotic condition may be caused by the relaxed condi-
tion of the subject after the end of the task, by the fatigue
or by the drowsiness in the dark room, although no sub-
ject reported sleepiness in the experiment. On the other
hand, CR, which is the change in the amplitude of the
light reflex, was different, depending on the movies. The
CR increased significantly after presentation of two CG
movies, and the change was not significant after presenta-
tion of the movie R (Tables 1). Because changes in base-
line pupil diameters were not significantly different
among three movies, the differences in CR were not
dependent on the mean brightness of movies, and other
causes should be sought. By comparing properties of three
movies (Material and Methods, presentation of motion
pictures), changes in the CR might be induced by accumu-
lation of the activities in the brain stem possibly due to
the unnatural changes in the disparity and/or brightness,
which could facilitate the transmission of the visual sig-
nals to the intraocular sphincter muscles.
Changes in the cardiovascular reflex
Cardiovascular measures, such as spectral analyses of the
R-R interval in the cardiac rhythm [14-16], have been typ-
ical tools to evaluate the autonomic nervous function.
However, in these traditional methods, only slight body
movement was allowed. By newly developed index, the
ρ
max
, stable measurement of parameters of the cardiovas-
cular reflex is possible when the subjects watch movies
with less severe restriction of body movement.
The ρ
max
was increased significantly after presentation of
the movie D. In movie D, subjects were met various dino-
saurs one after another and were attacked by some of
them, which drove cardiac reactions to escape from them.
Such reactions could increase the contribution of the
baroreflex over biological noises (see Materials and Meth-
ods, measurement of blood pressure and ECG), which
might increase ρ
max
.
Correlation among the pupillary, cardiovascular and
subjective indices
In order to relate the subjective and objective evaluation
of biomedical effects induced by presentation of images,
changes in the CR and ρ
max
were related with the differ-
ences in the scores of questionnaire. Differences in the
subjective evaluation correlated significantly with changes
in CR after presentation of movies D and R, but in other
combinations the correlation was not significant (p >
0.05).
The different relation to the subjective evaluation of the
pupillary light reflex and the baroreflex would suggest that
different factors contributed to the biomedical influences
caused by image presentation. Although further studies
with larger number of subjects are necessary, it is sug-
Table 3: Correlation coefficient (Pearson) between CR
ratio
and
differences in the scores of questionnaire
correlation coefficient level of significance
movie A 0.059 0.799
movie D -0.567** 0.007
movie R -0.590** 0.005
**, p < 0.01. In the second column, the levels of significance are
shown.
Table 2: Mean values of ρ
max_control
, ρ
max_test
, and ρ
max_ratio
are
shown for each video movie (movie A, D and R)
ρ
max_control
ρ
max_test
ρ
max_ratio
Movie A 0.65 ± 0.10 0.66 ± 0.13 1.03± 0.06
Movie D 0.66 ± 0.12 0.70 ± 0.08* 1.11± 0.05
Movie R 0.66 ± 0.09 0.69 ± 0.12 1.08± 0.07
mean ± SD. *, p < 0.05. Paired t-test.
Journal of NeuroEngineering and Rehabilitation 2007, 4:37 />Page 6 of 7
(page number not for citation purposes)
gested that biomedical influences should be evaluated by
multiple physical parameters, which are carefully selected.
Significance of the present study
Pupillary and cardiovascular parameters as well as subjec-
tive evaluation were changed after image presentation,
and the effects were different depending on the types of
images. The results may be utilized to detect subtle
changes in physical parameters to assess the effect of med-
ical care [17,18]. Images can also be used as the tool for
the treatment, for example, of the patients with panic dis-
order [19]. Images should be carefully selected, however,
and the biomedical effects must be carefully monitored to
avoid side effects or aggravation. Rehabilitation of posture
and movement of paralyzed patients may be facilitated in
virtual environment which would promote their motiva-
tion, but some patients may complain of cybersickness
due to the virtual motion scenery. Tools to monitor bio-
Table 5: Correlation coefficient (Pearson) between ρ
max_ratio
and
CR
ratio
. In the second column, the levels of significance are
shown
correlation coefficient level of significance
movie A 0.07 0.77
movie D 0.11 0.65
movie R 0.21 0.37
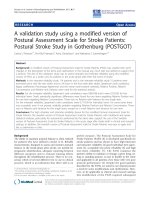
Correlation of pupil and cardiovascular parameters with the scores of questionnaireFigure 2
Correlation of pupil and cardiovascular parameters with the scores of questionnaire. A-C. Correlation of CR
ratio
with the dif-
ferences in the scores of questionnaire when subjects watched the movies A, D and R, respectively, are shown. D-F. Correla-
tion of ρ
max_ratio
with the differences in the scores of questionnaire when subjects watched the movies A, D and R, respectively,
are shown.
Table 4: Correlation coefficient (Pearson) between ρ
max_ratio
and
differences in the scores of questionnaire. In the second column,
the levels of significance are shown
correlation coefficient level of significance
movie A 032 0.161
movie D 0.16 0.491
movie R -0.42 0.059
Publish with BioMed Central and every
scientist can read your work free of charge
"BioMed Central will be the most significant development for
disseminating the results of biomedical research in our lifetime."
Sir Paul Nurse, Cancer Research UK
Your research papers will be:
available free of charge to the entire biomedical community
peer reviewed and published immediately upon acceptance
cited in PubMed and archived on PubMed Central
yours — you keep the copyright
Submit your manuscript here:
/>BioMedcentral
Journal of NeuroEngineering and Rehabilitation 2007, 4:37 />Page 7 of 7
(page number not for citation purposes)
medical influences are also needed, which are provided by
monitoring parameters such as shown in the present
study.
Although many questions remained to be clarified, this
study is an important step to accumulate knowledge on
biomedical effects evoked by audiovisual stimulation. By
accumulation of such knowledge, the efficient tools
would be developed to select proper images applicable to
the medical care and rehabilitation, and to monitor unde-
sirable effect of images to avoid side effect.
Acknowledgements
This work was partly supported by the Mechanical Social Systems Founda-
tion, Japan Electronics and Information Technology Industries Association,
Japan KEIRIN Association, the Ministry of Education, Science and Sports,
and the Ministry of Economy, Trade and Industry. Written consent for pub-
lication was obtained from the subjects. We thank Michiko Kimishima for
valuable help in project managements, and Junko Takahashi in secretarial
assistance.
References
1. Saito M, Tanaka T, Oshima M: Eyestrain in inspection and cleri-
cal workers. Ergonomics 1981, 24:161-173.
2. Gur S, Ron S, Heicklen-Klein A: Objective evaluation of visual
fatigue in VDU workers. Occup Med (Lond) 1994, 44(4):201-204.
3. Saito S, Sotoyama M, Saito S, Taptagaporn S: Physiological indices
of visual fatigue due to VDT operation: pupillary reflexes and
accommodative responses. Ind Health 1994, 32(2):57-66.
4. Hasebe H, Oyamada H, Ukai K, Toda H, Bando T: Changes in ocu-
lomotor functions before and after loading of a 3-D visually-
guided task by using a head-mounted display. Ergonomics 1996,
39:1330-1343.
5. Ukai K, Tsuchiya K, Ishikawa S: Induced pupillary hippus follow-
ing near vision: increased occurrence in visual display unit
workers. Ergonomics 1997, 40:1201-1211.
6. Takagi M, Abe H, Toda H, Usui T: Accommodative and pupillary
responses to sinusoidal target depth movement. Ophthalmic
Physiol Opt 1993, 13(3):253-257.
7. Bando T, Oyamada H, Fukasaku S, Tanaka A, Yoshizawa M, Ukai K:
Changes in autonomic functions and subjective evaluation of
physical conditions by three different types of stereoscopic
video movies. [abstract]. Jpn J Physiol 2002, 52(Suppl):S175.
8. Wilhelm B, Giedke H, Lüdtke H, Bittner E, Hofmann A, Wilhelm H:
Daytime variations in central nervous system activation
measured by a pupillographic sleepiness test. J Sleep Res 2001,
10(1):1-7.
9. Hasegawa S, Ishikawa S: Age changes in pupillary light reflex. A
demonstration by means of a pupillometer. Nippon Ganka
Gakkai Zasshi 1989, 93(10):955-961.
10. Sugita N, Yoshizawa M, Tanaka A, Abe K, Chiba S, Yambe T, Nitta S:
Quantitative evaluation of the effect of visually-induced
motion sickness using causal coherence function between
blood pressure and heart rate. Conf Proc IEEE Eng Med Biol Soc
2004, 4:2047-2410.
11. Yoshizawa M, Sugita N, Tanaka A, Masuda T, Abe K, Chiba S, Yambe
T, Nitta S: Assessment of emotional reaction induced by vis-
ual stimulation based on cross-correlation between pulse
wave transmission time and heart rate in the Mayer wave-
band. Conf Proc IEEE Eng Med Biol Soc 2004, 4:2411-2414.
12. Ando T, Tanaka A, Fukasaku S, Takada R, Okada M, Ukai K, Shizuka
K, Oyamada H, Toda H, Taniyama T, Usui T, Yoshizawa M, Kiryu T,
Takagi M, Saida S, Bando T: Pupillary and cardiovascular
responses to a video movie in senior human subjects. Auton
Neurosci 2002, 97(2):129-135.
13. Brodal A: The light reflex in "Neuronal Anatomy". 3rd edition.
Oxford Univ Press, New York; 1981:561-564.
14. Akselrod S, Gorden D, Madwed JB, Snidman NC, Shannon DC,
Cohen RJ: Hemodynamic regulation: investigation by spectral
analysis. Am J Physiol 1985, 249(4 Pt 2):H867-H875.
15. Montano N, Ruscone TG, Porta A, Lombardi F, Pagani M, Malliani A:
Power spectrum analysis of heart rate variability to assess
the changes in sympathovagal balance during graded ortho-
static tilt. Circulation 1994, 90:1826-1831.
16. Pagani M, Federico L, Stefano G, Ornella R, Raffaello F, Paolo S, Giulia
P, Gabriella M: Power spectral analysis of heart rate and arte-
rial pressure variabilities as a marker of sympatho-vagal
interaction in man and conscious dog. Circulation Res 1986,
59:178-193.
17. Kojima M, Shioiri T, Hosoki T, Kitamura H, Bando T, Someya T:
Pupillary light reflex in panic disorder. A trial using audiovis-
ual stimulation. Eur Arch Psychiatry Clin Neurosci 2004,
254(4):242-244.
18. Shioiri T, Kojima-Maruyama M, Hosoki T, Kitamura H, Tanaka A,
Bando T, Someya T: Dysfunctional baroreflex regulation of
sympathetic nerve activity in remitted patients with panic
disorder. A new methodological approach. Eur Arch Psychiatry
Clin Neurosci 2005, 255(5):293-298.
19. Rothbaum BO, Hodges L, Anderson PL, Price L, Smith S: Twelve-
month follow-up of virtual reality and standard exposure
therapies for the fear of flying. J Consult Clin Psychol 2002,
70(2):428-432.