báo cáo hóa học: " Ambulatory monitoring of activity levels of individuals in the sub-acute stage following stroke: a case series" doc
Bạn đang xem bản rút gọn của tài liệu. Xem và tải ngay bản đầy đủ của tài liệu tại đây (426.78 KB, 10 trang )
BioMed Central
Page 1 of 10
(page number not for citation purposes)
Journal of NeuroEngineering and
Rehabilitation
Open Access
Research
Ambulatory monitoring of activity levels of individuals in the
sub-acute stage following stroke: a case series
William H Gage*
1,3,4
, Karl F Zabjek
1,2,3
, Kathryn M Sibley
1,2
, Ada Tang
1,2
,
Dina Brooks
1,2
and William E McIlroy
1,3,5
Address:
1
Toronto Rehabilitation Institute, 550 University Avenue, Toronto, Ontario, M5G 2A2, Canada,
2
Department of Physical Therapy,
Graduate Department of Rehabilitation Science, University of Toronto, 500 University Avenue, Toronto, Ontario, M5G 1V7, Canada,
3
Centre for
Stroke Recovery, Sunnybrook & Women's College Health Sciences Centre, 2075 Bayview Avenue, Toronto, Ontario, M4N 3M5, Canada,
4
School
of Kinesiology and Health Science, York University, 4700 Keele Street, Toronto, Ontario, M3J 1P3, Canada and
5
Department of Kinesiology,
University of Waterloo, 200 University Avenue West, Waterloo, Ontario, N2L 3G1, Canada
Email: William H Gage* - ; Karl F Zabjek - ; Kathryn M Sibley - ;
Ada Tang - ; Dina Brooks - ; William E McIlroy -
* Corresponding author
Abstract
Background: There is an important need to better understand the activities of individual patients
with stroke outside of structured therapy since this activity is likely to have a profound influence
on recovery. A case-study approach was used to examine the activity levels and associated
physiological load of patients with stroke throughout a day.
Methods: Activities and physiologic measures were recorded during a continuous 8 hour period
from 4 individuals in the sub-acute stage following stroke (ranging from 49 to 80 years old; 4 to 8
weeks post-stroke) in an in-patient rehabilitation hospital.
Results: Both heart rate (p = 0.0207) and ventilation rate (p < 0.0001) increased as intensity of
activity increased. Results revealed individual differences in physiological response to daily activities,
and large ranges in physiological response measures during 'moderately' and 'highly' therapeutic
activities.
Conclusion: Activity levels of individuals with stroke during the day were generally low, though
task-related changes in physiologic measures were observed. Large variability in the physiological
response to even the activities deemed to be greatest intensity suggests that inclusion of such
extended measurement of physiologic measures may improve understanding of physiological
profile that could guide elements of the physical therapy prescription.
Introduction
Considerable effort in the rehabilitation process of
patients with stroke is orientated towards addressing sen-
sori-motor dysfunction [1,2] and cognitive deficits [2,3].
Although the majority of patients with stroke have con-
comitant cardiovascular disease, and as such can benefit
from aerobic exercise training, the effects of such exercise
among these patients is only beginning to be considered
in the literature [4,5]. A recent meta-analysis which
included seven randomized controlled trials examining
the efficacy of aerobic exercise training among patients
with stroke reported that there is good evidence to sup-
Published: 26 October 2007
Journal of NeuroEngineering and Rehabilitation 2007, 4:41 doi:10.1186/1743-0003-4-41
Received: 13 December 2006
Accepted: 26 October 2007
This article is available from: />© 2007 Gage et al; licensee BioMed Central Ltd.
This is an Open Access article distributed under the terms of the Creative Commons Attribution License ( />),
which permits unrestricted use, distribution, and reproduction in any medium, provided the original work is properly cited.
Journal of NeuroEngineering and Rehabilitation 2007, 4:41 />Page 2 of 10
(page number not for citation purposes)
port the use of aerobic exercise among patients with mild
and moderate stroke for improving aerobic capacity [6].
Studies that have examined the effects of exercise [7,8] in
sufficient dose and intensity have shown that improve-
ments in cardiovascular fitness among individuals with
stroke can be comparable to that of healthy, age-matched
adults. The benefits of exercise for these individuals
include improved cardiovascular and psychological sta-
tus, and sensorimotor, strength, and endurance measures
[9].
The potential importance of activity programs is height-
ened given the evidence to suggest that individuals with
stroke are generally sedentary. Individuals who have had
a stroke within the past 14 days and who reside in an acute
care hospital spend more than 50% of the day lying in
bed, 28% of the day sitting in bed, and 13% of the day
engaged in functional activities; therapist contact
accounted for only 5.2% of the patient's day [10]. Earlier
work reported that activity levels of individuals with
stroke residing in a hospital stroke ward were low
throughout the day, however the amount of time that had
passed since the stroke was not reported [11]. While this
work provides some general insight into activity patterns
there has been no research to examine daily activity levels
and associated cardiorespiratory responses of patients
with stroke at the sub-acute stage of recovery in a rehabil-
itation setting. Traditional rehabilitation programs that
focus on improving ability to perform daily function are
unlikely to adequately challenge the cardiovascular sys-
tem of individuals with stroke. Patient heart rates have
been shown to reach target ranges considered acceptable
for conditioning programs during therapy; however, the
length of time in the target range is very brief [5,9]. The
brevity of elevated heart rate during therapy, and the low
percentage of the day engaged in the therapy program,
combined, suggest that the cardiovascular challenge pro-
vided to individuals with stroke during a structured reha-
bilitation program is insufficient to maintain, let alone
improve, cardiorespiratory capacity.
Gordon and colleagues [9] suggested, based on previous
work by Palmer-McLean and Harbst, and others, that to
obtain a cardiovascular training effect, individuals with
stroke need to perform cardiovascular exercise at 40% to
70% of heart rate reserve, or 50% to 80% of maximum
heart rate, for 20 to 60 minutes per day, 3 to 7 times per
week, and that exercise may be performed in multiple 10-
minute sessions. Individuals who have had a stroke do
appear to benefit significantly from cardiovascular exer-
cise [7-9], and it is clear that they receive very little, if any,
cardiovascular benefit from activities during therapy [5].
Clearly more research must be conducted to explore the
efficacy and feasibility of cardiovascular exercise after
stroke, with particular attention paid to the type and dose
of exercise [6]. However, the focus must also be directed
to non-therapy related activities since such activities are
likely to be an important determinant of the cardiorespi-
ratory fitness profile of individual survivors of stroke. To
date, there has been little information to indicate the type
and intensity of activities that stroke patients are engaged
in during the day when not in therapy. The activities
engaged in outside of structured therapy sessions would
potentially have a profound influence on the cardiorespi-
ratory status in addition to being an important index of
the changes in functional capacity occurring over the
course of rehabilitation. The challenge of such work is to
be able to assess both activity and the physiologic
responses to be able to judge the potential therapeutic
benefit of specific daily activities.
The objective of this study was to examine activity profiles
and associated cardiorespiratory load of individuals in the
sub-acute stage after stroke throughout a day using an
ambulatory data collection system. We hypothesized that
individual activity levels would not be of sufficient inten-
sity or duration to elicit a cardiorespiratory training effect,
even during structured therapy sessions. In addition, we
addressed the relationship, within specific cases, between
an activity-level classification (rated 0–4) with ambula-
tory recorded measures of physiological response to activ-
ity (heart rate, ventilation rate). We believe that
information related to an individual's physiological
response to specific activity (whether directly therapeutic
or non-therapeutic activity) may be uniquely important
for therapists when designing person-specific structured
and unstructured activity programs for individuals with
stroke.
Methods
Participants
Four individuals, all male and ranging in age between 49
and 80 years, volunteered to participate in this study. The
participants in this study were selected from a parallel
study [12], which examined the feasibility and effects of
an aerobic training program among individuals in the
sub-acute stage of recovery following stroke. Participants
in the current study had recently concluded their involve-
ment in the parallel study. Importantly, these four
patients were selected because they represented a range in
both age and stroke-related residual deficits in function,
allowing a multiple case-study approach to investigating
the use of the ambulatory monitoring device, and the
individual patient's physiological response to various lev-
els of activity. The inclusion and exclusion criteria for this
study were consistent with those of the parallel study.
Each participant was screened based on the following cri-
teria: Chedoke-McMaster Stroke Assessment (CMSA)
Scale Leg Score [13] between 3 and 6, and the cognitive
ability to provide informed consent. The exclusion criteria
Journal of NeuroEngineering and Rehabilitation 2007, 4:41 />Page 3 of 10
(page number not for citation purposes)
included: resting blood pressure greater than 160/100
despite medication, other cardiovascular morbidity which
would limit exercise tolerance, unstable angina, orthos-
tatic blood pressure decrease of > 20 mmHg, hypertrophic
cardiomyopathy, any musculoskeletal impairments
which may limit the individual's ability to cycle on a sta-
tionary, semi-recumbent ergometer, and ongoing pain
which would preclude participation. Person-specific
details are reported in Table 1, including information
regarding medication use and the location of stroke, NIH
Stroke Score, Functional Independence Measure score,
peak VO
2
(VO
2
was required for parallel study; VO
2
testing
methodology is described elsewhere [12]), and the lower
limit of the calculated target heart rate training zone [5].
All participants had experienced a stroke within 2 months
prior to testing and were in-patients at the Toronto Reha-
bilitation Institute at the time of testing. A physician
assessed each participant to confirm his medical status
prior to entering the study. The local research ethics board
approved this study.
Procedures
An instrumented mesh vest (LifeShirt, Vivometrics, Ven-
tura, California, USA) was worn throughout one 8-hour
period, from approximately 8 am to 4 pm. The vest was
designed to record electrocardiogram (ECG) and plethys-
mography signals on a dedicated, handheld personal dig-
ital assistant (PDA) computer, which was attached to the
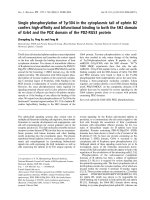
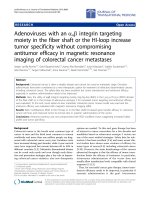
participant's belt or pants. A picture of the LifeShirt is pro-
vided in Figure 1. It should be noted that the LifeShirt is
composed of a lightweight mesh material; the weight of
the device, including the PDA and battery, is reported on
the company's website to be 703 grams. To provide the
appropriate context during the collection period, each
participant was "shadowed" by two research assistants
who were instructed to document any reasonable or nota-
ble change in the individual's posture or activity (for
example, walking, sitting, climbing stairs), a description
of the activity (for example, therapy, reading, watching
television, bathroom), and the time at which the activity
occurred. At the end of the data collection period, the vest
was removed, and the data was transferred from the PDA
to a computer for storage and analysis.
Measures of Interest
The data recorder sampled the ECG signal at 200 Hz and
the plethysmography signal at 50 Hz. Custom software
(Matlab, Mathworks, Massachusetts, USA) was used to
calculate the heart rate (HR) measure from the ECG signal
and to extract ventilation rate (VR) from the plethysmog-
Table 1: Characteristics of the individual participants.
Patient ID S1 S2 S3 S4
Age 49497880
Date of Stroke* 25/04/04 15/07/04 31/01/05 03/01/05
Date of Testing* 28/06/04 23/08/04 23/02/05 15/02/05
Time from stroke to testing (months) ~2 ~1 ~1 ~1.5
Location of stroke Left interior capsule Right pontine lacunar Left cerebellar Left lacunar
Medication(s) Atorvastatin
Perindopril
Losartan HCTZ Plavix
Nifedipine
Diazepam Glycerin
Atorvastatin Heparin
Sodium ASA
Plavix Rampril HCTZ
Cardizem
NIHSS** (adm/disch**) 3/3 5/3 1/1 5/2
CMSA leg score (adm/disch) 6/6 4/5 6/6 3/4
FIM** (adm/disch) 100/115 61/106 74/103 88/107
FIM (locomotion; adm/disch) 6/7 5/5 4/6 2/6
FIM (upper body; adm/disch) 6/7 3/6 5/6 4/6
Resting HR** (day of testing; bpm) 79 71 53 62
Lower limit target HR training zone (bpm) 105 101 77 88
Peak demonstrated HR 113 107 97 110
Peak demonstrated VO
2
(ml/kg/min) 12.8 10.4 15.2 8.9
Amount of time in each activity category (AC) [10]
Activity Categories 0 8% 2% 26% 52%
1 51% 21% 28% 13%
2 No samples; see text for explanation
3 21% 20% 24% 20%
4 20% 57% 22% 15%
* dates are formatted as dd/mm/yyyy
**NIHSS-National Institutes of Health Stroke Score, FIM-Functional Independence Measure, adm/disch-score at admission/score at discharge, HR-
heart rate
Journal of NeuroEngineering and Rehabilitation 2007, 4:41 />Page 4 of 10
(page number not for citation purposes)
raphy signal. The HR and VR data were low-pass filtered at
0.5 Hz, for demonstration purposes, and contrasted with
the documented activity for one representative participant
(Figure 2). All calculations were performed using the raw
HR and VR signals.
To reflect periods of sustained HR elevation throughout
the day, and the American Heart Association's scientific
statement recommendations for exercise [9], we deter-
mined the mean HR across a 10 minute window (HR
10
),
and serially advanced the window by 1-minute incre-
ments to construct a moving-average profile of the HR sig-
nal. We determined the individual's resting HR by finding
the lowest 1-minute average HR during the collection
period; a computer algorithm was used to find the lowest
1-minute average HR, and visual inspection confirmed
this finding. Lower and upper limits of the HR target train-
ing zone were determined using the Karvonen formula [5]
to provide conservative estimates of these limits. The
lower limit of the cardiovascular training zone for each
individual is noted in Table 1. We determined the total
accumulated time that the individual's HR was within the
target training zone, based on the HR
10
.
Previous work used a 0–4 point scale to categorize activity
levels among individuals with stroke throughout the day
(activity category, AC) [10]. The same rating scale was
used in the current study. Based on the activity descrip-
tions recorded throughout the day, each period of differ-
ent activity was assigned an activity level. For example, if
the individual was sitting and resting (AC
0
) for a period of
3 minutes, after which he walked on a treadmill for 11
minutes (AC
4
), it was recorded that the individual per-
formed an AC
0
activity for 3 minutes and an AC
4
activity
for 11 minutes. For each of these two periods, e.g. 3 min-
utes and 11 minutes, average HR and VR values were cal-
culated. To reflect continuous performance of an activity
within a given AC, average HR and VR values were deter-
mined only if the activity was performed for 2 minutes or
longer. Non-parametric methods were used to assess
changes in HR and VR by AC. Kruskal-Wallis tests were
used to assess changes in HR and VR with AC; individual
Wilcoxon tests were used to explore significant differences
between levels of AC.
Results
Feasibility of ambulatory monitoring
All four participants reported that the LifeShirt vest was
comfortable to wear under normal clothing throughout
the day. Only one individual was able to put on the Life-
Shirt independently (participant S1; FIM (dressing upper
body) score at discharge was 7; Table 1); the other three
participants required assistance. Note that electrodes for
ECG monitoring were positioned and adhered by the
experimenter. None of the patients reported that wearing
the device restricted or otherwise impaired their move-
ments. There were no occurrences of system or sensor
problems once the system was fitted to the subject (i.e.
data were collected without disruption for the 8 hour
period).
Heart rate, ventilation rate, and activity profiles: sample
tracings
HR profile data gathered throughout the day indicated
that the overall cardiorespiratory load was low for three of
the four participants (S1, S2, S3) throughout most of the
day. Including the periods of structured therapy, individ-
uals' HRs were on average 16 bpm above their resting lev-
els (range of 12 to 19 bpm above resting). The average HR
for participant S4, including periods of structured therapy
was 29 bpm above resting. However, this individuals peak
demonstrated VO
2
(8.9 mlO
2
/kg/min) was 30% lower
than the average VO
2
of the other three individuals, which
suggests that this individual functioned at a higher per-
centage of his cardiovascular capacity when performing
activities of daily living. There were important activity-
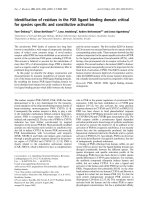
related differences within each participant. To highlight
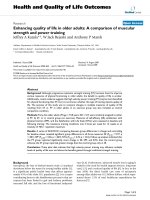
these differences, a sample profile of HR and VR for S1 is
presented in Figure 2, with the synchronized record of the
individual's functional and physical activities. This indi-
vidual's data was chosen because he demonstrated the
most robust heart rate response to his physical therapy
Photograph of the LifeShirt, the data collection system used in this studyFigure 1
Photograph of the LifeShirt, the data collection system used
in this study. ECG and inductive plethysmography bands are
embedded in the garment. Data was stored on a PDA
(shown).
Journal of NeuroEngineering and Rehabilitation 2007, 4:41 />Page 5 of 10
(page number not for citation purposes)
session, which may be a function of his higher FIM score
results (overall score, and locomotion and upper body
subscale scores).
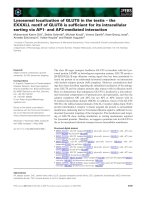
Case 1 (S1)
This individual demonstrated a clear heart rate response
to sessions of physical therapy, but very little change in his
heart rate throughout the remainder of the day. With
exception of the period during which this individual was
engaged in his structured physical therapy session, his
average heart rate throughout the day was 95 bpm, 16
bpm above his resting HR. During physical therapy, his
mean HR increased by 17%, to 111 bpm (Figure 3), and
when considering only the period of time during which
the individual engaged in treadmill walking and stair
climbing his mean heart rate increased by 24%, to 118
bpm. He also demonstrated increases in VR during physi-
cal therapy, particularly during the cone placement and
stair climbing exercises, which appeared to coincide with
increases in HR. However, with the exception of the
period during physical therapy, S1's heart rate varied little,
despite being engaged in activities such as walking and
occupational therapy.
S1; profile of HR during physical therapyFigure 3
S1; profile of HR during physical therapy. The patient demon-
strated clear HR responses to various activities, particularly
when climbing stairs. The patient's resting HR and average
HR throughout the rest of the day are indicated.
Participant S1; profiles of HR and VR activity throughout the dayFigure 2
Participant S1; profiles of HR and VR activity throughout the day. Circled numbers refer to the following activities during the
associated periods throughout the day: 1, sitting, walking, eating breakfast; 2, physiotherapy (upper extremity weights, floor-
level cone placement exercise, treadmill walking, stair climbing); 3, ADLs, walking, prolonged periods of sitting; 4, eating lunch,
speech therapy, walking, prolonged periods of sitting; 5, occupational therapy (hand mobility and strengthening exercises); 6,
ADLs, sitting while talking with other patients. This patient demonstrated a clear HR response during his physical therapy ses-
sion (period expanded in Figure 3).
Journal of NeuroEngineering and Rehabilitation 2007, 4:41 />Page 6 of 10
(page number not for citation purposes)
HR
10
profiles are provided for each participant in Figure 4,
and a description of each individual's activities along with
associated HR responses (or lack of HR response) follows
immediately, below.
Case 2 (S2)
This individual demonstrated an average heart rate
throughout the day of 86 bpm (with the exception of two
periods; during physical therapy and during a self-directed
walking program; see below), an increase of 21% relative
to his resting HR of 71 bpm. However, his HR during his
physical therapy session was 88 bpm, an increase of only
2 bpm compared with his mean HR for the rest of the day,
suggesting that S2 demonstrated no clear HR response to
the physical therapy session. The only time during the day
that this individual's HR increased notably was during a
50 minute period in the afternoon during which the indi-
vidual was engaged in a self-directed walking and stretch-
ing program which was not prescribed by the physical
therapist. His mean HR during this 50 minute period of
self-directed activity was 98 bpm, an increase of 12 bpm,
or 14%, compared with his average HR throughout the
rest of the day (including the period during physical ther-
apy). It should be noted that the patient was not being
monitoring by a therapist during this period, which
occurred three hours after the end of his formal physical
therapy session.
Case 3 (S3)
Similar to S2, and in contrast to S1, S3 demonstrated no
clear HR response to his structured physical therapy ses-
sion. This patient's average HR was 64 bpm during physi-
cal therapy, and 65 bpm throughout the remainder of the
day. S3 demonstrated small increases in HR later in the
testing session (at approximately hours 5 and 6 of test-
ing), and these elevations in HR were of sufficient dura-
tion to possibly effect a cardiovascular training response
(see Heart Rate: 10 minute moving average (HR
10
), below,
and Figure 4). However, these increases in heart rate did
not occur during any therapy session, but, rather, while
walking to the speech therapy session, and when dressing
later in the day. Interestingly, even when S3 reported rest-
ing during a 50 minute period in the morning following
his physical therapy session, his average heart rate was 64
bpm, which is consistent with his average heart rate
throughout the day. The individual was not directly
observed during that time so it is not clear if the individual
was truly 'resting' or was engaged in some nominal activ-
ity which may have elevated his HR (note: the participant
reported that he was intending to lie down on his bed and
rest; as such, privacy was appropriately provided by the
research assistant, explaining why the participant was not
directly observed during this period). These findings sug-
gest that ambulatory monitoring of physiological param-
eters such as HR (as well as monitoring of kinematics)
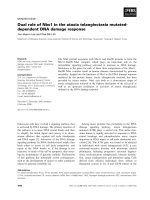
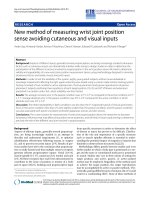
10 minute moving-average HR (HR
10
) plots for each participant; 3 of the 4 participants exceeded the minimum HR threshold to experience a cardiovascular training response associated with activities engaged in at various times throughout the dayFigure 4
10 minute moving-average HR (HR
10
) plots for each participant; 3 of the 4 participants exceeded the minimum HR threshold to
experience a cardiovascular training response associated with activities engaged in at various times throughout the day. Partic-
ipants S1, S3, and S4 demonstrated HR
10
responses that exceeded the minimum threshold for their respective training zones
for totals of: 63, 38, and 253 minutes, respectively. At no point during the day did the HR
10
of S2 reach this minimum threshold.
Journal of NeuroEngineering and Rehabilitation 2007, 4:41 />Page 7 of 10
(page number not for citation purposes)
may lead to more reliable reporting not only of activity
but also of the intensity of activity, when compared with
self-reporting.
Case 4 (S4)
Similar to S1, S4 demonstrated a clear HR response during
physical therapy. During this period, his mean HR was
111 bpm, and increase of 80% relative to his resting HR.
However, as suggested earlier, S4 demonstrated peak VO
2
was 30% lower than that of the other three participants,
which suggests that very little physical activity was
required to substantially challenge this patient's cardio-
vascular system. This suggestion is supported by findings
which indicated a marked increase in heart rate when S4
was engaged in activities such as: standing, brief periods of
walking, and extended periods of sitting while eating
(increase in HR of 52% compared with resting HR); and
engaged in occupational therapy (increase in HR of 47%
compared with resting HR).
Heart rate: 10 minute moving average (HR
10
)
Figure 4 shows the HR
10
profile for each individual. The
heavily shaded sections of each response profile repre-
sents the period during which the individual's HR
10
reached the cardiovascular training zone. The HR
10
meas-
ures for 3 of the 4 participants suggest that these three
individuals exceeded the minimum threshold and may
have, according to the American Heart Association Scien-
tific Statement, experienced a cardiovascular training
response associated with the activities they engaged in at
various times throughout the day. Participants S1, S3, and
S4 demonstrated HR
10
responses that exceeded the mini-
mum threshold for their training zones for totals of: 63,
38, and 253 minutes, respectively. At no point during the
day did the HR
10
of subject S2 reach this minimum thresh-
old. Of each patient's total time in the cardiovascular
training zone, 83%, 0%, and 32% of this time was associ-
ated with a structured physical therapy session for partici-
pants S1, S3, and S4, respectively. The large amount of
time spent by S4 in the cardiovascular training zone asso-
ciated with activities such as sitting and eating, may be
explained by this individual's very low cardiovascular fit-
ness. The relatively small amount of time spent by S3 in
the cardiovascular training zone might be related to his
lower levels of disability as indicated by his NIHSS and
FIM measures (Table 1), in addition to his relatively
higher peak VO
2
. In addition, it appears that S3 was not
sufficiently challenged during his physical therapy ses-
sion, relative to his own cardiovascular fitness level.
Heart rate (HR) and ventilation rate (VR): relationship to
activity level
HR and VR were compared with activity level (AC) to
explore the potential relationship between the observa-
tional measure of activity level and physiological chal-
lenge, or load. Though individual differences were
observed, overall, the Kruskal-Wallis (non-parametric,
one-way ANOVA) test revealed that both HR (p = 0.0207)
and VR (p < 0.0001) generally increased as AC increased
(Figure 5). Post-hoc analysis revealed that there were no
differences for both HR (p = 0.1858) and VR (p = 0.5225)
between the two lowest activity levels (AC
0
, AC
1
). Also, for
HR there was no difference between AC
1
and AC
3
(p =
0.8874). HR for AC
4
was significantly greater than for AC
0
(p = 0.0105) and AC
3
(p = 0.0396), but the difference
between AC
1
and AC
4
did not reach statistical significance
(p = 0.094). VR was significantly greater for AC
3
than for
AC
0
(p = 0.0018) and AC
1
(p = 0.0186), and VR for AC
4
was significantly greater than for AC
3
(p = 0.0107). In the
scale used by Bernhardt et al [10], activities in AC
2
included 'sit supported out of bed' and 'transfer (with
hoist)'. All of the participants in the current study were
able to sit independently and did not require assistance
with transfers. As a result, AC
2
contained no samples (Fig-
ure 5, Table 1).
Discussion
The purpose of this study was to: 1) examine the physical
activity levels and associated cardiorespiratory responses
of individuals with stroke during normal daily activities
which included their structured physical therapy sessions,
and 2) examine the relationship between a previously
reported activity level classification with measured physi-
ological responses to daily activity (heart rate, ventilation
rate). We used a commercially available wearable ambu-
latory physiological monitoring system. This study linked
measured physiologic change with specific daily activities
including activities associated with structured rehabilita-
tion sessions, as well as the activities and times when the
individuals were not in therapy.
Importantly, the findings of this study provide direct
physiologic evidence to support the suggestion that indi-
viduals with stroke are generally inactive throughout the
day, which is consistent with observational reports in the
literature [10,11]. Little information regarding the activity
patterns of individuals with stroke throughout the day is
available. Though Bernhardt et al. [10] demonstrated that
individuals in the acute phase of recovery following stroke
are generally inactive according to a subjective scale rating
the therapeutic level of various activities from 0 (inactive)
to 4 (highly therapeutic), the findings of the current study
suggest that, among individuals in the subacute stage of
recovery, even activities included in the categories of high-
est therapeutic relevance (e.g. walking) may not load the
cardiorespiratory system sufficiently to elicit a training
effect. Although both HR and VR generally increased with
the subjectively rated AC, large individual differences in
these relationships, as well as large ranges in the measures
of HR and VR within each AC, for each individual. These
Journal of NeuroEngineering and Rehabilitation 2007, 4:41 />Page 8 of 10
(page number not for citation purposes)
findings suggest that physiological load cannot be
assessed directly from AC. For example, S1 and S4 demon-
strated marked differences in mean HR and VR across the
AC levels (Figure 5). S2 demonstrated similar differences
across AC levels 1, 3, and 4, though both HR and VR were
greater for AC
0
than for AC1. S2 spent only 2% of the test-
ing session in the AC
0
category (see Table 1), and this
period may have been marked by an elevated HR and VR
for reasons other than physical activity (i.e. anxiety or
other stress). S3 demonstrated no apparent change in HR
or VR across the AC categories. In addition to individual
differences in the physiological response to activity across
the individuals, each patient demonstrated large ranges in
the measures of HR and VR within each AC, particularly
for AC
3
and AC
4
. For S1, HR ranged between 91 and 102
bpm during AC
3
activities, and between 90 and 130 dur-
ing AC
4
activities. For S2, HR ranged between 74 and 95
bpm during AC
3
activities, and between 81 and 101 bpm
during AC
4
activities. The other two participants demon-
strated similar HR responses. The average HR range during
AC
3
activities across the four individuals was 18 bpm; dur-
ing AC
4
activities, the average HR range was 32 bpm. Fur-
thermore, S1 demonstrated HR responses adequate to
elicit a physiological training effect (i.e. HR greater than
the minimum threshold for a training effect according to
the American Heart Association scientific statement) for
less than 50% of the time this individual spent in AC
4
'highly therapeutic' activities. During AC
3
'moderately
therapeutic' activities, this same individual's HR did not
enter the training zone at all. Clearly, an observational
measure of activity level does not adequately describe the
physiological load, or potential benefit, of individual
activities, and addition of physiological parameters such
as HR or VR are needed to assess the physiological load of
activity for individuals. Ambulatory monitoring of physi-
ological load during activity provides the capacity to
assess the aerobic challenge associated with activity and
adjust the intensity of activity on a person-to-person basis.
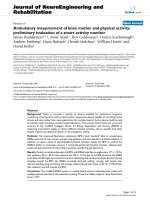
Mean (± 1 standard deviation) HR (left axis) and VR (right axis) for each participantFigure 5
Mean (± 1 standard deviation) HR (left axis) and VR (right axis) for each participant. Statistical analysis was conducted using the
data of the group as a whole. Though individual differences were observed, overall, the Kruskal-Wallis non-parametric analysis
of variance revealed that both HR (black square; p = 0.0207) and VR (black circle; p < 0.0001) generally increased as AC
increased HR and VR increased. For participant S2, the standard deviations for both HR and VR in AC
0
are small and therefore
the SD bars do not extend beyond the size of the symbol used in the figure. For all participants, there were no differences for
both HR (p = 0.1858) and VR (p = 0.5225) between the two lowest activity levels (AC
0
, AC
1
). For HR there was no difference
between AC
1
and AC
3
(p = 0.8874). HR for AC
4
was significantly greater than for AC
0
(p = 0.0105) and AC
3
(p = 0.0396); there
was no statistical difference (p = 0.094) between AC
1
and AC
4
. VR was significantly greater for AC
3
than for AC
0
(p = 0.0018)
and AC
1
(p = 0.0186), and VR for AC
4
was significantly greater than for AC
3
(p = 0.0107).
Journal of NeuroEngineering and Rehabilitation 2007, 4:41 />Page 9 of 10
(page number not for citation purposes)
While previous work has inferred the therapeutic rele-
vance of physical activity based on the expert opinion of
experienced clinicians, the current study has added direct
physiological measurement of the physiological load the
activity to the understanding of the (potential) health
benefits associated with the activity. This additional infor-
mation available through the use of the physiologic mon-
itoring has provided three important insights. First, and
consistent with work by MacKay-Lyons and Makrides [5],
the physiological load experienced by individuals during
structured therapy sessions may not be sufficient to elicit
a cardiovascular benefit or training effect. Second, tremen-
dous individual differences exist in the individual's phys-
iological response to physical activity during therapy and
throughout the day. Third, even during activities which
are deemed by expert opinion to be highly therapeutic,
large ranges in measures of physiological response (i.e.
heart rate, ventilation rate) suggest that these activities do
not necessarily provide a cardiovascular training effect.
These insights confirm that it is imperative that ambula-
tory physiological measurement systems (i.e. wearable
heart rate monitors) be used during physical therapy ses-
sions not only to ensure the safety of the patient, but also
(and likely more commonly) to ensure that the patient is
engaged with sufficient intensity to challenge the cardio-
vascular system to the point of training effect. Further-
more, the findings of the current study underscore the
need to better understand the nature of the physical activ-
ities engaged in by individuals throughout the day, such
as the type of activity, the duration that specific activities
are performed, and the intensity of the activity in terms of
the cardiorespiratory response. Ambulatory physiological
monitoring of individuals with stroke throughout the day
may provide a method of influencing individual activity
profiles on a day-to-day basis and eventually via a method
of real-time monitoring and prompting.
Activities engaged in by the individuals throughout the
day were categorized according to a previously established
method using observation techniques to infer therapeutic
value of physiologic loads associated with activity [10].
The results suggested that the four participants in the cur-
rent study were engaged in activity that was deemed non-
therapeutic for, on average, slightly more than 50% (range
of 23 to 65%) of the day, which is consistent with the
report of Bernhardt and colleagues [10]. The individuals
in the previous study spent 28% of the day engaged in
minimally therapeutic activities (i.e. sitting supported out
of bed). The individuals in the current study did not per-
form any activities that were considered to be in the min-
imally therapeutic category. Therefore, it seems that the
individuals in the current study had a greater volume and
extent of activity in categories of higher therapeutic rele-
vance due, in part, to their higher functional capacity. For
example, they were all capable of sitting unsupported, and
therefore spent a larger percentage of the day, according to
this scale, engaged in moderately and highly therapeutic
activity (50% of the day, versus 12.8% in the previous
study). The previous work by Bernhardt [10] examined
individuals with stroke at an early stage of recovery while
the current study explored activity profiles of in-patients
who were later in their stage of recovery (four to eight
weeks after stroke). It is unlikely that individuals able to
ambulate independently (with aids), such as those who
participated in the current study, would find sitting
unsupported substantially challenging from a sensorimo-
tor perspective or in terms of cardiovascular load, and
therefore the recovery time differences may explain the
increase in activities which, according to this scale, would
be considered therapeutically-relevant if using the activity
scale. These findings suggest that development of an alter-
nate activity level scale designed specifically for individu-
als at later stages of recovery following stroke might be
useful and more discriminative in assessing the physiolog-
ical challenge of various daily activities.
A limitation of this study was sample size; a research
assistant was required to spend 8 to 9 hours observing
each participant, limiting the feasible number of partici-
pants, and limiting data collections to a single day. There-
fore, the sample of participants included individuals who
varied greatly in age and neurologic impairment, in order
to explore in a case-study approach the level of activity
among patients with stroke, and the relationship between
activity level classification and continuously sampled
physiological response. The development of movement
assessment capability (e.g. accelerometers) and validation
of the discriminative capacity of such measurements (to
distinguish movement profiles) is essential to improve the
practical application of this approach to remove time and
cost constraints imposed by the necessity of a research
assistant to manually document participant activities all
day long. Such remote measurement of movement, as
opposed to relying on observation, would also help to
counter limitations associated with privacy and observa-
tion. In addition, it is possible that the participants may
have altered their normal daily activities, or altered the
level of effort provided during various tasks as a result of
being observed throughout the day. It should be noted,
however, that one might have anticipated an increase in
relative activity under such a scenario and in the case of
the present individuals they were characterized by rela-
tively low levels of daily activity.
This study confirms and extends the results of previous
research providing a detailed view of the activity patterns
of individual patients with stroke and the associated phys-
iological response throughout the day. First, the activity
level of individuals with stroke during structured therapy
sessions may not be of sufficient physiological challenge
Publish with BioMed Central and every
scientist can read your work free of charge
"BioMed Central will be the most significant development for
disseminating the results of biomedical research in our lifetime."
Sir Paul Nurse, Cancer Research UK
Your research papers will be:
available free of charge to the entire biomedical community
peer reviewed and published immediately upon acceptance
cited in PubMed and archived on PubMed Central
yours — you keep the copyright
Submit your manuscript here:
/>BioMedcentral
Journal of NeuroEngineering and Rehabilitation 2007, 4:41 />Page 10 of 10
(page number not for citation purposes)
to elicit a cardiovascular training effect. Second, they
appear to be relatively inactive throughout the day, and
simple observation of their physical activity may not
assess the therapeutic relevance of the activity. Third, we
have associated a measure of physiological challenge with
the individual's activities of daily living. Future research
will examine methods of influencing the activity level of
individuals with stroke in the rehabilitation hospital and
community. Incumbent in that research will be the devel-
opment of technology which will associate kinematic
measurements with physiologic data. Such developments
will facilitate inclusion of a larger sample size by autono-
mously providing a context of activity to the physiologic
measure, reducing the cost of data gathering and enhanc-
ing feasibility. Data acquisition systems built on emerging
sensor technologies will provide the understanding of the
individual's activity necessary for meaningful interpreta-
tion of the physiologic response to activity throughout the
day (and night). Information related to activity obtained
at times outside of structured therapy sessions may serve
to provide important insight regarding the individual's
status not otherwise available to the therapist. In addition,
these developments will allow precise measurement of
function and intensity of activity in the community, pro-
moting evidence-based therapeutic practice following dis-
charge from the daily therapy program or rehabilitation
hospital.
Competing interests
None of the authors have a conflict of interest related to
the publication of this manuscript. While Vivometrics
donated the use of the LifeShirt system, Vivometrics had
no input to the design of the research, the collection of
data, the analysis of data, or the development of this man-
uscript.
Authors' contributions
WHG, KFZ, DB, and WEM conceived of the study and par-
ticipated in its design and coordination and helped to
draft the manuscript. WHG, KMS, and AT recruited study
participants and collected the data. All authors read and
approved the final manuscript.
Acknowledgements
We acknowledge the support of the Canadian Institutes of Health
Research, Natural Sciences and Engineering Research Council, Heart and
Stroke Foundation of Ontario, and Physiotherapy Foundation of Canada.
We acknowledge the support of Toronto Rehabilitation Institute who
receives funding under the Provincial Rehabilitation Research Program
from the Ministry of Health and Long Term Care in Ontario. Vivometrics
provided the LifeShirt data acquisition system. We appreciate the assist-
ance of Mathew Machina, Susan Czyzo, and Michael Sexsmith in collection
of data.
References
1. Peurala SH, Pitkanen K, Sivenius J, Tarkka IM: How much exercise
does the enhanced gait-oriented physiotherapy provide for
chronic stroke patients? J Neurol 2004, 251:449-453.
2. Bogey RA, Geis CC, Bryant PR, Moroz A, O'Neill BJ: Stroke and
neurodegenerative disorders. 3. Stroke: rehabilitation man-
agement. Arch Phys Med Rehabil 2004, 85:S15-20.
3. Mok VC, Wong A, Lam WW, Fan YH, Tang WK, Kwok T, Hui AC,
Wong KS: Cognitive impairment and functional outcome
after stroke associated with small vessel disease. J Neurol Neu-
rosurg Psychiatry 2004, 75:560-566.
4. Roth EJ, Meuller K, Green D: Cardiovascular response to physi-
cal therapy in stroke rehabilitation. NeuroRehabilitation 1992,
2:7-15.
5. MacKay-Lyons MJ, Makrides L: Cardiovascular stress during a
contemporary stroke rehabilitation program: is the intensity
adequate to induce a training effect? Arch Phys Med Rehabil 2002,
83:1378-1383.
6. Pang MY, Eng JJ, Dawson AS, Gylfadottir S: The use of aerobic
exercise training in improving aerobic capacity in individuals
with stroke: a meta-analysis. Clin Rehabil 2006, 20:97-111.
7. Macko RF, Smith GV, Dobrovolny CL, Sorkin JD, Goldberg AP, Silver
KH: Treadmill training improves fitness reserve in chronic
stroke patients. Arch Phys Med Rehabil 2001, 82:879-884.
8. Potempa K, Lopez M, Braun LT, Szidon JP, Fogg L, Tincknell T: Phys-
iological outcomes of aerobic exercise training in hemi-
paretic stroke patients. Stroke 1995, 26:101-105.
9. Gordon NF, Gulanick M, Costa F, Fletcher G, Franklin BA, Roth EJ,
Shephard T, American Heart Association Council on Clinical Cardiol-
ogy, Subcommittee on Exercise, Cardiac Rehabilitation, and Preven-
tion; the Council on Cardiovascular Nursing; the Council on
Nutrition, Physical Activity, and Metabolism; and the Stroke Council:
Physical activity and exercise recommendations for stroke
survivors: an American Heart Association scientific state-
ment from the Council on Clinical Cardiology, Subcommit-
tee on Exercise, Cardiac Rehabilitation, and Prevention; the
Council on Cardiovascular Nursing; the Council on Nutri-
tion, Physical Activity, and Metabolism; and the Stroke
Council. Stroke 2004, 35:1230-1240.
10. Bernhardt J, Dewey H, Thrift A, Donnan G: Inactive and alone:
physical activity within the first 14 days of acute stroke unit
care. Stroke 2004, 35:1005-1009.
11. Lincoln NB, Willis D, Philips SA, Juby LC, Berman P: Comparison of
rehabilitation practice on hospital wards for stroke patients.
Stroke 1996, 27:18-23.
12. Tang A, Sibley KM, Thomas SG, McIlroy WE, Brooks D: Maximal
exercise test results in subacute stroke. Arch Phys Med Rehabil
2006, 87:1100-1105.
13. Gowland C, Stratford P, Ward M, Moreland J, Torresin W, Van Hul-
lenaar S, Sanford J, Barreca S, Vanspall B, Plews N: Measuring phys-
ical impairment and disability with the Chedoke-McMaster
Stroke Assessment. Stroke 1993, 24:58-63.