Solar Cells Thin Film Technologies Part 6 pot
Bạn đang xem bản rút gọn của tài liệu. Xem và tải ngay bản đầy đủ của tài liệu tại đây (1.39 MB, 30 trang )
Crystalline Silicon Thin Film Solar Cells
139
thermal annealing step at 900°C follows. The silicon layers are passivated by a hydrogen
plasma treatment. Finally rather demanding structuring and contacting processes follow. In
production, modules 1x1.4 m² in size reached about 7% efficiency. In the lab 10.4% efficiency
were achieved on 92 cm² minimodules (Keevers et al., 2007). The production was stopped,
probably because of the high cost PECVD deposition, which was used because the method
was the only one available for silicon deposition in the m² range. In the lab, high rate
electron beam evaporation was tested as an alternative which delivered minimodules with
the efficiency of 6.7%, similar to that of the industrially produced modules (Egan et al., 2009;
Sontheimer et al., 2009).
The grain size originating in the furnace anneal is dictated by the interplay of crystal
nucleation within the amorphous matrix and growth of the nuclei (see Sect. 5). One can
influence both processes by the temperature of the annealing step. Practically, however,
there is not much choice. At lower temperature the annealing time required for complete
crystallization would reach unrealistic high values so that this is not possible in production.
Higher temperatures are not endured by the glass substrate for the time span needed for
crystallization. Even at 600°C 18 h are required for crystallization and high temperature
resistant borosilicate glass has to be used instead of a much cheaper soda lime glass.
As an alternative for the furnace crystallization pulsed excimer laser crystallization via the
melt is a process industrially used in flat panel display production. For this application,
however, rather thin films (<100 nm) are required and the resulting grain size is rather
small, typically below 1 µm. In the context of solar cell preparation requiring films thicker
than 1 µm this method has been mentioned only rarely (Kuo, 2009).
3. Multicrystalline silicon thin film solar cells: grains > 10 µm
3.1 Basic considerations
As mentioned in the last paragraph, grains larger than about 1 µm cannot be prepared by
direct deposition of crystalline silicon, nor by solid phase crystallization of a-Si nor via
melting a-Si by short laser pulses. Large grains can be produced from the melt only if the
melt is cooled below the equilibrium melting point slowly so that the melt stays long
enough in a region of low nucleation rate and there is time enough for the few nucleating
crystallites to grow to large size. Low cooling rate means low heat flow into the substrate
following from a low temperature gradient in the substrate. This can be achieved if the
melting time of the silicon layer is larger than in excimer laser crystallization, i.e. much
larger than 100 ns. To reach longer melting times the energy for melting has to be delivered
on a longer time scale. For energy delivery scanned electron beams or scanned laser beams
have been used. However, the longer melting time has the consequence, that dopand
profiles, introduced into the virgin a-Si for emitter, absorber, and back surface field, get
intermixed due to diffusion. Typical diffusion constants in liquid silicon are in the 10
-4
to 10
-3
cm²/s range (Kodera, 1963) so that dopands will intermix over a distance of 1 µm within 10
to 100 µs. Nevertheless a one-step crystallization procedure for a solar cell layer system has
been done by electron beam melting, discussed in Sect. 3.2. Alternatively a two-step
procedure has been used. In a first step a thin seed layer is crystallized to large grains from
a-Si by laser irradiation. In a second step the seed is thickened epitaxially. Seed and epitaxial
layer can be differently doped so that the seed can act as the emitter and the epitaxial layer
as the absorber of the solar cell. Alternatively, the seed may act as a highly doped back
surface field layer with the epitaxial layer acting as a moderately doped absorber. The
emitter is generated on top in a third preparation step.
Solar Cells – Thin-Film Technologies
140
An important issue in any of the mentioned preparation steps is the choice of the substrate.
This choice depends on the thermal load the substrate experiences during the silicon
crystallization process. Plastic substrates are not useful for any of the processes described in
Sect. 3 since the substrate temperature well exceeds 200°C. One usually divides the crystalli-
zation methods into low temperature processes for which glass can be used as a substrate and
high temperature processes for which glass is not sufficient. Instead, ceramics (e.g. alumina) or
graphite has been used. These substrate materials, however, are much more expensive than
glass so that the economic consequences for the high temperature routes are not so pleasant.
Typically, in high as in low temperature processes some barrier layer is used to prevent the
diffusion of foreign atoms from the substrate material into the silicon layer during the
processing steps. The barrier layer has to fulfil different requirements except of its main
purpose. First of all it has to withstand liquid silicon, i.e. it should not decompose or react
with the silicon melt. Moreover, it should not release gases which would blow off the silicon
layer. Then it should be well wetted by liquid silicon. Otherwise the silicon film during
melting could dewet to form droplets. This latter requirement is the reason that SiO
2
is not
useful as a barrier layer. Silicon nitride or silicon carbide are better suited. However, if
deposited by PECVD the layers contain too much hydrogen which is released during silicon
melting so that the silicon films are destroyed. According to our experience sputtered silicon
nitride is well suited if prepared correctly.
3.2 Single step layer preparation - electron beam crystallization
As mentioned in Sect. 3.1 silicon solar cell absorbers in substrate configuration have been
prepared by electron beam crystallization in a one step process (Gromball et al., 2004;
Amkreuz et al., 2009). On a glass substrate with a barrier layer (e.g. SiC) 7 to 15 µm of p-
doped (10
17
cm
-3
B) nanocrystalline silicon was deposited by high rate (up to 300 nm/min)
PECVD from trichlorosilane. This layer was crystallized by scanning a line shaped electron
beam (15 cm x 1 mm). At a scanning rate of 1 cm/s a beam energy density of 500mJ/cm² has
been used so that any position is treated for about 0.1 s. The resulting grain size is in the mm
range. To get a solar cell a 30 nm thick n-doped a-Si heteroemitter was deposited onto the
crystalline absorber by PECVD. The maximum solar cell parameters achieved so far were j
sc
= 12.4 mA/cm², V
oc
= 487 mV, and an efficiency of 3.5% (Amkreuz et al., 2009). Obviously
the absorber doping is too high and a back surface field is missing. Work is ongoing to
improve these cells.
3.3 Two-step process - seed preparation
In the two-step preparation method first a thin seed layer with the desired crystal structure
is prepared which can be used as a back surface field layer or as emitter in the final solar
cell. The absorber is then prepared by epitaxial thickening of the seed. In case of a cell in
superstrate configuration (illumination through the glass), the seed layer should be rather
thin. This is to reduce light absorption in the seed which is highly doped (as emitter or as
back surface field layer) and shows only low photovoltaic activity. Two seed preparation
methods have been investigated: aluminium induced crystallization (Fuhs et al., 2004) as
well as laser crystallization.
3.3.1 Aluminum induced crystallization for seed preparation
Aluminum induced crystallization (AIC) works as follows: On to the substrate an aluminum
layer is deposited by sputtering or evaporation. On top follows an amorphous silicon layer.
Crystalline Silicon Thin Film Solar Cells
141
When the Al/a-Si layer system is heated (350°C…550°C below the eutectic temperature of
the Al-Si system at 577°C) a layer exchange process takes place combined with silicon
crystallization, which is completed, at 500°C, in about 30 min. (Pihan et al., 2007). Finally, a
crystalline silicon layer rests on the glass and is covered by an aluminium layer, which may
contain silicon islands. The silicon layer is highly p-doped typically by 10
19
cm
-3
Al (Antes-
berger et al., 2007). It has been reported that the details of the process and the properties of
the final silicon layer depend on the thickness of an aluminum oxide layer which was
present between Al and a-Si before the tempering step. Typical resulting silicon grain sizes
are in the range of 10 µm. The preferred grain orientation is (100) but other orientations
occur as well (Schneider et al., 2006a). Typical layer thicknesses are 300 nm for Al and 375
nm for Si (Fuhs et al., 2004), which is a bit high for seed layers. However, even silicon films
thinner than 100 nm have been crystallized by AIC (Antesberger, 2007). Some work has been
done to understand the thermodynamics and the kinetics of the process (Wang et al., 2008;
Sarikov et al., 2006; Schneider et al., 2006b). It seems that silicon diffuses through the thin
alumina layer into the aluminum where it preferably further diffuses towards the glass
along the aluminum grain boundaries. When aluminum gets supersaturated by silicon,
nucleation of silicon crystallites starts preferably at the interface to the glass substrate. The
driving force for the process is the free energy difference between metastable amorphous
and absolutely stable crystalline silicon. Finally, the a-Si completely has diffused through
the aluminum which then rests on top. Before the crystalline silicon layer can be used as a
seed, the aluminum layer has to be removed, e.g. by wet chemical etching using HCl.
Challenging is the removal of the silicon islands included in the aluminum layer and of the
aluminum oxide film. The removal of both is crucial for good epitaxy (Rau et al., 2004). The
inverse process with the starting sequence glass/a-Si/Al and the final sequence glass/Al/c-
Si works as well (Gall et al., 2006). It has some advantages for cells in substrate con-
figuration, e.g. that a Al back contact is formed automatically. However, the Al/Si contact
has the consequence that any further processing steps, e.g. epitaxy, cannot be performed
above the eutectic temperature of the Al-Si system of 577°C. For this reason the inverse
process was abandoned.
There has been done a lot of work on silicon crystallization by other metals, e.g. Au, Ni, but
these methods did not find application in solar cell preparation.
3.3.2 Laser crystallization for seed preparation
To get large silicon crystals by laser crystallization the beam of a cw laser is scanned so that
the irradiation time at each position is in the ms range, much larger than during pulse laser
irradiation mentioned in Sect. 2. Under these conditions the temperature gradient and
therefore the heat flow in the substrate is low so that the melt undercools only slowly,
nucleation rates are low, and nucleated crystals have time enough to grow to large sizes (see
Sect. 5). First results on this method date back to the late 1970ies (Gat et al., 1978; Colinge et
al., 1982). At these times laser crystallization was performed for applications in micro-
electronics. Therefore amorphous silicon on wafers covered by oxide was used as starting
material. The only available well suited lasers were argon ion lasers emitting green light at
514 nm wavelength with a total power of up to 15 W. Typically a circular Gaussian beam
with diameter in the 40 µm range was scanned across the sample. At a scanning rate of 12.5
cm/s already in 1978 grains 2x25 µm in size were produced (Gat et al., 1978). Due to the
high thermal conductivity of the wafer substrate a rather high power density is needed for
melting and crystallization in this case. Only later glass was discovered as a useful substrate
Solar Cells – Thin-Film Technologies
142
for thin film transistor applications (Michaud et al., 2006) as well as for solar cells (Andrä et
al., 1998; Andrä et al. 2000). On glass with low thermal conductivity power densities of
about 20 kW/cm² are needed at scanning speeds of several cm/s. Due to the limited laser
power the spot diameter was limited to about 100 µm.
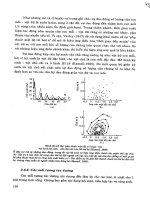
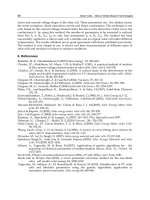
Fig. 1. Optical micrograph of a silicon layer crystallized by scanning the circular beam of an
argon ion laser. Left: single scan; right: overlapping scans
Fig. 1 (left) shows an optical micrograph of a single trace produced by scanning a circular Ar
ion laser beam. At the rim very fine crystals were produced. There the laser power just was
able to generate a temperature a bit above the melting point of a-Si, which is well below the
melting point of crystalline silicon (see Sect. 5.1). In the rim region a strongly undercooled
melt is generated which immediately (that is must faster than the irradiation time)
crystallizes to fine grained (about 100 nm) silicon. Towards the center of the trace the power
density increases so that the temperature gets higher, the undercooling gets lower, and a bit
larger grains solidify. In the central part the laser power is high enough to produce a silicon
melt above the equilibrium melting point of crystalline silicon (1412°C). There solidification
occurs only when the laser beam already has passed. The slowly undercooling liquid silicon
is in contact with the small crystallites of the rim region which crystallized earlier. From
these, lateral epitaxial growth takes place. The crystallization direction coincides with the
temperature profile following the scanned laser beam. Those of the many nuclei are
successful in epitaxy for which the fastest crystallographic growth direction coincides with
the temperature gradient. Therefore, a selection mechanism is active and only few of the
potential nuclei grow. As a consequence large grains form several 10 µm wide and over 100
µm long. To get not just one crystalline trace but a completely crystallized area, one just has
to scan the laser beam in overlapping rows (Fig. 1, right). In the second row the laser beam
remelts part of the previous row with the consequence that now the melt is in contact with
the large grains produced in the previous row. Therefore large crystals are already present
for lateral epitaxy to occur. In this way large areas covered by large grains can be produced.
Defect population in films generated in this way has been investigated (Christiansen et al.,
2000). The dislocation density was rather low. Grain boundaries are mostly Σ3 and Σ9 twin
boundaries which are expected to be not active electrically. The grain orientation is at
random with no preferential texture.
Later on, for crystallization the argon ion laser was replaced by a solid state cw Nd:YAG laser,
emitting green light of 532 nm wavelength after frequency doubling. Similar results were
obtained with this laser type (Andrä et al., 2005a). Both, argon ion as well as Nd:YAG lasers,
Crystalline Silicon Thin Film Solar Cells
143
have rather limited power so that it is impossible to crystallize seed layers for large area solar
cells in an industrial environment. For example, a 1 m² module would require many hours
laser treatment. Therefore, when looking for high power lasers we ended up with diode lasers,
emitting in the near infrared. However, the absorption coefficient of a-Si for 806 nm radiation,
the shortest wavelength available for high power diode lasers, at room temperature is only
about 0.3 µm
-1
, as compared to 25 µm
-1
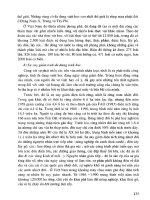
for green light. Fig. 2 shows the absorption of 806 nm
radiation in amorphous silicon (electron beam deposited, hydrogen free) as calculated from
optical properties (n and k) measured from room temperature up to 600°C and extrapolated up
to 1000°C. The maxima and minima are due to interference effects in the silicon layer.
Obviously there exists a problem for thin films, particularly at room temperature. In thin
films, only a small amount of the incoming radiation is absorbed at room temperature.
Therefore, to heat the silicon film, a rather high power density is needed. When heating
started successfully then the absorption increases and a run-off sets in which is only limited
after melting, when the reflectivity jumps up. So the process has some inherent instability,
which can be handled only when one preheats the substrate to about 600°C so that laser
heating starts at a higher absorption already. The substrate heating has another positive
effect, namely to reduce the cracking tendency of the glass substrate, for which we use a
borosilicate glass (Schott boro 33) with a thermal expansion coefficient very near to that of
silicon. Work using diode lasers for crystallization started 2006 (Andrä et al., 2006).
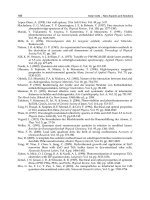
For our seed layer crystallization we use LIMO line focus lasers (806 nm wavelength, 13 mm
x 0.1 mm focus and 30 mm x 0.1 mm focus) with maximum power density of up to 25
kW/cm² (Andrä et al., 2006), allowing for scanning speeds up to several cm/s. Fig. 3 shows
an EBSD map of a crystallized region demonstrating large grains in the 100 µm range in 450
nm thick films. With the diode laser we can go down to 100 nm thin films. In these the
grains size is in the 30 µm range. A further problem with thin films is dewetting. This means
that holes form when the silicon film is liquid. It even happens that the holes grow to large
sizes and only a part of the substrate is covered by silicon. Dewetting can be reduced if the
wetting angle of liquid silicon on the substrate is low. This can be influenced by the barrier
layer on the glass substrate.
0 100 200 300 400 500 600 700 800 900 1000
0,0
0,1
0,2
0,3
0,4
0,5
0,6
0,7
Absorption
Film Thickness [nm]
Fig. 2. Absorption of 806 nm diode laser radiation in an amorphous silicon thin film on glass as
depending on film thickness. Film temperature 20°C (blue), 600°C (red), and 1000°C (black).
Solar Cells – Thin-Film Technologies
144
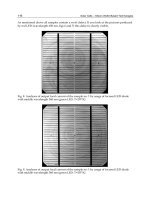
Fig. 3. EBSD map (inverse pole figure) of diode laser crystallized seed layers 450 nm (left)
and 110 nm (middle) thick. Color code for grain orientation is shown on the right.
Concerning the throughput, laser companies are just developing line focus diode lasers with
long lines (Lichtenstein 2010) which would allow crystallization of a 1 m² module within
minutes.
If seed layers thinner than 100 nm are to be crystallized diode lasers cannot be used due to
too low absorption even when preheated. We tested a pulsed green laser (JenLas ASAMA)
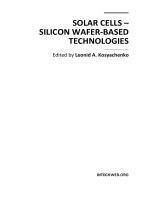
emitting 515 nm wavelength radiation (Andrä et al., 2010). This laser has a line focus up to
100 mm long and 5 to 10 µm wide and it delivers 600 ns pulses at a repetition rate of up to 80
kHz. At a fluence of about 1.2 J/cm² the sample was shifted 1.5 µm between subsequent
pulses. In this way 60 nm thin seed layers were crystallized without any preheating with
resulting grains several µm wide and several 10 µm long (Fig. 4). Obviously, the melt
generated during each laser pulse solidifies by lateral epitaxy so the grains generated by the
previous pulse grow stepwise. Finally long grains form, which continue over many pulses.
Since the width of the melt is 5 µm in our case and the melt exists for a time interval in the
several µs range, the solidification speed is in the m/s range. This value is near the
maximum following from solidification kinetics (see Sect. 5).
Fig. 4. EBSD map (inverse pole figure) of pulse laser crystallized seed layers 60 nm thick.
100
µ
m
300
µ
m
Crystalline Silicon Thin Film Solar Cells
145
3.4 Two step process - epitaxial thickening
In the two step preparation method on top of the multicrystalline seed layer the absorber of
the solar cell is prepared by epitaxial growth. Several methods have been used which can be
classified into direct epitaxial deposition and deposition as amorphous silicon followed by
epitaxial crystallization, either in the solid state by furnace or by laser annealing or via laser
melting. Particularly in the cases without melting the cleanliness of the interface between
crystalline seed and amorphous silicon to be epitaxially crystallized is an issue. Any
contaminants present, even small amounts of a monolayer, will jeopardize epitaxial
crystallization or at least increase the amount of extended defects in the epitaxial layer
appreciably. First of all, any silicon oxide has to be removed from the seed surface. This can
be achieved by HF. A 2% to 5 % solution in water is most useful. Success can be observed by
the naked eye. When HF has removed the oxide the silicon surface gets hydrogenated which
makes the surface hydrophobic and the etching solution dewets, i.e. forms droplets. Then
the HF solution can be blown off by nitrogen. The hydrogenated surface state remains stable
in ambient air at room temperature for about 1 h so that there is time enough to introduce
the sample into a deposition chamber for a-Si deposition. However, other possible con-
taminants are not so easily removed. It turned out as useful to start with an RCA cleaning
step before HF treatment. The RCA step removes e.g. organic contaminants.
3.4.1 Direct epitaxial deposition
The simplest epitaxial thickening procedure is direct epitaxial deposition of silicon on top of
the seed layer. Several processes have been investigated in the past, high temperature CVD
and, at intermediate temperature, electron beam evaporation, ECRCVD, and hot wire CVD.
The high temperature route has been reviewed recently (Beaucarne et al., 2004). The highest
efficiency reached so far with this method is 8% (Gordon et al., 2007). On an alumina substrate
seed layers were prepared by aluminium induced crystallization. Epitaxial thickening for the
p-doped absorber with rates up to 1.4 µm/min was done by thermal CVD at 1130°C from
trichlorosilane. The final emitter was prepared by phosphorus diffusion, or an a-Si
heteroemitter was deposited by PECVD. Corresponding to the seed layer the grain size in the
absorber is several 10 µm. It is expected that the efficiency is not so much limited by the grain
size but by intragrain defects, which have been thoroughly investigated (van Gestel et al.,
2009).
Even higher efficiencies of 11.1% were reached on seed layers crystallized by lamp heater zone
melting on graphite and high temperature epitaxy for absorber growth (Kunz et al., 2008). The
high temperature process has the advantage that it works on any grain orientation of the seed.
However, high temperature resistant substrates such as alumina, silica, glass ceramics, or
graphite are needed, which are not very feasible for large scale production.
At intermediate temperature both, electron beam evaporation, partly modified by ion assisted
deposition, or ECR-CVD (electron cyclotron resonance CVD) has been tested for epitaxy on
AIC seed layers. ECR-CVD was successfully applied at 585°C substrate temperature (Rau et
al., 2004). However, epitaxy worked well only on (100)-oriented grains, which is the most
common orientation following from AIC, but not the only one. At 670°C epitaxy by hot wire
CVD worked on any grain orientation with a rate of 100 nm/min. Ion assisted deposition, that
is electron beam evaporation plus some ionization of the silicon atoms, was tested for epitaxy
as well. For the deposition a temperature ramp was carefully optimized with maximum
temperature below 700°C. The deposition rate was 300 nm/min. The highest achieved open
circuit voltage of solar cells was 453 mV (Straub et al., 2005). Direct epitaxy during electron
Solar Cells – Thin-Film Technologies
146
beam evaporation at 550°C substrate temperature has successfully been demonstrated (Dogan
et al., 2008). Solar cells prepared with this process reached 346 mV open circuit voltage and
2.3% efficiency, which is a bit low as compared to the values achieved by other methods.
3.4.2 Solid phase epitaxy in furnace
Technically the most simple way to achieve epitaxial growth is to deposit first an amorphous
layer on top of the cleaned seed layer, and then to epitaxially crystallize the layer by furnace
annealing in the solid state. The layer to be crystallized can already contain the desired doping
profile which remains during the annealing step. The main critical point with this simple
procedure is that not only an epitaxial crystallization front moves into a-Si, but also
spontaneous nucleation will occur within a-Si followed by growth of crystallites. So there
exists a competing process to the desired epitaxy. The question arises, which of the two
succeeds. The speed of the epitaxial front of course depends on temperature (described by
Jackson-Chalmers equation, see Sect. 5.1) and so does nucleation, described by classical
nucleation theory (Sect. 5.2), and growth of nuclei, the latter phenomena described together by
Avrami-Mehl equation (Sect. 5.4). An important point, which makes SPE possible, is that, if no
nuclei pre-exist in the amorphous matrix, nucleation does not start immediately. Instead it
needs some time, called time lag of nucleation, until a stationary population of nuclei evolves
(Sect. 5.3). Only after that time lag the stationary nucleation rate applies at fixed temperature,
described by classical nucleation theory, and crystal nuclei appear. So any successful epitaxy
relies on the time lag of nucleation. The thickness of an epitaxially crystallized layer is just
given by the time lag of nucleation times the speed of the epitaxial crystallization front. After
the time lag, in the virgin amorphous silicon crystalline nuclei of random orientation appear
resulting in fine grained material, such as is generated by direct furnace crystallization (see
Sect. 2) without seed. For successful epitaxy one has to make sure that within the amorphous
phase there are no nuclei present which could form during deposition already.
In the last few years we developed the technique of SPE on diode laser crystallized seed layers
on borosilicate glass substrates (Andrä et al., 2008a; Schneider et al., 2010). The virgin a-Si
layers including a doping profile were deposited at high rate (typically 300 nm/min) by
electron beam evaporation at a substrate temperature in the 300°C range. At that temperature
no nuclei form within a-Si. The layer system was then annealed in a furnace under ambient air.
To control the progress of crystallization, an in situ measurement technique was installed. For
this purpose, the beam of a low power test laser was sent through the sample. The transmitted
intensity was monitored by a photocell. Since a-Si has a different optical absorption from c-Si,
the progress of crystallization can be monitored easily. In particular, the crystallization process
is complete when the transmission does not change any more. Fig. 5 shows a transmission
electron micrograph of a cross section of an epitaxially thickened silicon film.
Fig. 5. Transmission electron microscopic cross section image of a film epitaxially thickened
by furnace annealing.
Crystalline Silicon Thin Film Solar Cells
147
In summary we could epitaxially crystallize up to 1.6 µm of a-Si at a temperature of 630°C
within 3 h. The epitaxial quality as determined by EBIC was best in (100) oriented grains
and worst in (111) grains. Moreover, the epitaxial crystallization speed depends on
orientation and on the doping level. Higher doped layers crystallize faster. Solar cells pre-
pared on these layers reached an efficiency of 4.9% after hydrogen passivation (Schneider et
al., 2010). By TEM cross section investigations it was shown that the seed layers contain only
very few extended defects such as dislocations, whereas the epitaxial layer contains much
more. It seems that the cleaning procedure of the seed surface prior to a-Si deposition is
crucial for good epitaxial quality. At least the dislocation density in the epitaxial layer could
be reduced by an additional RCA cleaning step before removal of oxide by HF. However,
this did not reflect in the achieved solar cell efficiencies.
3.4.3 Layered laser crystallization
The epitaxy method of layered laser crystallization has been developed in our group years
ago (Andrä et al. 2005b, Andrä et al., 2008a). The principle is simple. During deposition of a-
Si on top of the seed layer excimer laser pulses are applied repeatedly, which melt the newly
deposited a-Si and a bit of the crystalline silicon beneath so that after each pulse epitaxial
solidification occurs. Again, the layer thickness to be crystallized by one laser shot is limited
by a competing nucleation process in the undercooling melt after the laser pulse. According
to our experience about 200 nm of a-Si can be epitaxially crystallized by one laser pulse. The
typical laser fluence needed is 550 mJ/cm². However, when during the whole thickening
process the thickness of the crystalline layer beneath the newly deposited a-Si increases from
the initial seed layer (say 200 nm) to the final absorber thickness (say 2 µm) the laser
parameters or the thickness of the newly deposited a-Si have to be adjusted so that the laser
pulse just melts the a-Si and bit of c-Si beneath. This adjustment is necessary because the
thermal properties of glass, c-Si, and a-Si differ so that the temperature profiles change
during the process if the laser energy would be kept constant. In the layered laser
crystallization process epitaxy works independently of the grain orientation, which is an
advantage since crystal orientation in the seed is at random. For the process, the laser pulse
has to be fed through a window in the deposition chamber onto the growing layer. In this
way the pulses can be applied without stopping deposition. For a-Si deposition we use
electron beam evaporation which has first the advantage of high deposition rate, at least an
order of magnitude higher than for PECVD, and secondly the advantage that deposition is
directed so that no deposition occurs at the laser window. Doping is achieved by co-
deposition of boron or phosphorus. In our device we can deposit and laser irradiate sub-
strates of up to 10x10 cm². The single laser spot has a size of 6x6 mm² with top hat profile. To
cover the whole substrate area the laser spot is scanned over the substrate by a scanning
mirror placed outside the deposition chamber. In order to avoid cracks in the glass substrate
heating to about 600°C helps. Upscaling the system to m² surely is a challenge but not
outside the technical possibilities. If properly optimized, about 10 laser pulses are needed at
each position during absorber deposition to prepare a 2 µm thick epitaxial film. This makes
sense only if the laser is fed into the deposition chamber and is applied without braking
deposition, as we do it in our lab scale equipment.
In the epitaxial layer prepared by layered laser crystallization the number of extended
defects like dislocations is much lower as compared to solid state epitaxy. This is because
the mobility of crystallizing atoms is much higher in the melt than in a-Si so that correct
placement is easier. The highest efficiencies achieved in solar cells prepared using the
Solar Cells – Thin-Film Technologies
148
method were 4.8% at an open circuit voltage of 517 mV (Andrä et al., 2005b; Andrä et al.,
2007). These values were measured on cells without any light trapping.
3.4.4 Liquid or solid phase epitaxy by diode laser irradiation
The layered laser crystallization method described in the last section has the drawback that
up-scaling into the industrial scale is not so easy. This is due to the fact, that the laser beam
has to be fed into the deposition chamber and several pulses have to be applied at each
position. That was the motivation for us to look for a method in which the complete
absorber thickness is deposited in the amorphous state on top of the seed and to apply a
single laser treatment to epitaxially crystallize the whole system in one run after deposition
outside the deposition chamber.
The most obvious way to achieve epitaxy is via the liquid phase similar to layered laser
crystallization. The main difference is that the whole amorphous absorber precursor layer is
melted in one step down to the seed, so that epitaxial solidification is to occur after
irradiation. It is a challenge to melt about 1 µm of a-Si without completely melt the about
200 nm thin c-Si seed beneath which would hamper any epitaxy. To crystallize a layer
system more than 1 µm thick, a short pulse laser is useless. To get the required energy into
the system the pulse fluence would have to be so large that ablation would occur at the
surface. Moreover, the cooling rate of the melt after a short laser pulse would be so high,
that nucleation is expected to occur in a surface near region before the epitaxial solidification
front reaches the surface. Therefore we decided to use a scanned cw diode laser for this
purpose with irradiation times in the ms range. In this case the cooling rate is low enough so
that the melt stays long enough in a slightly undercooled state with low nucleation rate until
the epitaxial solidification front reaches the surface. We succeeded in epitaxially
crystallizing 500 nm in one run. However, forming of cracks is an issue. Moreover, due to
the strong diffusion in the melt which intermixes any pre-existing doping profile, absorber
and emitter cannot be crystallized in one step.
An alternative is solid phase epitaxy in which the amorphous layer is heated by the laser to
a temperature of about 1100°C, below the melting point of a-Si. At such high temperature
the solid phase epitaxial speed was determined to several 100 nm/s high so that epitaxy of 1
µm should be complete within several seconds.
4. Post-crystallization treatment
4.1 Emitter preparation
The emitter of the final solar cell can be prepared in different ways. One is to include emitter
doping into the deposition sequence of the layer system so that no additional emitter
preparation step is needed. This way has been chosen in the CSG process and in layered
laser crystallization. It cannot be applied in case of liquid phase epitaxy of the whole layer
stack (Sect. 3.4.4) since during melting for several ms, diffusion in the liquid state would
intermix any dopand profile introduced during deposition. In this case, phosphorus doping
of a boron doped absorber as in conventional wafer cells can be performed. The only dif-
ference is that the doping profile has to be much shallower. Another variant is to use
amorphous heteroemitters. IMEC has found that this is the best emitter for their thin film
solar cells prepared by the high temperature route (Gordon et al., 2007).
Crystalline Silicon Thin Film Solar Cells
149
4.2 RTA and hydrogen passivation
To improve the solar cell performance some post-crystallization treatment is required. One
point is dopand activation, the other defect passivation.
In order that dopand atoms like boron or phosphorus really lead to a free carrier con-
centration higher than the intrinsic one, it is necessary that the dopand atoms are included
substitutionally in the lattice, i.e. that they rest on regular lattice positions replacing a silicon
atom. If they are included interstitially, resting not on regular lattice positions, they are
useless. If the silicon lattice forms from the melt the mobility of atoms is high enough so that
the dopand atoms can occupy lattice positions. In this case no additional means are needed
to make them active. This is not so in case of solid state crystallization. There most of the
dopand atoms are included interstitially so that they are inactive. To let them replace silicon
atoms substitutionally an additional heat treatment is needed, which is realized by a rapid
thermal annealing (RTA) step. In the CSG process, for example, the whole system is heated
to about 900°C for 2 min to achieve dopand activation (Keevers et al., 2007). It has been a lot
of speculation if this RTA step also improves the grain structure by reducing the number of
extended defects. This seems not to be the case (Brazil & Green, 2010).
In any case a hydrogen passivation step has to follow, in which different types of defects e.g.
dislocations and grain boundaries, are passivated. Usually, a remote hydrogen plasma is
applied to the layer system for 10 to 30 min at about 500°C. Crucial is that during cooling
down at the end of the process the plasma has to be applied for some time. A lot of
optimization work has been devoted to this passivation step (Rau et al., 2006), which easily
can improve the open circuit voltage of the cell by 200 mV.
5. Kinetics of phase transformation
In Sect. 5 the basics of phase transformation relevant for silicon thin film crystallization, both
from the melt and in the solid state are summarized (Falk & Andrä, 2006). The Section
divides in the propagation of already present phase boundaries and in nucleation, including
non-stationary nucleation. Kinetics of aluminum induced crystallization has already been
reviewed (Pihan et al., 2007) and is not treated in the following. The facts presented in this
section are the background for any successful crystallization of amorphous silicon, in the
furnace or by laser irradiation. Quantitative values following from the equations depend on
the material parameters of the system involved. These are rather well known for crystalline
and for liquid silicon, mostly in the whole range of temperature involved in the processes.
This is not the case for amorphous silicon, the properties of which strongly depend on the
preparation conditions. They may appreciably differ for hydrogenated a-Si prepared by
PECVD and hydrogen free a-Si deposited by electron beam evaporation. Therefore, quant-
itative predictions have to be taken with some care.
5.1 Propagation of phase boundaries
The propagation speed of already present phase boundaries into a metastable phase, i.e. the
growth of a crystal into the undercooled melt or into amorphous silicon, can quantitatively
be described by the Jackson-Chalmers-Frenkel-Wilson equation
*/
Δμ /
e1e
0
gkT
kT
vv
(1)
Solar Cells – Thin-Film Technologies
150
The prefactor v
0
= a
0
γν depends on the atomic vibration frequency (Debye frequency) ν, the
jump distance a
0
of the order of the lattice parameter of silicon and on a geometry factor γ of
the order of 1. Δµ>0 is the difference in chemical potential of the phases involved. For the
transition from liquid to crystalline Δµ may be approximated by
(1 )
c
mc
T
h
T
(2)
where Δh
c
is the latent heat per mole for melting and T
mc
is the equilibrium melting
temperature of 1685 K. For the crystallization of amorphous silicon Δµ is given in
the literature (Donovan et al., 1983). g* is an activation energy for the jump of an atom
from the parent to the final phase and is related to the self-diffusion coefficient D
according to
2
*/
0
e
γ
a
gkT
D
(3)
Results for crystallization from the melt and in the solid state are given in Figs. 6 and 7. In
the melt the crystallization speed vanishes at the equilibrium melting point T
mc
to increase
to a maximum of about 16 m/s at 200 K undercooling. At even lower temperature the
solidification front gets slower due to the increasing influence of the activation energy. At
temperatures above the melting point the phase front runs into the crystal, i.e. the crystal
melts and the speed changes sign. In Fig. 6. also the melting speed of amorphous silicon is
shown (with opposite sign as compared to c-Si). Melting of a-Si starts at T
ma
, which,
depending on the deposition conditions of a-Si, is 200 to 300 K lower than the melting point
of c-Si.
The crystallization speed in amorphous silicon shown in Fig. 7 increases with temperature,
and reaches about 1 mm/s near the melting point of a-Si. At 600°C the speed is only about
0.2 nm/s which well correlates with the results obtained in furnace solid phase epitaxy
(Sect. 3.4.2).
800 1000 1200 1400 1600 1800
0
10
20
T/K
v/(m/s)
Tmc
Tma
a
l
l
c
c
l
Fig. 6. Speed of the phase boundaries liquid-crystalline (lc) and amorphous liquid (al) for
crystalline solidification form the melt and melting of a-Si, respectively.
l→c
a→l
c→l
Crystalline Silicon Thin Film Solar Cells
151
600 800 1000 1200 1400
1E-10
1E-8
1E-4
1E-2
1
1E+2
1E+4
T/K
T
ma
V/µms
-1
Fig. 7. Speed of a crystallization front in amorphous silicon as depending on temperature
5.2 Stationary nucleation rate
Classical nucleation theory gives the nucleation rate J, i.e. the number of nuclei appearing in
a metastable phase per volume and time interval at given temperature. The value applies
after some induction time (Sect. 5.3) and as long as not too much of the parent phase is
consumed.
*
2/3
1/2
2
m
(36 )
3
c
G
g
c
c
kT
c
j
G
Je
V
jkT
(4)
In this formula V
m
is the atomic volume and j
c
and ΔG
c
are the number of atoms in and the
free energy of a critical nucleus of the new phase in the matrix of the parent phase,
respectively. These are given by
2
2
m
2
32
3
c
jV
(5)
3
2
m
2
16 1
92
cc
GV j
(6)
σ is the interface energy between both the phases, which, however, is hard to determine
independently of nucleation phenomena, and, in addition, may depend on temperature.
Moreover, σ strongly influences the nucleation rate since via Eqs. 5&6 it enters Eq. 4 in the
third power within the exponential. For crystallization in an undercooled silicon melt the
stationary nucleation rate is plotted in Fig. 8 for a temperature dependent interfacial energy
according to σ = (43,4+0.249 T/K) mJ/m
2
(Ujihara et al., 2001). Down to about 300 K below
the equilibrium melting point the nucleation rate is very low to change within 100 K of
further cooling by 35 orders of magnitude. Below 1200 K the nucleation rate gets rather flat
at a value of 10
35
m
-3
s
-1
= 0.1 nm
-3
ns
-1
. The stationary nucleation rate of crystallization in
amorphous silicon is plotted in Fig. 9. There the values increase by 16 orders of magnitude
when temperature is increased from 600 K to 1200 K. The nucleation rate then flattens off at
10
17
m
-3
s
-1
= 0.1 µm
-3
s
-1
up to the melting point of a-Si of 1400 K.
Solar Cells – Thin-Film Technologies
152
800 1000 1200 1400 1600
J/m
-3
s
-1
1E-30
1E-20
1E-10
1E0
1E10
1E20
1E30
1E40
T
mc
T/K
Fig. 8. Stationary nucleation rate for crystallization in an undercooled silicon melt
600 800 1000 1200 1400
1E0
1E10
1E20
T/K
T
ma
J/m
-3
s
-1
Fig. 9. Stationary nucleation rate for crystallization of amorphous silicon
5.3 Non-stationary nucleation
When the temperature of a system is changed abruptly from a value where the parent phase
is absolutely stable and there are no nuclei present to another temperature where it gets
metastable, then a population of nuclei evolves. Finally, a stationary distribution of nuclei
emerges which leads to the stationary nucleation rate of Eq. 4. The master equation for the
population of nuclei can be solved numerically. By some approximations a closed form for
non-stationary nucleation rate has been derived (Kashchiev, 1969), which leads to the
stationary value after some time lag of nucleation, which is given by
2
2
12
c
cc
j
kT
G
(7)
Crystalline Silicon Thin Film Solar Cells
153
β
c
is the attachment rate of atoms to the critical nucleus given by
*/
2/3
g
kT
cc
gj e
(8)
Here g is an accommodation coefficient of the order of 1. The result for nucleation of c-Si
from the melt is shown in Fig. 10. The time lag diverges at the equilibrium melting point and
has a minimum of 30 ps around 1350 K. At all relevant temperatures the time lag is so small
that it does not play any role in laser crystallization with pulses longer than 1 ns.
This is different for solid phase crystallization of amorphous silicon as shown in Fig. 11. The
time lag goes down from 10
13
s (or 300.000 years) at 600 K to 0.01 s at the melting point of a-
Si (1400 K). That means that below 300°C crystallization never occurs whereas in the CSG
process of furnace crystallization at 600°C the time lag is in the range of 2 h which does not
play a major role when complete crystallization takes 18 h. However, it gives an upper limit
for epitaxial growth by furnace annealing as described in Sect. 3.4.2.
1000 1200 1400 1600
1E-11
1E-10
1E-9
1E-8
T/K
T
mc
/s
Fig. 10. Time lag of nucleation for crystallization from the melt for a fixed value of interfacial
energy σ of 400 mJ/m²
600 800 1000 1200 1400
1E-2
1
1E2
1E4
1E6
1E8
1E10
1E12
T/K
T
ma
/s
Fig. 11. Time lag of nucleation for crystallization of amorphous silicon
τ/s
τ/s
Solar Cells – Thin-Film Technologies
154
5.4 Complete kinetics of transformation
Stationary nucleation together with the growth of supercritical nuclei according to the
Jackson-Chalmers equation leads to a continuous increase of the amount of the new phase
on account of the parent phase. When one takes account that during the progress of phase
transformation more and more parent phase is consumed and less volume is available for
actual transformation, one ends up with the Avrami-Mehl equation (Avrami, 1940) for the
volumetric amount of the new phase
44
/
1
c
tt
e
(9)
with the characteristic time
4
3
3
c
t
Jv
(10)
J is the stationary nucleation rate of Eq. 4 and v is the speed of propagation of a phase front
according to Jackson-Chalmers Eq. 1. In deriving Eq. 9 the time lag of nucleation τ has been
neglected. To include this effect, one simply replaces t by (t-τ) in Eq. 9 for t>τ. The resulting
average grain size when the parent phase has been consumed completely is given by
4
1.037
v
D
J
(11)
So the grains are the larger the higher the Jackson-Chalmers speed and the lower the
nucleation rate is, which sounds reasonable. To get large grains from an undercooled melt
one should keep the temperature in a range of not too high undercooling, where nucleation
rate is low and growth rate is high (Figs. 6 and 8). Fig. 12 shows the expected final grain size
in solid phase crystallization of amorphous silicon. It shows that in the CSG process at about
600°C (see Sect. 3.) grains of several µm are to be expected, which is in accordance with
experiments. By increasing the crystallization temperature one cannot change the grain size
appreciably. Lowering the temperature would lead to a rather high time needed for
crystallization due to higher time lag of nucleation (Fig. 11), lower nucleation rate (Fig. 9),
and lower growth rate (Fig. 7).
600 800 1000 1200 1400
1
D/µm
10
100
T/K
T
ma
Fig. 12. Average grain size after solid phase crystallization of amorphous silicon as
depending on temperature
Crystalline Silicon Thin Film Solar Cells
155
6. Conclusion
Multi- and polycrystalline silicon thin film solar cells receive growing interest worldwide.
Presently, the maximum efficiency reached by these types of cells is 10.4%. Different cell
concepts and preparation methods are under investigation and no clear favourite way is
identified up to now. The concepts differ in the resulting grain structure, i.e. size and
quality, but also in the preparation technologies used and the processing time needed.
Today it is not clear which of the methods will succeed in industrial production. In all the
methods, pin holes in the films are an issue since they lead to shunting of the final cells.
Another issue is dopand deployment, particularly along grain boundaries. This also may
lead to shunting, which today limits the open circuit voltage to slightly above 500 mV. A
further point is that TCO cannot easily be used as a front contact in superstrate cells since it
hardly withstands the temperatures needed for crystallization. Usually a highly doped
silicon layer is used instead, which, however, has somewhat low transparency.
Very important for thin film crystalline solar cell is a perfect light management so that about
2 µm of silicon is enough to absorb the solar spectrum. This can be achieved either by
structured substrates or by texturing the surface. In the first case, the irregular substrate
surface should not influence the crystallization behaviour. In the second case, the rough
surface should not increase surface recombination. Generally, passivation of defects and of
the surface is a crucial preparation step.
Concerning the theoretical description of the processes involved in crystallization, the basic
equations are well understood. However, there are some issues with the material
parameters involved, which, particularly for amorphous silicon, strongly depend on
deposition conditions and therefore need to be determined individually. But even if
numerical predictions may not completely coincide with experiments due to inadequate
numerical values of the materials parameters, general trends can reliably be predicted.
All the mentioned issues need further investigation. Careful study of these topics is
expected to lead to full exploitation the potential of the material. Multicrystalline thin film
cells with a ratio of grain size over film thickness similar to multicrystalline wafer cells
should deliver, if prepared correctly, comparable efficiencies. Therefore we expect the poly-
and multicrystalline silicon thin film solar cells to gain increasing significance and may
replace microcrystalline silicon cells. Multicrystalline silicon also can act as one partner in
tandem cells which would further increase the efficiency.
7. Acknowledgment
This work partly was funded by the European Commission under contract 213303 (HIGH-
EF), and by the German state of Thuringia via Thüringer Aufbaubank under contract 2008
FE 9160 (SolLUX). We would like to thank J. Lábár and G. Sáfrán (MFA Budapest) for TEM
investigations.
8. References
Amkreutz, M.; Müller, J.; Schmidt, M.; Haschke, J.; Hänel, T. & Schulze, T.F. (2009).
Optical and electrical properties of electron beam crystallized thin film silicon
Solar Cells – Thin-Film Technologies
156
solar cells on glass substrates. Proc. 24th Europ. Photovoltaic Solar Energy Conf., pp.
2506-2509
Andrä, G.; Bergmann, J.; Falk, F.; Ose, E. & Stafast, H. (1998). Laser Induced Crystallization
of Amorphous Silicon Films on Glass for Thin Film Solar Cells. Physica status solidi
(a), Vol. 166, pp. 629-634
Andrä, G.; Bergmann, J.; Falk, F. & Ose, E. (2000). Preparation of single crystalline regions in
amorphous silicon layers on glass by Ar
+
laser irradiation. Applied Surface Science,
Vol. 154-155, pp. 123-129
Andrä, G.; Bergmann, J. & Falk, F. (2005a). Laser crystallized multicrystalline silicon thin
films on glass. Thin Solid Films, Vol. 487, pp. 77-80
Andrä, G.; Bergmann, J.; Bochmann, A.; Falk, F.; Dauwe, S. & Kieliba, T. (2005b).
Characterization and simulation of multicrystalline LLC-Si thin film solar cells.
Proc. 20th Europ. Photovoltaic Solar Energy Conf., pp. 1171-1174
Andrä, G.; Bochmann, A.; Falk, F.; Gawlik, A.; Ose, E. & Plentz J. (2006). Diode laser
crystallized multicrystalline silicon thin film solar cells on glass. Proc. 21st Europ.
Photovoltaic Solar Energy Conf., pp. 972-975
Andrä, G.; Plentz, J.; Gawlik, A.; Ose, E.; Falk, F. & Lauer, K. (2007). Advances in multi-
crystalline LLC-Si thin film solar cells. Proc. 22nd Europ. Photovoltaic Solar Energy
Conf., pp. 1967-1970
Andrä, G.; Gimpel, T.; Gawlik, A.; Ose, E.; Bochmann, A.; Christiansen, S.; Sáfrán, G.; Lábár,
J.L. & Falk, F. (2008a). Epitaxial Growth of Silicon Thin Films for Solar Cells.
Proc. 23rd Europ. Photovoltaic Solar Energy Conf. 2008, pp. 2194-2198
Andrä, G.; Lehmann, C.; Plentz, J.; Gawlik, A.; Ose, E. & Falk, F. (2008b). Varying the Layer
Structure in Multicrystalline LLC-Silicon Thin-Film Solar Cells. Proc. 33rd IEEE
Photovoltaic Specialists Conf., pp. 457-462
Andrä, G.; Bergmann, J.; Gawlik, A.; Höger, I.; Schmidt, T.; Falk, F.; Burghardt, B. &
Eberhardt, G. (2010). Laser Induced Crystallization Processes for Multicrystalline
Silicon Thin Film Solar Cells. Proc. 25th Europ. Photovoltaic Solar Energy Conf. 2010,
pp. 3538-3542
Antesberger, T.; Jaeger, C.; Scholz, M. & Stutzmann, M. (2007). Structural and electronic
properties of ultrathin polycrystalline Si layers on glass prepared by aluminum-
induced layer exchange. Applied Physics Lett., Vol. 91, pp. 201909
Avrami, M. (1940), Kinetics of Phase Change. II Transformation-Time Relations for Random
Distribution of Nuclei, J. Chemical Physics, Vol. 8, pp. 212-224
Beaucarne, G.; Bourdais, S. ; Slaoui, A. & Poortmans, J. (2004). Thin-film polycrystalline Si
solar cells on foreign substrates : film formation at intermediate temperatures (700-
1300°C). Applied Physics A, Vol. 79, pp. 469-480
Beaucarne, G.; Gordon, I.; van Gestel, D.; Carnel, L. & Poortmans, J. (2006). Thin-film poly-
crystalline silicon solar cells: An emerging photovoltaic technology. Proc. 21st
European Photovoltaic Solar Energy Conference, pp. 721-725
Beaucarne, G. (2007). Silicon thin-film solar cells. Advances in OptoElectronics, Vol. 2007,
Article ID 36970
Crystalline Silicon Thin Film Solar Cells
157
Brazil, I. & Green, M.A. (2010). Investigating polysilicon thin film structural changes during
rapid thermal annealing of a thin film crystalline silicon on glass solar cell. J.
Materials Sci.: Materials in Electronics, Vol. 21, pp. 994-999
Brendel, R. (2001). Review of layer transfer process for crystalline thin-film silicon solar cells.
Japanese J. Applied Physics, Vol. 40, pp. 4431-4439
Brendel, R.; Feldrapp, K.; Horbelt, R. & Auer, R. (2003). 15.4%-efficient and 25 µm-thin
crystalline Si solar cell from layer transfer using porous silicon. Physica status solidi
(a), Vol. 197, pp. 497-501
Christiansen, S.; Nerding, M.; Eder, C.; Andrae, G.; Falk, F.; Bergmann, J.; Ose, E. & Strunk
H.P. (2000). Defect population and electrical properties of Ar
+
-laser crystallized
polycrystalline silicon thin films. Materials Res. Soc. Symp. Proc., Vol. 621, art.
Q7.5.1
Colinge, J.P.; Demoulin, E.; Bensahel, D. & Auvert, G. (1982). Use of selective annealing for
growing very large grain silicon on insulator films. Applied Physics Lett., Vol. 41, pp.
346-347
Dogan, P.; Rudigier, E.; Fenske, F.; Lee, K.Y.; Gorka, B.; Rau, B.; Conrad, E. & Gall, S. (2008).
Structural and electrical properties of epitaxial Si layers prepared by e-beam
evaporation. Thin Solid Films, Vol. 516, pp. 6989-6993
Donovan, E.P.; Spaepen, F.; Turnbull, D.; Poate, J.M. & Jacobson, D.C. (1983). Heat of
crystallization and melting point of amorphous silicon. Applied Physics Lett., Vol. 42,
pp. 698-700
Egan, R.; Keevers, M.; Schubert, U.; Young, T.; Evans, R.; Partlin, S.; Wolf, M.; Schneider, J.;
Hogg, D.; Eggleston, B.; Green, M.; Falk, F.; Gawlik, A.; Andrä, G.; Werner, M.;
Hagendorf, C.; Dogan, P.; Sontheimer, T. & Gall, S. (2009). CSG minimodules using
electron-beam evaporated silicon. Proc. 24th Europ. Photovoltaic Solar Energy Conf.
2009, pp. 2279-2285
Falk, F. & Andrä, G. (2006), Laser crystallization – a way to produce crystalline silicon films
on glass or polymer substrates. J. Crystal Growth, Vol. 287, pp. 397-401
Fogarassy, E; de Unamuno, S.; Legagneux, P.; Plais, F.; Pribat, D.; Godard, B. & Stehle, M.
(1999). Surface melt dynamics and super lateral growth regime in long pulse
duration excimer laser crystallization of amorphous Si films. Thin Solid Films, Vol.
337 pp. 143-147
Fuhs, W.; Gall, S.; Rau, B.; Schmidt, M. & Schneider, J. (2004). A novel route to a poly-
crystalline silicon thin-film solar cell. Solar Energy, Vol. 77, pp. 961-968
Gall, S.; Schneider, J.; Klein, J.; Hübener, K.; Muske, M.; Rau, B.; Conrad, E.; Sieber, J.; Petter,
K.; Lips, K.; Stöger-Pollach, M.; Schattschneider, P. & Fuhs, W. (2006). Large-
grained polycrystalline silicon on glass for thin-film solar cells. Thin Solid Films, Vol.
511, pp. 7-14
Gat, A.; Gerzberg, L.; Gibbons, J.F.; Magee, T.J.; Peng, J. & Hong, J.D. (1978). cw laser anneal
of polycrystalline silicon: Crystalline structure, electrical properties. Applied Physics
Lett., Vol. 33, pp. 775-778
Gordon, I.; Carnel, L.; Van Gestel, D.; Beaucarne, G. & Poortmans, J. (2007). 8% efficient thin-
film polycrystalline-silicon solar cells based on aluminum-induced crystallization
and thermal CVD. Progress in Photovoltaics, Vol. 15, pp. 575-586
Solar Cells – Thin-Film Technologies
158
Green, M.A.; Basore, P.A.; Chang, N.; Clugsto, D.; Egan, R.; Evans, R.; Hogg, D.; Jarnason, S.;
Keevers, M.; Lasswell, P.; O’Sullivan, J.; Schubert, U., Turner, A.; Wenham, S.R.; &
Young, T. (2004). Crystalline silicon on glass (CSG) thin-film solar cell modules.
Solar energy, Vol. 77, pp. 857-863
Green, M.A. (2007). Thin-film solar cells: review of materials, technologies and commercial
status. J. Materials Science: Materials in Electronics, Vol. 18, pp. S15-S19
Green, M.A.; Eemery, K.; Hishikawa, Y. & Warta, W. (2011). Solar cell efficiency tables
(version 37). Progress in Photovoltaics, Vol. 19, pp. 84-92
Gromball, F.; Heemier, J.; Linke, N.; Burchert, M. & Müller, J. (2004). High rate deposition
and in situ doping of silicon films for solar cells on glass. Solar Energy Materials and
Solar Cells, Vol. 84, pp. 71-82
Hatano, M.; Moon, S; Lee, M.; Grigoropoulos, C.P. & Suzuki, K. (2001). Excimer laser-
induced melting and resolidification dynamics of silicon thin films. J. Korean
Physical Society, Vol. 39, pp. S419-S424
Jackson, K.A. & Chalmers, B. (1956), Kinetics of Solidification. Canadian J. Physics, Vol. 34,
pp. 473-490
Kunz, T.; Burkert, I.; Gawehns, N. & Auer, R. (2008). Crystalline silicon thin-film solar cells
on graphite or SiC-ceramic substrates. Proc. 23rd Europ. Photovoltaic Solar Energy
Conf. (2008), pp. 2202-2204
Kashchiev, D. (1969). Solution of the non-steady state problem in nucleation kinetics. Surface
Science, Vol. 14, pp. 209-220
Keevers, M.J.; Young, T.L.; Schubert, U. & Green, M.A. (2007). 10% efficient CSG mini-
modules, Proc. 22nd Europ. Photovoltaic Solar Energy Conference, pp. 1783-1790
Kodera, H. (1963). Diffusion coefficients of impurities in silicon melt. Japanese J. Applied
Physics, Vol. 2, pp. 212-219
Kuo, C C. (2009) Fabrication of large-grain polycrystalline silicon for solar cells. Laser
Physics, Vol. 19, pp. 143-147
Lichtenstein, N.; Baettig, R.; Brunner, R.; Müller, J.; Valk, B.; Gawlik, A.; Bergmann, J. &
Falk, F. (2010). Scalable, High Power Line Focus Diode Laser for Crystallizing of
Silicon Thin Films. Physics Procedia, Vol. 5, pp. 109-117
Mariucci, L; Pecora, A; Fortunato, G.; Spinella, C. & Bongiorno, C. (2003). Crystallization
mechanisms in laser irradiated thin amorphous silicon films. Thin Solid Films, Vol.
427, pp. 91-95
Michaud, J.F.; Rogel, R.; Mohammed-Brahim, T. & Sarret, M. (2006). Cw argon ion laser
crystallization of silicon films: Structural properties. J. Non-Crystalline Solids, Vol.
352, pp. 998-1002
Pihan, E.; Slaoui, A. & Maurice, C. (2007). Growth kinetics and crystallographic properties of
polysilicon thin films formed by aluminium-induced crystallization, J. Crystal
Growth, Vol. 305, pp. 88-98
Rau, B.; Sieber, J.; Schneider, J.; Muske, M.; Stöger-Pollach, M.; Schattschneider, P.; Gall, S. &
Fuhs, W. (2004). Low-temperature Si epitaxy on large-grained polycrystalline seed
layers by electron-cyclotron resonance chemical vapor deposition. J. Crystal Growth,
Vol. 270, pp. 396-401
Crystalline Silicon Thin Film Solar Cells
159
Rau, B.; Conrad, E. & Gall, S. (2006). Influence of post-deposition treatment of absorber
layers on poly-Si thin-film solar cells on glass grown by ECRCVD. Proc. 21
st
Europ.
Photovoltaic Solar Energy Conf., pp. 1418-1421
Reuter, M.; Brendle, W.; Tobail, O. & Werner, J.H. (2009). 50 µm thin solar cells with 17.0%
efficiency. Solar Energy Materials and Solar Cells, Vol. 93, pp. 704-706
Sarikov, A.; Schneider, J.; Klein, J.; Muske, M. & Gall, S. (2006). Theoretical study of the
initial stage of the aluminium-induced layer-exchange process. J. Crystal Growth,
Vol. 287, pp. 442-445
Schneider, J.; Sarikov, A.; Klein, J.; Muske, M.; Sieber, J.; Quinn, T.; Reehal, H.S.; Gall, S. &
Fuhs, W. (2006a). A simple model explaining the preferential (100) orientation of
silicon thin films made by aluminum-induced layer exchange. J. Crystal Growth,
Vol. 287, pp. 423-427
Schneider, J.; Schneider, A.; Sarikov, A.; Klein, J.; Muske, M.; Gall, S. & Fuhs, W. (2006b).
Aluminum-induced crystallization: Nucleation and growth process. J. Non-
Crystalline Solids, Vol. 352, pp. 972-97
Schneider, J.; Dore, J.; Christiansen, S.; Falk, F.; Lichtenstein, N.; Valk, B.; Lewandowska, R.;
Slaoui, A.; Maeder, X.; Lábár, J.; Sáfrán, G.; Werner, M.; Naumann, V. & Hagendorf,
C. (2010). Solar Cells from Crystalline Silicon on Glass Made by Laser Crystallised
Seed Layers and Subsequent Solid Phase Epitaxy. Proc. 25th Europ. Photovoltaic Solar
Energy Conf. 2010, pp. 3573-3676
Sontheimer, T.; Dogan, P.; Becker, C.; Gall, S.; Rech, B.; Schubert, U.; Young, T.; Partlin, S.;
Keevers, M. & Egan, R.J. (2009). 6.7% efficicent poly-Si thin film mini-modules by
high-rate electron-beam evaporation. Proc. 24th Europ. Photovoltaic Solar Energy
Conf. 2009, pp. 2478-2481
Straub, A.; Inns, D.; Terry, M.L.; Huang, Y.; Widenborg, P.I. & Aberle A.G. (2005).
Optimisation of low-temperature silicon epitaxy on seeded glass substrates by ion-
assisted deposition. J. Crystal Growth, Vol. 280, pp. 385-400
Teplin, C.W.; Branz, H.M.; Jones, K.M.; Romero, M.J.; Stradins, P. & Gall, S. (2007). Hot-wire
chemical vapor deposition epitaxy on polycrystalline silicon seeds on glass.
Materials Research Society Symposium Proc., Vol. 989-A06-16: Amorphous and Poly-
crystalline Thin-Film Silicon Science and Technology 2007, pp. 133-137
Ujihara, T.; Sazaki, G., Fujiwara, K.; Usami, N. & Nakajima, K. (2001). Physical model for the
evaluation of solid-liquid interfacial tension in silicon. J. Applied Physics, Vol. 90
(2001), pp. 750-755
Van Gestel, D.; Gordon, I.; Bender, H.; Saurel, D.; Vanacken, J.; Beaucarne, G. & Poortmans,
J. (2009). Intragrain defects in polycrystalline silicon layers grown by aluminum-
induced crystallization and epitaxy for thin-film solar cells. J. Applied Physics, Vol.
105, p. 114507
Wang, Z.M. ; Wang, J.Y.; Jeurgens, L.P.H. & Mittemeijer, E.J. (2008). Thermodynamics and
mechanism of metal-induced crystallization in immiscible alloy systems: Experi-
ments and calculations on Al/a-Ge and Al/a-Si bilayers. Physical Review B, Vol. 77,
pp. 045424
Solar Cells – Thin-Film Technologies
160
Werner, J.H.; Dassow, R.; Rinke, T.J.; Köhler, J.R. & Bergmann, R.B. (2001). From poly-
crystalline to single crystalline silicon on glass. Thin Solid Films, Vol. 383, pp. 95-
101
8
Architectural Design Criteria for
Spacecraft Solar Arrays
Antonio De Luca
VEGA Space GmbH
Germany
1. Introduction
Scope of this chapter is to provide design criteria for spacecraft solar arrays at system level.
The design a satellite solar array is usually influenced by several constraints; mission profile,
chosen attitude, overall spacecraft configuration, mass and sizing requirements, etc.
Moreover, its design has to be harmonised with the chosen solar array power conditioning,
in order to optimize mass, dimensions, and also particular constraints coming from EMC
and thermal environments.
The chapter is basically composed of the following sections;
1. General description of the current solar cell technologies currently used in space, with
particular attention to the triple junction solar cells.
2. Mathematical model of an equivalent solar cell circuit, to be used for performance
calculations in a numerical simulation environment.
3. Mathematical description of a simplified thermal model of a solar array in order to
analyse solar array performances in orbit.
4. Short definition of cosmic radiation effects.
5. The satellite power budget, starting point for the solar array sizing
6. The impact of the power conditioning architecture on the solar array (electrical
operative point, EMC considerations).
7. The configuration of the solar array with respect to the spacecraft.
8. Some design examples for different missions and satellite configurations.
9. Numerical simulations of solar array performances as function of the mission profile
(orbit propagation, slew manoeuvres, attitudes of particular interest).
2. Solar cells for space applications
Since the beginning of the astronautic era, photovoltaic devices have been considered for the
generation of electrical power on board spacecrafts because of their high power output per
unit mass, associated with the fundamental advantage of not having moving parts, present,
instead, in all the most used electrical power generators for both terrestrial and aeronautical
applications (turbines, motors, alternators, etc.). Therefore the PV array is static, does not
produce vibrations or noise, and does not need an active cooling. The Russians were the
first, in 1958, to launch a satellite powered with silicon solar cells.
Solar Cells – Thin-Film Technologies
162
Solar cells for space applications have to be highly efficient, capable to stand thousands of
thermal cycles in orbit where the temperature, according to the mission profile may vary
from -150 °C to more than 120 °C. They have to show a limited degradation during time due
to cosmic radiations and Ultraviolet, and they have to resist to the mechanical solicitations
mainly linear accelerations and vibrations during launch and orbital manoeuvres, because
of these constraints the cells for space are smaller than those for terrestrial applications.
In order to have the highest conversion efficiency, solar cells for space application are
developed from mono-crystalline materials. In the past silicon was the most used and the
reachable bulk efficiency was not higher than 14%. The advent of GaAs based solar cells in
the last decade of the 20
th
century took the efficiency up to 19%, and nowadays triple
junction solar cells show more than 30%.
Figure 1 shows a very simplified structure of triple junction cell.
Fig. 1. Triple junction solar cell structure
While figure 2 reports the quantum efficiency for each junction, it can be clearly seen that
the increased efficiency is due to wider wavelength coverage of the absorbed radiation.
Fig. 2. Equivalent quantum efficiency as function of wavelength
Triple junction GaAs solar cells are populating more and more solar generators worldwide,
while manufacturers are actively working on four to six junction cells as a way forward
always increasing conversion efficiency. Consequently, there is a need to improve the
understanding of the electrical dynamic behaviour of multi-junction based solar array
considering that the proper design of solar array regulators requires, among others, a good
mastering of the solar section/regulator interface. In order to better understand EMC
aspects connected to the chosen regulation philosophy, which will be discussed further, it is
worth to have a quick look at the equivalent capacitance present at the output of a triple
junction cell. The figure 3 reports the capacitance measured across strings composed of 15
cells. The cells used are produced by AZUR SPACE Solar Power GmbH. It can be observed
that at high voltages the capacitance is considerably increased. Such behaviour has to be
GaInP
GaAs
Ge
n
p
n
n
p
p
Tunnel
junctions
Metal
Front metal
GaInP
GaAs
Ge
n
p
n
n
p
p
Tunnel
junctions
Metal
Front metal
Architectural Design Criteria for Spacecraft Solar Arrays
163
taken into account when the power conditioning architecture is chosen, and the relevant
devices designed.
Fig. 3. Capacitance identified for the 15 cells string, Gaget2 and 3G28 (AZUR SPACE
products)
3. Solar cell equivalent circuit
The mathematical model of a photovoltaic cell has to take into account the following factors
capable to influence the solar cell behaviour.
1. Intensity of the incident light.
2. Operative absolute temperature.
3. Degradation by cosmic radiation.
The solar cell model, derived from the Mottet-Sombrin’s one, is basically a current generator
driven by the value of the voltage applied at its terminal according to the equivalent circuit
reported below. Generally speaking a solar cell is a particular p-n junction where the
diffusion process (diode D1) co-exists with the generation and recombination effect of the
charge carrier (diode D2) induced by the presence of crystalline defects. This model was
tested using data relevant to the AZUR SPACE 28% solar cell, as reported in the datasheet
provided by the Manufacturer, and available on company web-site.
Fig. 4. Equivalent Circuit of solar cell
The relevant Kirchhoff equations are:
exp 1 exp 1
2
DD
D
oLD R
p
qV qV
V
iii i
kT kT R
(1a)
0
50
100
150
200
250
300
350
400
450
500
0 1020304050
String voltage (V)
Capacitance (nF)
Gaget2 3G28
i
L
i
D
i
R
i
O
D
1
D
2
R
P
R
S
R
O
V
O
V
D