Waves in fluids and solids Part 10 pdf
Bạn đang xem bản rút gọn của tài liệu. Xem và tải ngay bản đầy đủ của tài liệu tại đây (2.17 MB, 25 trang )
Waves in Fluids and Solids
214
2. Fourth-order RK method for solving ODEs
2.1 Basic RK algorithm
Consider the following ordinary differential equation
().
du
Lu
dt
(1)
Where, u is an unknown function of time t, and L is a known operator with respect to u at
each spatial point (i, j, k) for the 3D case. Equation (1) can be solved as an ordinary equation
using the following fourth-order Runge-Kutta method
(1)
(2) (1)
(3) (2)
(1) (2) (3) (3)
1
1
(),
2
1
(),
2
(),
11
2().
36
nn
n
n
nn
uu tLu
uu tLu
uutLu
uuuuutLu
(2)
Where, t
is the temporal increment, ()
n
uunt
, and u
(1)
, u
(2)
and u
(3)
are the intermediate
variables. Equation (2) shows that the RK algorithm needs to store these three intermediate
variables at each time advancing step, so the storage required for computer code is very
large for 3D problems. To save storage, we can equivalently change it into the following
two-stage scheme
22
122
11
*()(),
24
1111
2* ( ) (*) (*).
3336
nn n
nn n
uu tLu tLu
uuutLutLutLu
(3)
Where
2
LLL
. Algorithm (3) uses only one intermediate variable u*, resulting in that the
modified two-stage RK used in this chapter can effectively save the computer memory in the
3D wave propagation modeling.
2.2 Transformations of 3D wave equations
In a 3D anisotropic medium, the wave equations, describing the elastic wave propagation,
are written as
2
2
,
ij
i
i
j
u
f
x
t
(4a)
1
(),
2
kl
ij ijkl
lk
uu
c
xx
(4b)
where subscripts i, j, k and l take the values of 1, 2, 3, ρ=ρ(x,y,z) is the density, u
i
and f
i
denote the displacement component and the force-source component in the i-th direction,
A Fourth-Order Runge-Kutta Method
with Low Numerical Dispersion for Simulating 3D Wave Propagation
215
and x
1
, x
2
and x
3
are x, y, and z directions, respectively.
ij
are the second-order stress
tensors, c
ijkl
are the fourth-order tensors of elastic constants which satisfy the symmetrical
conditions c
ijkl
= c
jikl
= c
ijlk
= c
klij
, and may be up to 21 independent elastic constants for a 3D
anisotropic case. Specially, for the isotropic and transversely isotropic case, the 21
independent elastic constants are reduced to two Lamé constants (λ and μ) and five
constants (
11
c ,
13
c ,
33
c ,
44
c , and
66
c ) , respectively.
To demonstrate our present RK method, we transform equation (4) to the following vector
equation using the stress-strain relation (4b)
2
2
.
U
DU f
t
(5)
Where
123
(,,)
T
uuuU ,
123
(,,)
T
f
fff , D is a second-order partial differential operator
with respect to space coordinates. For instance, for a transversely isotropic homogenous
case, the partial differential operator can be written as follows
222 2 2
11 66 55 12 66 13 55
222
2
2222
12 66 66 22 44 23 44
222
22222
13 55 23 44 55 44 33
222
() ()
() () .
() ()
z
ccc cc cc
xy xz
xyz
u
Dcc ccc cc
xy yz
xyz
cc cc c c c
xz yz
x
y
z
Let /, 1,2,3
ii
wuti , and
123
(,,)
T
Wwww , then equation (5) can be rewritten as
,
11
.
U
W
t
W
DU f
t
(6)
Define
(, )
T
VUW , then equation (6) can be further written as
,
V
LV F
t
(7)
where
33
00
,
11
0
I
LF
Df
,
33
I
is the third-order unit operator.
Define the following vectors and operator matrix:
[, , , ]
T
VVV
VV
x
y
z
,
Waves in Fluids and Solids
216
[,,,]
T
FFF
FF
x
y
z
,
and
000
000
00 0
000
L
L
L
L
L
.
With the previous three definitions, in a homogeneous medium, we have the following
equation:
.
V
LV F
t
(8)
2.3 3D fourth-order RK algorithm
We suppose that equation (8) is a semi-discrete equation, on the right–hand side of which
the high-order spatial derivatives are explicitly approximated by the local interpolation
method (Yang et al., 2010). Under such an assumption, Equation (8) is converted to a system
of semi-discrete ODEs with respect to variable
V
, and can be solved by the fourth-order RK
method (formula (3)). In other words, we can apply formula (3) to solve the semi-discrete
ODEs (8) as follows
*2
2
,, ,, ,, ,,
11
,
24
nn n
ijk ijk ijk ijk
tt VV LV LV
(9a)
1* *2*
2
,, ,, ,, ,, ,, ,,
1 111
2.
3336
nn n
ijk ijk ijk ijk ijk ijk
ttt
VVV LV LV LV
(9b)
Where
,,
(,,,)
n
ijk
VVntix
jy
kz
and the differential operators can be written as
33 33 33 33
(,,,)
0000
,,, .
1111
0000
L DiagLLLL
IIII
Diag
DDDD
(10a)
2
2222
(,,,)
11111111
,,,,,,, .
LDiagLLLL
DiagDDDDDDDD
(10b)
From equation (9) and definitions of
L
and
2
L , we know that the calculations of
*
,,
ijk
V
and
1
,,
n
ijk
V
only involve in the second- and third-order spatial derivatives of the displacement U
A Fourth-Order Runge-Kutta Method
with Low Numerical Dispersion for Simulating 3D Wave Propagation
217
and the particle velocity W, so we can compute these derivatives using equations (A3)-(A7)
(see Appendix A).
3. Error analysis and stability conditions
In this section, we investigate the stability criteria and theoretical error of the two-stage RK
scheme, and compare the numerical error of the 3D RK with those of the second-order
conventional FD scheme and the fourth-order LWC method (Dablain, 1986) for the 3D
initially value problem of acoustic wave equation.
3.1 Stability conditions
In order to keep numerical calculation stable, we must consider how to choose the
appropriate time and the space grid sizes,
△t and h. As we know, mathematically, the
Courant number defined by
0
/cth
gives the relationship among the acoustic velocity
0
c
and the two grid sizes, we need to determine the range of
. Following the Fourier
analysis (Richtmyer & Morton, 1967; Yang
et al., 2006, 2010), after some mathematical
derivations (see Appendix B for detail), we obtain the stability conditions for solving 1D, 2D,
and 3D acoustic equation as follows:
1D case:
max
00
0.730
hh
t
cc
, (11)
2D case:
max
00
0.707
hh
t
cc
, (12)
3D case:
max
00
0.577
hh
t
cc
. (13)
Where,
max
is the maximum value of the Courant number, xh
for the 1D case,
xzh for the 2D case, and
xyzh
for the 3D case.
When the RK method is applied to solve the 3D elastic wave equations, we estimate that the
temporal grid size should satisfy the following stability condition,
max
max
0.577
h
tt
c
, (14)
where
max
t is the maximum temporal increment that keeps the 3D RK method stable and
max
c
is the maximum P-wave velocity.
The stability condition for a heterogeneous medium can not be directly determined, but it
could be approximated by using a local homogenization theory. Equations (11)-(14) are
approximately correct for a heterogeneous medium if the maximal values of the wave
velocities
0
c and
max
c are used.
3.2 Error
To better understand the 3D RK method, we investigate its accuracy both theoretically and
numerically, and we also compare it with the fourth-order LWC method (Dablain, 1986) and
the second-order conventional FD method (Kelly et al., 1976).
Waves in Fluids and Solids
218
3.2.1 Theoretical error
Using the Taylor series expansion, we find that the errors for the spatial derivatives
,,
(/ )
qlm
klmn
ijk
Uxyz
(2 3)qlm
are fourth order (i.e.
444
()Ox y z
), which
results from the local interpolation as formulated in equations (A3)-(A7) in Appendix A.
This conclusion is consistent with that given by Yang et al. (2007). Because the fourth-order
Runge-Kutta method is used to solve the ODEs in equation (8), the temporal error, caused
by the discretization of the temporal derivative, is in the order of
4
()Ot
. Therefore, we
conclude that the error introduced by the two-stage RK scheme (9) is in the order of
4444
()Ot x y z
. In other words, the 3D RK method suggested in this chapter has
fourth-order accuracy in both time and space.
3.2.2 Numerical errors
In order to investigate the numerical error of the two-stage RK method proposed in this
chapter, we consider the following 3D initial value problem:
222 2
22222
0
0
000
0
0
0000
0
1
,
2
(0, , , ) cos ( ) ,
2
(0, , , ) 2 sin ( ) ,
uuu u
xyzct
f
uxyz lxmznz
c
f
uxyz f lxmznz
tc
(15)
where c
0
is the velocity of the plane wave, f
0
is the frequency, and
000
(, , )lmn is the incident
direction at t=0.
Obviously, the analytical solution for the initial problem (15) is given by
0000
00 0
(, , , ) cos2 .
y
xz
utxyz f t l m n
cc c
(16)
For comparison, we also use the second-order FD method and the so-called LWC (fourth-
order compact scheme (Dablain, 1986)) to solve the initial problem (15).
In the first numerical example, we choose the number of grid points N = 100, the frequency
f
0
=15Hz, the wave velocity c
0
=2.5km/s, and
000
111
(, , )( , , )
333
lmn
. The relative error
(E
r
) is the ratio of the RMS of the residual (
,,
(, , ,))
n
jml n j m l
uutxyz and the RMS of the exact
solution
(, , ,)
njml
ut x y z
. Its explicit definition is as follows:
1
2
2
,,
2
111
111
1
(%) [ ( , , , )] 100.
[( , , , )]
NNN
n
rjmlnjml
NNN
jml
njml
jml
Euutxyz
ut x y z
(17)
A Fourth-Order Runge-Kutta Method
with Low Numerical Dispersion for Simulating 3D Wave Propagation
219
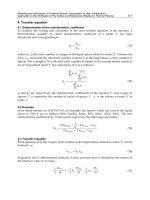
Fig. 1. The relative errors of the second-order FD, the fourth-order LWC, and the RK
methods measured by
E
r
(formula (17)) are shown in a semilog scale for the 3D initial-value
problem (15). The spatial and temporal step sizes are chosen by (a)
h=Δx=Δy=Δz=20m and
Δ
t=5×10
-4
s, (b) h=Δx=Δy=Δz=30m and Δt=8×10
-4
s, and (c) h=Δx=Δy=Δz=40m and Δt=1×10
-
3
s, respectively.
Figures 1(a)-(c) show the computational results of the relative error
E
r
at different times for
cases of different spatial and time increments, where three lines of
E
r
for the second-order
FD method (line —), the fourth-order LWC (line - - - -), and the RK (line ) are shown in a
semi-log scale. In these figures, the maximum relative errors for different cases are listed in
Table 1. From these error curves and Table 1 (
xyzh
), we find that E
r
increases
corresponding to the increase in the time and
/or spatial increments for all the three methods.
As Figure 1 illustrated, the two-stage RK has the highest numerical accuracy among all three
methods
3.3 Convergence order
In this subsection, we discuss the convergence order of the WRK method. In this case, we
similarly consider the 3D initial problem (15), and choose the computational domain as
01km,x
01km,y
01kmz
and the propagation time T =1.0 sec. The same
computational parameters are chosen as those used in subsection 3.2.2. In Table 2, we show
(a)
(b)
(c)
Waves in Fluids and Solids
220
Method 2
nd
-order FD 4
th
-order LWC RK
Case 1:
h=20 m
1.550 2.088 0.306
t=5
10
-4
s
Case 2
:
h=30 m
7.260 3.963 2.231
t=8
10
-4
s
Case 3
:
h=40 m
22.298 15.715 9.949
t=1
10
-3
s
Table 1. Comparisons of maximum relative errors of the three methods in three cases.
the numerical errors of the variable u. For the fixed spatial grid size h=Δx=Δy=Δz, the error
of the numerical solution u
h
with respect to the exact solution u is measured in the discrete
L
1
, L
2
norms
1
3
111
|(,,,) (,,,)| , 1,2
m
m
NNN
m
m
hhijkijk
L
L
ijk
Euu h uxyzTuxyzT m
(18)
h
1
L
E
2
L
E
1
L
O
2
L
O
5.000E-02 3.382E-02 5.948E-02 — —
4.000E-02 2.073E-02 3.317E-02 2.195 2.617
2.500E-02 3.903E-03 6.190E-03 3.552 3.572
2.000E-02 1.422E-03 2.150E-03 4.524 4.738
1.000E-02 4.298E-05 6.367E-05 5.049 5.078
Table 2. Numerical errors and convergence orders of the 3D two-stage RK method.
So if we choose two different spatial steps h
s-1
and h
s
for the same computational domain, we
can use (18) to get two L
k
errors
1
k
s
L
E
and
k
s
L
E . Then the orders of numerical convergence
can be defined by Dumbser et al. (2007)
11
lo
g
lo
g
,1,2.
k
k
k
s
s
L
ss
L
L
E
h
Ok
Eh
(19)
Table 2 shows the numerical errors and the convergence orders, measured by equations (18)
and (19), respectively. In Table 2 the first column shows the spatial increment h, and the
following four columns show L
1
and L
2
errors and their corresponding to convergence
orders
1
L
O and
2
L
O . From Table 2 we can find that the errors
1
L
E and
2
L
E decrease as the
spatial grid size
h decreases, which implies that the 3D two-order RK method is convergent.
4. Numerical dispersion and efficiency
As we all know, the numerical dispersion or grid dispersion, which is caused by
approximating the continuous wave equation by a discrete finite difference equation, is the
major artifact when we use finite difference schemes to model acoustic and elastic wave-
A Fourth-Order Runge-Kutta Method
with Low Numerical Dispersion for Simulating 3D Wave Propagation
221
fields, further resulting in the low computational efficiency of numerical methods. This
numerical artifact causes the phase speed to become a function of spatial and time
increments. The relative computational merit of most discretization schemes hinges on their
ability to minimize this effect. In this section, following the analysis methods presented in
Vichnevetsky (1979), Dablain (1986), and Yang et al. (2006), we investigate the dispersion
relation between grid dispersion and spatial steps with the RK and the computational
efficiencies for different numerical methods through numerical experiments. For
comparison, we also present the dispersion results of the fourth-order SG method (Moczo et
al., 2000).
4.1 Numerical dispersion
Following the dispersion analysis developed by Moczo et al. (2000) and and Yang et al.
(2006), we provide a detailed numerical dispersion analysis with the RK for the 3D case in
Appendix C, and compare it with the fourth-order SG method (Moczo et al., 2000). To check
the effect of wave-propagation direction on the numerical dispersion, we have chosen
different azimuths for two Courant numbers of 0.1
and 0.3.
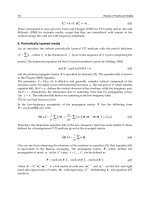
Figure 2 shows the dispersion relations as a function of the sampling rate
S
p
defined by
S
p
=h/λ (Moczo et al., 2000) with h being the grid spacing and λ the wavelength. The curves
correspond to different propagation directions. The results plotted in Figure 2(a) and 2(b)
are computed by the dispersion relation (C4) given in Appendix C with Courant numbers of
0.1 and 0.3, respectively. Figures 2 and 3 show that the maximum phase velocity error does
not exceed 11%, even if there are only 2 grid points per minimum wavelength (
S
p
=0.5). For a
sampling rate of
S
p
=0.2 the numerical velocity is very close to the actual phase velocity.
These Figures also shows that the dispersion curves differ for different propagation
directions.
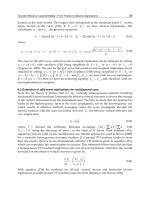
Figure 3 shows the numerical dispersion curves computed by 3D fourth-order SG using the
numerical relation (C5) given in Appendix C under the same condition. In contrast with the
curves in Figure 2 computed by the RK, the numerical dispersion as derived by the fourth-
order SG clearly changes for different propagation directions. It is very clear that the
Fig. 2. The dispersion relation of RK method for the Courant number (a)
0.1 and (b)
0.3, in which φ is the wave propagating angle to the z-axis, and δ is the propagating
angle of the wave projection in the
xy plane to the x-axis.
(a)
(b)
Waves in Fluids and Solids
222
Fig. 3. The dispersion relation of the fourth-order SG method (Moczo et al., 2000) for the
Courant number (a)
0.1 and (b)
0.3, in which φ is the wave propagating angle to the
z-axis, and δ is the propagating angle of the wave projection in the xy plane to the x-axis.
numerical dispersion computed by the fourth-order SG is more serious compared with
that of RK. For example, the maximum dispersion error calculated with the latter method
is less than 11% (Figure 2a), while the same error calculated with the former one is greater
than 26% (Figure 3a). To limit the dispersion error of the phase velocity under 8% (the
maximum dispersion error by RK shown in Figure 2a), about 3 grid points per minimum
wavelength are required when using fourth-order SG, opposite to only 2.1 grid points per
wavelength with RK. Meanwhile, from Figure 2(a) we can observe that the numerical
dispersion curves of the RK in different propagation directions are close to each other. It
means that the RK has small numerical dispersion anisotropy. In contrast, from Figure
3(a) and 3(b) we can see that the difference of numerical dispersion curves in different
propagation directions is very large, implying that the SG has larger numerical dispersion
anisotropy than that of the RK.
After comparing Figure 2 computed by the RK with Figure 3 computed by the SG, we
conclude that the RK offers smaller numerical dispersion than the SG for the same spatial
sampling increment. We will verify this conclusion later via new experiments.
4.2 Computational efficiency
In this subsection, we further investigate the numerical dispersion and computational
efficiency of the RK through wave-field modeling, and compare our method with the
fourth-order LWC (Dablain, 1986) and the fourth-order SG method. Under this case of our
consideration, we choose the following 3D acoustic wave equation
2 222
2
0
2222
()
u uuu
c
f
txyz
, (20)
where
c
0
is the acoustic velocity. In our present numerical experiment, we choose c
0
=4 km/s.
The computational domain is 0≤
x≤5 km, 0≤y≤5 km, and 0≤z≤5 km, and the number of grid
points is 200×200×200. The source is a Ricker wavelet with a peak frequency of
f
0
= 37 Hz.
The time variation of the source function is
(a)
(b)
A Fourth-Order Runge-Kutta Method
with Low Numerical Dispersion for Simulating 3D Wave Propagation
223
22 2
00 0
( ) 5.76 1 16(0.6 1) exp 8(0.6 1)ft f f f
(21)
The force-source included in equation (20) is located at the centre point of the computational
domain, and
∂f/∂x and ∂f/∂z are set to be zero in this example and other experiments in the
following section. The spatial and temporal increments are chosen by
h=Δx=Δy=Δz=25 m
and Δ
t=1.5×10
-3
s, respectively. The coarse spatial increment of h=25 m is chosen so that we
test the effects of sampling rate on the numerical dispersion. A receiver R is placed at the
grid point (
x
R
, y
R
, z
R
)=(3.575 km, 2.5 km, 2.5 km) to record the waveforms generated by three
methods.
Following Dablain’s definition (Dablain, 1986), we take the Nyquist frequency of the source
to be twice the dominant frequency in this study. The rule of thumb in numerical methods
for choosing an appropriate spatial step based on the Nyquist frequency can be written as
min
N
v
x
f
G
, (22)
where
min
v
denotes the minimum wave-velocity,
N
f
is the Nyquist frequency, and G
denotes the number of gridpoints needed to cover the Nyquist frequency for non-dispersive
propagation (Dablain, 1986). In this case chosen that implies a Nyquist frequency of 74 Hz
and the number of gridpoints at Nyquist is about 2.2 in our present numerical experiment.
Figures 4, 5, and 6 show the wave-field snapshots at
t=0.5 sec on a coarse grid of Δx=Δy=Δz=25
m (G≈2.2), generated by the RK (Fig. 6), the fourth-order LWC (Dablain, 1986) (Fig. 7), and the
fourth-order SG (Moczo et al., 2000) (Fig. 8), where Figures (a), (b), and (c) shown in these
Figures show the wave-field snapshots in the
xy, xz, and yz planes, respectively. Figures 7 and
8 show the wave-field snapshots at
t=0.5 sec for the same Courant number ( 0.24),
generated by the fourth-order LWC (Fig. 7) and the fourth-order SG (Fig. 8) on a fine grid
(Δ
x=Δy=Δz=8.3 m) so that the numerical dispersions caused by the fourth-order LWC and the
fourth-order SG are eliminated. We can see that the wavefronts of seismic waves shown in
Figures 4-6, simulated by the three methods, are nearly identical. However, the result
generated by the RK (Fig. 4) shows much less numerical dispersion even though the space
increment is very large, whereas the fourth-order LWC and the fourth-order SG suffer from
serious numerical dispersions (see Figs. 7, 8). Comparison between Figure 6 and Figures 7 and
8 demonstrates that the RK on a coarse grid can provide the similar accuracy as those of the
Fig. 4. Snapshots of acoustic wave fields at time 0.5 sec on the coarse grid (Δ
x=Δy=Δz=25m)
in the
xy (a), xz (b), and yz (c) planes, respectively, computed by the 3D RK method.
Waves in Fluids and Solids
224
Fig. 5. Snapshots of acoustic wave fields at time 0.5 sec on the coarse grid (Δ
x=Δy=Δz=25 m) in
the
xy (a), xz (b) and yz (c) planes, respectively, generated by the fourth-order LWC method.
fourth-order LWC and the fourth-order SG on a fine grid for the same Courant number. But
the computational cost of the RK is quite different from the other two methods. For
example, it took the RK about 15.3 min to generate Figure 4, whereas the fourth-order LWC
and the fourth-order SG took about 50.8 min and 50.6 min to generate Figure 5 and Figure 6,
respectively. This suggests that the computational speed of the RK is roughly 3.3 times of
the fourth-order LWC and the fourth-order SG to achieve the same accuracy. Thus we can
conclude the 3D RK can save the computational cost by using coarse grids to simulate wave
propagation in large scale models. The results in Figures 4-8 were computed on a parallel
computation with 40 processors and using the message passing interface (MPI).
Fig. 6. Snapshots of acoustic wave fields at time 0.5 sec on the coarse grid (Δ
x=Δy=Δz=25 m)
in the
xy (a), xz (b) and yz (c) planes, respectively, generated by the fourth-order SG method.
Fig. 7. Snapshots of acoustic wave fields at time 0.5 sec on the fine grid (Δ
x=Δy=Δz=8.3 m) in
the
xy (a), xz (b) and yz (c) planes, respectively, generated by the fourth-order LWC method.
A Fourth-Order Runge-Kutta Method
with Low Numerical Dispersion for Simulating 3D Wave Propagation
225
Fig. 8. Snapshots of acoustic wave fields at time 0.5 sec on the fine grid (Δ
x=Δy=Δz=8.3 m) in
the
xy (a), xz (b) and yz (c) planes, respectively, generated by the fourth-order SG method.
Fig. 9. Comparions of the analytic solution computed by the Cagniard–de Hoop method (de
Hoop, 1960) with waveforms generated by (a) the RK, (b) the fourth-order LWC, and (c) the
fourth-order SG, respectively.
Note that the memory required by RK is also different from those of the fourth-order
LWC and the fourth-order SG methods. The RK needs 20 arrays to hold the wave fields at
each time step, and the number of grid points for each array is 200×200×200 on a coarse
grid for generating Figure 4. Even though the fourth-order LWC needs only eight arrays
to store the wave displacement and the fourth-order SG needs nine arrays to store the
wave displacement and the stress at each grid point to generate a comparable result, the
two methods require much finer grid sampling. For example, the number of grid points of
each array for generating Figures 7 and 8 goes up to 600×600×600 for both the fourth-
order LWC and the fourth-order SG. Therefore, the overall memory required by the RK
takes only about 31.3% of that needed by the fourth-order LWC and about 27.8% of that of
the fourth-order SG.
Now we compare the accuracy of the waveforms at receiver R (3.575 km, 2.5 km, 2.5 km),
generated by the RK, the fourth-order LWC, and the fourth-order SG, respectively. Figure 9
shows the waveforms of the analytic solution (solid lines) computed by the Cagniard–de
Hoop method (Aki and Richards, 1980) and the numerical solutions (dashed line) computed
by three numerical methods on the coarse grid (Δx=Δy=Δz=25 m). Figure 9(a) shows that
the waveforms calculated by the 3D RK and the Cagniard-de Hoop method (solid line) are
in good overall agreement even on the coarse grid (Δx=Δy=Δz=25 m). In contrast, the results
in Figures 9(b) and 9(c), calculated by the fourth-order LWC and the SG methods,
(a)
(
b
)(c)
Waves in Fluids and Solids
226
respectively, show serious numerical dispersion following the peak wave as contrasted to
the analytic solution (solid line). It illustrates that the 3D two-stage RK is accurate in wave-
field modeling for the acoustic propagation modeling and it can provide very accurate
results even when coarse grids are chosen.
5. Wavefield modelling
In this section, we present the performance of the two-stage RK in the 3D acoustic and
elastic cases and compare against the so-called LWC method (Dablain 1986) through
wavefield modelling and synthetic seismograms. In particular, we use the RK to simulate
the acoustic and elastic waves propagating in the 3D multilayer acoustic medium, two-layer
elastic medium, and the transversely isotropic medium with a vertical symmetry axis (VTI).
5.1 Multilayer acoustic model
In this experiment, we consider a special multilayer isotropic medium model, shown in
Figure 10. Speaking in detail, when 0≤
y≤1.5 km, the model is consisted of three layer media
where the acoustic velocities are chosen by 2 km/s, 3 km/s, and 4 km/s, corresponding to
the top, middle and bottom layers, respectively, whereas the model is a two layer media
with acoustic velocities of 2 km/s and 3 km/s as 1.5 km<
y≤3 km. The computational
domain is 0≤
x≤3 km, 0≤y≤3 km, 0≤z ≤1.8 km. We choose the spatial incrementsΔx=Δy=Δz=15
m, the temporal increment Δ
t=0.8 ms. The source of the Ricker wavelet with a peak
frequency of
f
0
=30 Hz is located at coordinate (x
s
, y
s
, z
s
)=(1.5 km, 1.5 km, 0.015 km), and the
expression is the same as equation (21). The perfectly matched layer (PML) absorbing
boundary condition suggested by Dimitri and Jeroen (2003) is used in the experiment.
Figure 11, generated by the RK, shows the synthetic seismograms recorded by 201 receivers
on the surface spreading respectively along the two lines of
y=1.5 km (Fig. 11a) and x=1.5
km (Fig. 11b) shown in Figure 10. In Figure 11, the reflected waves from the inner interfaces
are very clear. We can identify the medium structure from the reflected curve wave shown
in Figure 11. In this experiment, we use the stiff boundary condition at the free surface
because the source is located at the surface. This experiment also illustrates that it is
efficient for the RK to combine with the PML absorbing boundary condition (Dimitri and
Jeroen, 2003).
Fig. 10. The geometry of the multilayer model, which is consisted of three layer media in the
domain of 0≤
y≤1.5 km, whereas the model is a two layer media as 1.5 km<y≤3 km.
A Fourth-Order Runge-Kutta Method
with Low Numerical Dispersion for Simulating 3D Wave Propagation
227
Figure 12 shows the synthetic VSP seismograms recorded in the wells, generated by the RK.
In Figure 14(a), the receivers are spread from receiver R
1
(x, y, z)= (1.8 km, 1.8 km, 0) to
receiver R
N
(x, y, z)= (1.8 km, 1.8 km, 1.8 km) spaced 0.015 km apart, and from receiver R
1
(x,
y, z)= (1.2 km, 1.2 km, 0) to receiver R
N
(x, y, z)= (1.2 km, 1.2 km, 1.8 km) in Figure 12(b).
From Figure 12 we can see that the VSP seismograms are very clean and have no grid
dispersions while the model velocity contrasts between adjacent layers (layers 1 and 2,
layers 2 and 3) are about 50% and 33%, respectively. We can also observe the difference of
two seismic records shown in Figure 12(a) and 12(b) from different wells.
Fig. 11. Synthetic seismograms recorded by 201 receivers on the surface spreading (a) from
x=0 to 3 km spaced 0.015 km apart along the line of y=1.5 km, and (b) from y=0 to 3 km
spaced 0.015 km apart along the line of
x=1.5 km, respectively generated by the RK for the
multilayer geological model shown in Figure 14.
Fig. 12. Synthetic VSP seismograms recorded by 121 receivers in wells spreading (a) from
receiver R
1
(x, y, z)= (1.8 km, 1.8 km, 0) to receiver R
N
(x, y, z)= (1.8 km, 1.8 km, 1.8 km) , and
(b) from receiver R
1
(x, y, z) =(1.2 km, 1.2 km, 0) to receiver R
N
(x, y, z) =(1.2 km, 1.2 km, 1.8
km).
5.2 Two-layered elastic wave modeling
Subsurface structures have interfaces where velocities and density are discontinuous, and
some of the interfaces may have strong velocity contrasts. Some FD methods, such as
(a)
(b)
Waves in Fluids and Solids
228
conventional FD (Kelly et al., 1976), LWC method (Dablain 1986), often suffer from serious
numerical dispersion when the models have large velocity contrast between adjacent layers.
So we consider a two-layer medium with inner interface to investigate the validity of the 3D
RK in multilayer elastic model. In the two-layer model, the Lamé constants are given as
λ
1
=1.5 GPa, μ
1
=2.5 GPa and ρ
1
=1.5g/cm
3
, λ
2
=11.0 GPa, μ
2
=15.0 GPa and ρ
2
=2.0g/cm
3
,
corresponding to the P- and S-wave velocities of 2.082 km/s and 1.291 km/s in the top layer
medium, and 4.528 km/s and 2.739 km/s in the bottom medium. The computational
domain is 0 4
xkm, 04y
km, and 0 4z
km. We choose the spatial increments
h=Δx=Δy=Δz=20 m and the temporal increment Δt=1.5 ms. The source of the Ricker wavelet
with a peak frequency of
0
20f
Hz is located at (,,)
sss
xyz
(2 km,2 km,1.92 km), and the
source function is the same as equation (21). The three force-source components,
corresponding to
f
1
, f
2
, and f
3
included in equation (4a), are chosen by f
1
=f
2
=f
3
=f(t). The
horizontal inner interface is located at the depth
z=2.4 km. In this experiment, we use
similarly the PML absorbing boundary condition presented in Dimitri and Jeroen (2003).
Fig. 13. Snapshots of the seismic wave fields at time 0.6 sec for the u
1
component in the two-
layer isotropic medium, generated by the RK, for (a) the
xy plane, (b) the xz plane, and (c)
the
yz plane.
Fig. 14. Snapshots of the seismic wave fields at time 0.6 sec for the u
2
component in the two-
layer isotropic medium, generated by the RK, for (a) the
xy plane, (b) the xz plane, and (c)
the
yz plane.
Figures 13-15 show the wavefield snapshots of the three displacement-components (
u
1
, u
2
, and
u
3
) at t =0.6 sec on the coarse increments (Δx=Δy=Δz=20 m) for the two-layer elastic model,
generated by the RK. Figures 16-17 and Figures 18-19 show the wavefield snapshots of the
horizontal and vertical displacement-components (
u
1
and u
3
) at t =0.6 sec for the same grid
(
a
)
(b)
(c)
(
a
)
(b)
(c)
A Fourth-Order Runge-Kutta Method
with Low Numerical Dispersion for Simulating 3D Wave Propagation
229
Fig. 15. Snapshots of the seismic wave fields at time 0.6 sec for the u
3
component in the two-
layer isotropic medium, generated by the RK, for (a) the
xy plane, (b) the xz plane, and (c)
the
yz plane.
Fig. 16. Snapshots of the seismic wave fields at time 0.6 sec for the u
1
component in the two-
layer isotropic medium, generated by the fourth-order LWC, for (a) the
xy plane, (b) the xz
plane, and (c) the
yz plane.
Fig. 17. Snapshots of the seismic wave fields at time 0.6 sec for the u
3
component in the two-
layer isotropic medium, generated by the fourth-order LWC, for (a) the
xy plane, (b) the xz
plane, and (c) the
yz plane.
(
a
)
(b)
(c)
(
a
)
(b)
(c)
(
a
)
(b)
(c)
Waves in Fluids and Solids
230
increments and same model, generated by the fourth-order LWC and fourth-order SG
methods, respectively. Four snapshots such as Figure 13(b) in the
xz plane for the u
1
component Figure 14(c) in the
yz plane for the u
2
component, and Figures 15(b) and 15(c) in
the
xz and yz planes for the u
3
component show numerous phases such as direct P wave,
direct
S wave, and their reflected, transmitted and converted phases from the inner
interface. In Figures 13(c), 14(b), and 15(a), the snapshots in the
yz, xz, and xy planes,
corresponding to three displacement-components
u
1
, u
2
, and u
3
, respectively, show a very
weak P wave and a strong S wave. The wavefield snapshots (Figs. 13-15) also show that the
RK has no visible numerical dispersions even if the space increment is chosen 20 m without
any additional treatments for the two-layer elastic model with a large velocity contrasts of
2.18 times between the top and bottom layer media, whereas the fourth-order LWC and the
fourth-order SG suffer from substantial numerical dispersion for the same computational
conditions (see Figs. 16-19).
Fig. 18. Snapshots of the seismic wave fields at time 0.6 sec for the u
1
component in the two-
layer isotropic medium, generated by the fourth-order SG, for (a) the
xy plane, (b) the xz
plane, and (c) the
yz plane.
Fig. 19. Snapshots of the seismic wave fields at time 0.6 sec for the u
3
component in the two-
layer isotropic medium, generated by the fourth-order SG, for (a) the
xy plane, (b) the xz
plane, and (c) the
yz plane.
5.3 VTI model
In order to investigate the performance of the RK method for the anisotropic case, we
simulate the elastic wave propagating in a 3D VTI medium. For this case we consider the
following wave equation:
(
a
)
(b)
(c)
(
a
)
(b)
(c)
A Fourth-Order Runge-Kutta Method
with Low Numerical Dispersion for Simulating 3D Wave Propagation
231
2
2222 2
3
1111 2
11 66 55 12 66 13 55 1
2222
2
2222 2
3
2222 1
66 22 44 12 66 23 44 2
2222
2222
3333
55 44 33
222
()()
()()
u
uuuu u
ccc cc cc
f
xy xz
txyz
u
uuuu u
ccc cc cc
f
xy yz
txyz
uuuu
ccc
txyz
22
12
13 55 23 44 3
2
()()
uu
cc cc
f
xz yz
(23)
In this experiment, the computational domain is 0 5
x
km, 05y
km, and 0 5zkm.
The elastic constants and the medium density included in equation (23) are c
11
=26.4 GPa,
c
33
=15.6 GPa, c
13
=6.11 GPa, c
44
=4.38 GPa, c
66
=6.84 GPa,
22 11
cc
,
23 13
cc
,
55 44
cc ,
12 11 66
2cc c , and ρ=2.17 g/cm
3
, respectively. The source with the peak frequency f
0
=17
Hz is located at the center of the computational domain as defined in equation (21). The
spatial and temporal increments are
25xyz
m and
3
1.0 10t
sec, respectively,
resulting in 3.3 grid points per minimum wavelength because the minimal
qS wave velocity
is 1.4207 km/sec from the elastic constants and the medium density.
Fig. 20. Snapshots of elastic wave fields at time 0.7 sec for the x direction displacement (
u
1
)
in the VTI medium, generated by the RK for (a) the
xy plane, (b) the xz plane, and (c) the yz
plane.
Fig. 21. Snapshots of elastic wave fields at time 0.7 sec for the y direction displacement (
u
2
)
in the VTI medium, generated by the RK for (a) the
xy plane, (b) the xz plane, and (c) the yz
plane.
(
a
)
(b)
(c)
(
a
)
(b)
(c)
Waves in Fluids and Solids
232
Fig. 22. Snapshots of elastic wave fields at time 0.7 sec for the z direction displacement (
u
3
)
in the VTI medium, generated by the RK for (a) the
xy plane, (b) the xz plane, and (c) the yz
plane.
The wave field snapshots for
u
1
, u
2
and u
3
components at time 0.7 sec are shown in Figures
20, 21, and 22. Figure 20 shows the snapshots of the
u
1
component in xy-, xz-, and yz-planes,
whereas Figures 21 and 22 show the snapshots of
2
u and
3
u components in the three planes.
The snapshots of the three displacement components in the
xy plane (transverse plane),
shown in Figures 20(a), 21(a), and 22(a), show that the wavefronts of
P and S waves are a
circle in the VTI medium, whereas other snapshots in Figures 20, 21, and 22 show that the
wavefronts of
P and S waves are an ellipse and the quasi-P (qP) and quasi-SV (qSV) waves
show the directional dependence on propagation velocity. The
qSV wavefronts have cusps
and triplications depending on the value of c
13
(Faria & Stoffa, 1994). Triplications can be
observed in the horizontal component
qSV wavefronts in the xz plane for the u
1
component
(Fig. 20b), in the
yz-plane for the u
2
component (Fig. 21c), and in the vertical component qSV
wavefronts shown in Figures 22(b) and 22(c), respectively. Furthermore, in the VTI medium
we can observe that the shear-wave splitting shows in Figures 20(b) and 21(c), and the
arrival times of quasi-
SH and qSV waves are different by comparing Figures 20(c) and 21(b)
with Figures 20(b), 21(c), 22(b), and 22(c).
6. Summary
The two-stage RK method for solving 3D acoustic and elastic wave equations in isotropic
and anisotropic media is developed via the four-stage fourth-order RK algorithm for solving
ordinary differential equations and the high-degree multivariable interpolation
approximation. In other words, the time derivatives are approximated via the two-stage
fourth-order RK and the high-order space derivatives are calculated using the multivariable
interpolation approximation. On the basis of such a structure, we have to first convert these
high-order time derivatives to the spatial derivatives, which is similar to the high-order FD
or so-called LWC methods (Lax and Wendroff, 1964; Dablain, 1986). However, the fourth-
order RK method in approximating the high-order spatial derivatives is different from these
high-order FD, LWC, and staggered-grid methods stated previously that only use the wave
displacement at some grid points to approximate the high-order spatial derivatives or
directly discretizing the original wave equation. This RK method uses simultaneously both
the wave displacement and its gradients to approximate the high-order derivatives [see
formulae (A3) to (A7)]. In other words, when determining these high-order spatial
derivatives included in equation (8) or equation (9), the RK method uses not only the values
(
a
)
(b)
(c)
A Fourth-Order Runge-Kutta Method
with Low Numerical Dispersion for Simulating 3D Wave Propagation
233
of the displacement U and the particle velocity W at the mesh point (i, j, k) and its
neighboring gridpoints [see equations (A3)–(A7)], but also the values of the gradients of the
displacement
U and particle velocity W. Based on such a structure, the two-stage RK retains
more wavefield information included in the displacement function, the particle velocity, and
their gradients. As a result, the new RK can effectively suppress the numerical dispersion
and source-generated noises caused by discretizing the wave equations when too-coarse
grids are used or models have large velocity contrast between adjacent layers, and has
higher spatial accuracy though the RK only uses a local difference operator that three
gridpoints are used in a spatial direction.
Numerical dispersion analysis in section 4.1 and wave-field modeling results confirm our
conclusion that the RK method has smaller numerical dispersion than the fourth-order LWC
and SG methods. At the same time, these numerical results also imply that simultaneously
using both the wave displacement, particle velocity, and their gradients to approximate the
high-order derivatives is important for decreasing the numerical dispersion caused by the
discretization of wave equations because the particle velocity and the gradients of both the
wave displacement and the particle velocity include important wave-field information. On
the other hand, using these connection relations such as equation (A2) and those omitted in
this chapter between the grid point (
i, j, k) and its neighboring nodes (i+p, j+q, k+r) (p, q, r=-1,
0, 1) keeps the continuity of gradients. The continuity and high accuracy (fourth-order
accuracy in space) of gradients improve automatically the continuity of the stresses that are
the linear combinations of gradients or the Hook sum, further resulting in the RK having
less numerical dispersion when models have strong interfaces between adjacent layers. It
suggests that we should consider the particle velocity and wave-gradient fields and the use
of connection relations such as equation (A2), and so on, as we design a new numerical
method to solve the 3D acoustic and elastic wave equations.
It appears that the CPU time of the two-stage RK is more than that of the fourth-order LWC
and the SG methods, but in fact, because this method yields less numerical dispersion than
both the LWC and SG methods, we can afford to increase the temporal increment through
using coarser spatial increments to achieve the same accuracy as those of the LWC and the
SG methods on a finer spatial grid with smaller time steps. Numerical computational results
show that the RK method can also effectively suppress the numerical dispersion and the
source-noise as the number of gridpoints in a minimum wavelength is about 3.3. Hence the
total CPU time of the RK will not be larger than those of the LWC and the SG methods. As
observed in our experiment, the computational speed of the RK is roughly 3.3 times of the
fourth-order LWC and the SG on a fine grid to achieve the same accuracy as that of the RK,
and the storage space required for the RK is only about 31.3% of the fourth-order LWC and
about 27.8% of the fourth-order SG, respectively.
In conclusion, the 3D RK method has the following properties: (1) it can suppress effectively
the numerical dispersion and source noise for practically coarse spatial and time steps; (2) it
provides extra wave-field information including the particle velocity field and their time
derivatives and spatial gradients, so the two-stage RK can be directly extended to solve the
two-phase porous wave equations that include the first-order time derivatives such as Biot’s
porous wave equations (Biot 1956a,b); (3) it can increase greatly the computational efficiency
and save storage space if larger spatial and temporal increments are used; (4) it only uses the
local difference operator to obtain the high-order spatial accuracy. We initiate possible, more
applications of the RK method in large-scale acoustic or seismic modeling, reverse time
migration, and inversion based on the acoustic-wave equation, despite the computation
time and memory requirements are the bottle-neck for their vast applications.
Waves in Fluids and Solids
234
7. Appendices
7.1 Appendix A: evaluation of high-order derivatives
In order to numerically solve equation (8), we need to compute the high-order spatial
derivatives
,,
(/ )
qlm q
lmn
ijk
Vxyz
(2 3)qlm
so that the time advancing of the 3D
RK equation (9) is implemented. To do this, following the local interpolation methods (Yang
et al., 2007, 2010), we introduce the local interpolation function of spatial increments
x , y ,
and
z in the x, y, and z directions as follows:
5
0
1
(,,) ( )
!
r
r
Gx
y
zx
y
zV
rx y z
, (A1)
which defines the interpolation relations between the grid point (
i, j, k) and its 26
neighboring nodes such as (
i, j, k+1), (i, j, k-1), (i, j+1, k+1), (i, j+1, k), (i, j+1, k-1), (i, j-1, k+1),
(
i, j-1, k), (i, j-1, k-1), (i+1, j, k+1), (i+1, j, k-1), (i+1, j+1, k+1), (i+1, j+1, k), (i+1, j+1, k-1), (i+1, j-
1, k+1), (i+1, j-1, k), (i+1, j-1, k-1), (i+1, j, k), (i-1, j, k+1), (i-1, j, k-1), (i-1, j+1, k+1), (i-1, j+1, k),
(
i-1, j+1, k-1), (i-1, j-1, k+1), (i-1, j-1, k), (i-1, j-1, k-1), and (i-1, j, k). For example, at the grid
point (
i-1, j-1, k), we have the following interpolation relations:
1, 1,
,,
, , 1, 1,
, , 1, 1,
, , 1, 1,
(,,0) ,
(,,0) ,
(,,0) ,
(,,0) .
n
n
ijk
ijk
nn
i
j
ki
j
k
nn
i
j
ki
j
k
nn
i
j
ki
j
k
Gxy V
Gxy V
xx
Gxy V
yy
Gxy V
zz
(A2)
Similarly, the rest 100 connection relations at other 25 neighboring nodes can be easily
written.
From the 104 relations, we have similar approximation formulae as in the cited reference
(Yang et al., 2010) to approximate the high-order spatial derivatives included in equation (8)
or equation (9). For convenience, we list these approximation formulae used in the 3D RK
method as follows
2
211
,,
22
,,
,,
21
,
2
()
n
n
n
gijk g g
i
j
k
ijk
VV
VEE
gg
gg
(A3)
2
11 11
,,
,,
,,
11 1 1 1 1 11
,,
11
22
1
,
4
n
n
n
gg ee
ijk
i
j
k
ijk
n
ge g e ge g e ijk
VVV
EE EE
ge g e e g
EE EE EE EEV
ge
(A4)
A Fourth-Order Runge-Kutta Method
with Low Numerical Dispersion for Simulating 3D Wave Propagation
235
3
11 1 1
,,
33 2
,,
,,
15 3
8
2( ) 2( )
n
n
n
ggijk g g
i
j
k
ijk
VV
EEV E IE
g
gg g
, (A5)
3
11 1 1 1 1 2
2
,,
,,
2
2
,,
11 1 1 1 1 11
,,
2
1111
,,
2
1
2
2
1
()
1
55
4( )
1
66 44 ,
4( )
n
n
ge g e g g e
i
j
k
ijk
n
e
ijk
n
g
e
g
e
g
e
g
ei
j
k
n
gg eeijk
VV
EE E E E E
ge g
ge
V
e
g
EE E E EE E E V
ge
EE EEV
ge
(A6)
3
11 1 1 1 1 11
,,
,,
11 11 11 11
,,
11 11 11 11
,,
11
1
4
1
4
1
4
1
4
n
n
yz yz yz yz
ijk
ijk
n
xz xz xz xz
ijk
n
xy x y xy x y
ijk
xy
VV
EE EE EE EE
xyz y z x
V
EE E E EE E E
xz y
V
EE E E EE E E
xy z
EE
xyz
1 111 111 111
,,
11 1 1 11 1 1 1 111
,,
1
.
4
n
zx
y
zx
y
zx
y
zi
j
k
n
x
y
zx
y
zx
y
zx
y
zi
j
k
E EEE EEE EEE V
EEE EEE EEE EEEV
xyz
(A7)
where , ,gxyz in formulae (A3) and (A5), and , , ,ge xyz
and ge
in equations (A4)
and (A6).
,,
n
ijk
V ,
,,
n
i
j
k
V
x
,
,,
n
i
j
k
V
y
,
,,
n
i
j
k
V
z
, and
,,
n
qlm
q
lm
i
j
k
V
xyz
denote
(, , , )Vi xj yk zn t
,
(, , , )Vi xj yk zn t
x
, (, , , )Vi xj yk zn t
y
,
(, , , )Vi xj yk zn t
z
,
and
(, , , )
qlm
q
lm
Vi xj yk zn t
xyz
, respectively. These notations
2
z
and
1
z
E
in equations
(A3) to (A7) are the second-order central difference operators and displacement operators in
the z-direction, which are defined by
2
,, ,, 1 ,, ,, 1
2
nn nn
z ijk ijk ijk ijk
VV VV
,
1
,, ,, 1
nn
zijk ijk
EV V
, and
1
,, ,, 1
nn
zijk ijk
EV V
.
Other operators such as
2
x
,
1
x
E ,
1
x
E
in the x-direction and
2
y
,
1
y
E ,
1
y
E
in the y-direction are
defined similarly.
Waves in Fluids and Solids
236
7.2 Appendix B: derivation of stability criteria
For the 3D homogeneous case, to obtain the stability condition of the two-stage RK method
under the condition of
xyzh
, we consider the 3D acoustic wave equation.
Substituting the following solution
,,
123
exp ( )
n
n
x
jlq
y
z
V
V
Vikjhklhkqh
V
V
(B1)
into the 3D RK method (9) together with relations (A3)-(A7), we can obtain the following
equation
1nn
VGV
. (B2)
In equation (B1), k
1
, k
2
and k
3
are the components of the wave-number k=(k
1
, k
2
, k
3
)
T
and G is
the growth matrix, whose detail expression is omitted because of its complex elements.
We assume that λ
1
, λ
2
, …, and λ
p
are the eigenvalues of G. We know that the scheme with the
growth matrix G is stable only if
| | 1, 1,2, ,
j
jp
are satisfied. From which, we can
obtain the stability criterion of the RK method for the 3D homogeneous case as follows
max
0.577,
(B3)
where
max
denotes the maximum value of the Courant number defined by
0
/,ct x
with the acoustic velocity being
0
c
.
Similarly, we can easily obtain the stability criteria (11) and (12) for the 1D and 2D cases.
7.3 Appendix C: derivation of the dispersion relation
To investigate and optimize the dispersion error, we derive the dispersion relation of the 3D
RK method. For this, following the analysis methods presented in Dablain (1986) and Yang
et al. (2006), we substitute the harmonic solution
0
,,
123
exp( ( ) exp ( )
n
jlq
VV in ikjhklhkqh
(C1)
into the 3D RK equation (9), we can obtain the following linear equations about
0
V
00
exp( ( )in V GV
, (C2)
where
00000
(, , , )
T
xyz
VVVVV , ω is the angular frequency, and G is also the growth
matrix. From (C2), we can obtain the following dispersion equation:
[exp( ( ) ] 0.Det i n I G
(C3)
Using the dispersion relation (C3), we obtain the ratio of the numerical velocity
num
c to the
phase velocity
0
c as follows
A Fourth-Order Runge-Kutta Method
with Low Numerical Dispersion for Simulating 3D Wave Propagation
237
0
,
22
num
pp
c
R
cSS
(C4)
where is the Courant number,
//2
p
num num
Sh h c
is the spatial sampling ratio,
and
satisfies the dispersion equation (C3).
For comparison, here we also present the dispersion relation of the fourth-order staggered-
grid (SG) scheme (Moczo et al., 2000). Using the definition of the spatial sampling ratio S
p
and the Courant number
, we can obtain the following dispersion relation of the SG
method through a series of derivation:
222
123
0
arcsin
,
2
num
pp
xxx
c
R
cS S
(C5)
where
91
sin sin 3 , 1,2,3
824
ii i
xi
,
1
cos sin
p
S
,
2
sin sin
p
S
,
3
cos
p
S
,
in which 0 , and 0 2
.
8. Acknowledgments
The authors acknowledge support provided by the National Science Fund for Distinguished
Young Scholars of China (Grant No. 40725012). They also express their gratitude to other
members of the Computational Geophysics Laboratory for their support.
9. References
Aki, K. & Richards, P. G. (1980). Quantitative Seismology: Theory and Methods, W.H. Freeman
& Co., ISBN 0-935702-96-2, San Francisco, CA.
Biot, M. A. (1956a). Theory of propagation of elastic waves in a fluid-saturated porous solid,
Ⅰ. Low-frequency range, J. Acoust. Soc. Amer., Vol. 28, No. 2, pp. 168-178. ISSN
0001-4966
Biot, M. A. (1956b). Theory of propagation of elastic waves in a fluid-saturated porous
solid,
Ⅱ. Higher-frequency range. J. Acoust. Soc. Amer., Vol. 28, No. 2, pp. 179-191.
ISSN 0001-4966
Blanch, J. O. & Robertsson, J. O. A. (1997). A modified Lax-Wendroff correction for wave
propagation in media described by Zener elements,
Geophys. J. Int., Vol. 131, No. 2,
(November 1997), pp. 381-386, ISSN 0956-540X
Waves in Fluids and Solids
238
Booth, D. C. & Crampin, S. (1983). The anisotropic reflectivity technique: anomalous arrives
from an anisotropic upper mantle,
Geophys. J. R. astr. Soc., Vol. 72, No. 3, (March
1983), pp. 767-782, ISSN 0016-8009
Carcione, J. M. (1996). Wave propagation in anisotropic, saturated porous media: plane
wave theory and numerical simulation,
J. Acoust. Soc. Amer., Vol. 99, No. 5, (May
1996), pp. 2655-2666, ISSN 0001-4966
Carcione, J. M. & Helle, H. B. (1999). Numerical solution of the poroviscoelastic wave
equation on a staggered mesh,
J. Comput. Phys., Vol. 154, No. 2, (September 1999),
pp. 520-527. ISSN 0021-9991
Carcione, J. M., S. Valle, S. & Lenzi, G. (1999). GPR modelling by the Fourier method:
improvement of the algorithm,
Geophys. Prospect., Vol. 47, No. 6, pp. 1015-1029,
ISSN 0016-8025
Chen, X. F. (1993). A systematic and efficient method of computing normal modes for multi-
layered half-space,
Geophys. J. Int., Vol. 115, No. 2, (November 1993), pp. 391-409,
ISSN 0956-540X
Dablain, M.A. (1986), The application of high-order differencing to the scalar wave equation:
Geophysics, Vol. 51, No. 1, (January 1986), pp. 54-66, ISSN 0016-8033
de Hoop, A.T. (1960). A modification of Cagniard’s method for solving seismic pulse
problems,
Appl. Sci. Res., Vol. 8(B), No. 1, pp. 349–356, ISSN 0365-7140
Dimitri, K. & Jeroen, T. (2003). A perfectly matched layer absorbing boundary condition for
the second-order seismic wave equation,
Geophys. J. Int., Vol. 154, No. 1, (June
2003), pp. 146–153, ISSN 0956-540X
Dumbser, M., Käser, M. & Toro, E. F. (2007). An arbitrary high-order Discontinuous
Galerkin method for elastic waves on unstructured meshes – V. Local time stepping
and p-adaptivity,
Geophys. J. Int., Vol. 171, No. 2, (November 2007), pp. 695-717,
ISSN 0956-540X
Faria, E. L. & Stoffa P. L. (1994). Traveltime computation in transversely isotropic media,
Geophysics, Vol. 59, No. 2, (February 1994), pp. 272-281, ISSN 0016-8033
Fei, T. & Larner, K. (1995). Elimination of numerical dispersion in finite difference modeling
and migration by flux-corrected transport,
Geophysics, Vol. 60, No. 6, (November-
December 1995), pp. 1830–1842, ISSN 0016-8033
Fornberg, B. (1990). High-order finite differences and pseudo-spectral method on staggered
grids,
SIAM J. Numer. Anal., Vol. 27, No. 4, (August 1990) pp. 904-918, ISSN 0036-
1429
Holberg, O. (1987). Computational aspects of the choice of operator and sampling interval
for numerical differentiation in large-scale simulation of wave phenomena,
Geophysical Prospecting, Vol. 35, No. 6, (July 1987), pp. 629-655, ISSN 0016-8025
Igel, H., Mora, P. & Riollet, B. (1995). Anisotropic wave propagation through finite-
difference grids,
Geophysics, Vol. 60, No. 4, (July-August 1995), pp. 1203-1216, ISSN
0016-8033
Kelly, K., Ward, R., Treitel, S. & Alford, R. (1976). Synthetic seismograms: A finite-difference
approach,
Geophysics, Vol. 41, No. 1, (February 1976), pp. 2–27, ISSN 0016-8033
Kondoh, Y., Hosaka, Y. & Ishii, K. (1994). Kernel optimum nearly-analytical discretization
algorithm applied to parabolic and hyperbolic equations,
Computers Math. Appl.,
Vol. 27(3), No. 3, (Feburay 1994), pp. 59–90, ISSN 0898-1221