Advanced Biomedical Engineering Part 10 ppt
Bạn đang xem bản rút gọn của tài liệu. Xem và tải ngay bản đầy đủ của tài liệu tại đây (949.75 KB, 20 trang )
Semiconductor II-VI Quantum Dots with Interface States and Their Biomedical Applications
171
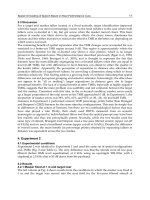
Fig. 26. Raman spectra of nonconjugated (a) and bioconjugated (b) 565 nm CdSe/ZnS QDs
(Vega Macotela et al., 2010b).
In nonconjugated CdSe/ZnS QD samples (605N and 565N) in the range 1050-4000 cm
-1
a set of Raman peaks at 1214, 1273, 1326, 1347, 1413, 1457, 1613, 1661 cm
-1
and 2149-2430,
2752, 2880, 2939, 3061 and 3317-3380 cm
-1
have been detected as well (Fig. 27 and Fig. 28).
These Raman peaks and the small intensity Raman peaks revealed in Fig. 25a (837, 860,
1011 and 1039 cm-
1
) can be assigned to the vibrations of different groups of atoms in the
organic amine (NH
2
)-derivatized PEG polymer [OH-(CH
2
-CH
2
-O)
n
-H] covered the QD
surface.
There are: 837, 860 and 1661 cm
-1
– PEG skeleton vibrations (Kozielski et al., 2004), 1011
and 1039 cm
-1
– stretching vibrations of COH groups, 1214, 1273, 1413 and 1457 cm
-1
stretching
vibrations of C-H bounds and deformation vibrations of C-H at 1326 and 1347 cm
-1
(Kozielski et al., 2004; Nakamoto 1997), 1613 cm
-1
- stretching vibrations of C=C bounds and
2149-2430 cm
-1
- stretching vibrations of CO or C-N groups (Nakamoto, 1997), symmetric
and anti-symmetric stretching vibrations of CH, CH
2
or CH
3
groups (2752, 2880, 2939 and
3061 cm
-1
), as well as the stretching vibrations of (O-H) and (NH
2
) groups at 3317-3380 cm
-1
.
To confirm that mentioned peaks related to PEG polymers, the QDs without PEG polymer
have been studied as well, and, actually, these peaks have been not observed in Raman
spectrum.
The intensity enhancement of Raman lines related to the Si acoustic and optical phonons in
the bioconjugated QD samples can be attributed to the surface enhanced Raman scattering
(SERS) effect (Aroca et al., 2004; Torchynska et al., 2007, 2008, 2009a). The surface electric
field enhancement due to the realization of resonance conditions for the plasmon-, phonon-
or exciton-polariton resonances is the known effect in nanocrystals of polar materials
(Anderson, 2005). The stimulation of optical field near the interface of illuminated
bioconjugated QDs and Si substrate leads to increasing dramatically the intensity of Si
Raman lines and in some cases the CdSe core and ZnS shell Raman lines. This fact indicates
that the anti IL10 and anti PSA antibodies are characterized by the
dipole moments that
Advanced Biomedical Engineering
172
permits them to interact with an electric field of excitation light at the Si surface and to
participate in the SERS effect (Torchynska et al., 2007, 2008, 2009a).
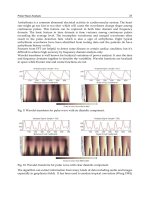
Fig. 27. Raman spectra of nonconjugated (a) and bioconjugated (b) 605 nm CdSe/ZnS QDs
in the range of Raman shift related to the PEG polymer (Diaz Cano et al., 2010).
Fig. 28. Raman spectra of nonconjugated (a) and bioconjugated (b) 565 nm CdSe/ZnS QDs
in the range related to the PEG polymer (Vega Macotela et al., 2010b).
Semiconductor II-VI Quantum Dots with Interface States and Their Biomedical Applications
173
The Raman line intensities of the peaks related to PEG polymer are smaller in
nonconjugated 565 nm QD samples and a little bit increase in bioconjugated 565 nm QD
samples (Fig. 28). In contrary the Raman line intensities of the peaks related to PEG polymer
are high in nonconjugated 605 nm QD samples and decrease in bioconjugated 605 nm QD
samples (Fig. 27). The last fact can indicate on scattering light re-absorption in anti IL-10
antibodies or on other resonance conditions for the vibrations of PEG atomic groups in these
samples.
11. Conclusion
Thirteen years passed after the first demonstration of cell labelling experiments with
colloidal quantum dots. Nowadays colloidal quantum dots are used to address a set of
specific biological questions, as well as the numbers of medical applications, that plays an
important role in basic life science. Although semiconductor QDs are unlikely to completely
replace traditional organic fluorophores, QDs have secured their place as a viable
technology in the biological and medical sciences. Their capability for single molecule and
multiplexed detection, real-time imaging and biological compatibility, important for drug
delivery and photo resonance therapy, makes II-VI material QDs a valuable technology in
the scientific toolbox. Additionally II-VI QDs with interface states presented in this chapter
permit to spread the experimental possibilities of the biological arsenal.
The work was partially supported by CONACYT Mexico (projects 000000000131184 and
00000000130387), as well as by the SIP-IPN, Mexico.
12. References
Aldana, J., Wang, Y.A., Peng, X.G. (2001). Photochemical Instability oof CdSe Nanocrystals
Coated by Hydrophilic Thiols. J. Am. Chem. Soc., Vol. 123, 8844-8850.
Alivisatos, A.P., Harris, D., Carroll, J., Steigerwald, M.L., Brus, L. (1989). Electrochemical
Synthesis and Laser Induced Time Resolved Photoluminescence of CdSe/ZnS
Quantum Dots. Chem. Phys., Vol. 90, pp. 3463-3470.
Alivisatos, A.P. (1996). Semiconductor Clusters, Nanocrystals and Quantum Dots. Science,
Vol. 271, pp. 933-937.
Anderson, M.S. (2005). Surface Enhanced Infrared Absorption by Coulping Phonon and
Plasma Resonance. Appl. Phys. Lett., Vol. 87, 144102.
Antibodies (2009).
Aroca, R.F., Ross, D.J., Domingo, C. (2004). Surface-Enhanced Infrared Spectroscopy. Appl.
Spectrosc., Vol. 58, pp. 324A-338A.
Bailey, R.E., Smith, A.M., Nie, Sh. (2004). Quantum Dots in Biology and Medicine. Physica E,
Vol. 25, pp. 1-12.
Baranov, A.V., Rakovich, Yu.P., Donegan, J.F., Perova, T.S., Moore, R.A., Talapin D.V.,
Rogach, A.L., Masumoto, Y., Nabiev, I. (2003). Effect of ZnS Shell Thickness on the
Phonon Spectra in CdSe Quantum Dots. Phys.Rev. B, Vol. 68, 165306.
Biju, V., Makita, Y., Nagase, T., Yamaoka ,Y., Yokoyama, H., Baba Y., Ishikawa, H. (2005a).
Subsecond Luminescence Intensity Fluctuations of Single CdSe Quantum Dot. J
Phys Chem B. Vol. 109, pp. 14350-14355.
Advanced Biomedical Engineering
174
Biju, V., Makita, Y., Sonoda, A., Yokoyama, H,. Baba, Y., Ishikawa, M. (2005b). Temperature-
sensitive photoluminescence of CdSe quantum dot clusters. J Phys Chem B, Vol. 109,
pp. 13899–13905.
Borkovska, L.V., Korsunska, N.E., Kryshtab, T.G., Germash, L.P., Pecherska, E.Yu ,
Ostapenko, S., and Chornokur, G. (2009). Semiconductors, 43, 775 (2009).
Brigger, I., Dubernet, C., Couvreur, P. (2002). Nanoparticles in Cancer Therapy and
Diagnosis. Adv. Drug Deliv Rev., Vol. 54, pp.631-651.
Bruchez M, Moronne M, Gin P, Weiss S, Alivisatos AP. (1998). Science, Vol. 281, pp. 2013–
2016.
Calvo P, RemunanLopez C, VilaJato JL, Alonso MJ. J Appl Polym Sci 1997;63:125–32.
Choi, S H., Song, H., Park, I.K., Yum, J H., Kim, S S., Lee, S. and Sung, Y E. (2006).
Synthesis of Size-Controlled CdSe Quantum Dots and Characterization of CdSe-
conjugated Polymer Blends for Hybrid Solar Cells.
Chin, I.L., Abraham, K.J., Chao Kang Chang, Yu Der Lee. (2004). Synthesis and
Photoluminescence Study of Molecularly I mprinted Polymers Appended onto
CdSe/ZnS Core-Shell. Biosensors and Bioelectronics, Vol. 20, pp. 127–131.
Chan, W.C.W., Nie, S. (1998). Science, Vol. 281, pp.2016-2018.
Clapp, A.R., Medintz, I.L., Mauro, J.M., Fisher, Br.R., Bawendi, M.G. and Mattoussi, H.
(2004). Fluorescence Resonance Energy Transfer between Quantum Dot Donors
and Dye-Labeled Protein Acceptors. J. AM. Chem. Soc. Vol. 126, pp. 301-310.
Cordero, S.R., Carson, P.J., Estabrook, R.A., Strouse, G.F., & Buratto, S.K. (2000). J. Phys.
Chem. B 104, 12137 (2000).
Crouch, D., Norager, S., O’Brien, P., Park, J.H. and Pickett, N. (2003). New synthetic routes
for quantum dots. Phil. Trans. R. Soc. A, Vol. 361, pp. 297-310.
Dabbousi, B.O., Rodriguez-Viejo, J., Mikulec, F.V., Heine, J.R., Mattoussi, H., Ober, R.,
Jensen, K.F., Bawendi, M.G. (1997). (CdSe)ZnS Core-Shell Quantum Dots: Synthesis
and Characterization of a Size Series of Highly Luminescent Nanocrystallites. J.
Phys. Chem. B, Vol.101 pp. 9463-9475.
Danek, M., Jensen, K.F., Murray, C.B. and Bawendi, M.G. (1994). Preparation of II–VI
quantum dot composites by electrospray organometallic chemical vapor
deposition. J. Crys. Growth, Vol. 145, pp. 714-720.
Darbandi, M., Thomann, R., Nann, T. (2005). Single Quantum Dots in Silica Spheres by
Microemulsion Synthesis. Chem. Mater., Vol. 17 pp. 5720-5725.
Diaz Cano, A., Jiménez Sandoval S., Vorobiev, Y., Rodriguez Melgarejo, F.
and Torchynska,
T.V. (2010). Peculiarities of Raman scattering in bioconjugated CdSe/ZnS quantum
dots, Nanotechnology, Vol. 21, 134016.
Dinger, A., Hetterich, M., Goppert, M., Grun, M., Weise, B., Liang, J., Wagner, V., Geurts, J.
(1999). J. Cryst. Growth Vol. 200, pp. 391-397.
Dubertret, B., Skourides, P., Norris, D.J., Noireaux, V., Brivanlou, A.H. (2002). In Vivo
Imaging of Quantum Dots Encapsulated ij Phospholipid Micelles. Science, Vol. 298,
pp. 1759-1762.
Dubertret, J.K., Mattoussi, H., Mauro, J.M., Simon, S.M. (2003). Long-term multiple color
imaging of live cells using quantum dot bioconjugates. Nat Biotechnol., Vol. 21, pp.
47-51.
Semiconductor II-VI Quantum Dots with Interface States and Their Biomedical Applications
175
Dybiec, M., Chomokur, G., Ostapenko, S., Wolcott, A., Zhang, J.Z., Zajac, A., Phelan, C.,
Sellers, T., Gerion, G. (2007). Photoluminescence Spectroscopy of Bioconjugated
CdSe/ZnS Quantum Dots. Appl. Phys. Lett. Vol. 90, No. 26, 263112.
Dzhagan, V.M., Valakh, M.Ya., A E Raevskaya, A.E., Stroyuk, A.L., S Ya Kuchmiy, S.Ya. and
D R T Zahn, D.R.T. (2007). Nanotechnology Vol. 18, 285701.
Dzhagan, V.M., Valakh, M.Ya., Raevskaya, A.E., .L. Stroyuk, A.L., Kuchmiy, S.Ya., D.R.T.
Zahn, D.R.T. (2008). Appl. Surf. Sci., Vol. 255, pp.725–727.
Ebenstein, Y., Mokari, T., Banin, U. (2004). Quantum-Dot-Functionalized Scanning Probes
for Fluorescence-Energy-Transfer-Based Microscopy. J. Phys. Chem. B., Vol. 108, pp.
93-99.
Eisler H.J.; Sundar V.C.; Bawendi M.G.; Walsh M.; Smith H.I.; Klimov V.I. (2002). Color-
selective Semiconductor Nanocrystal Laser. Appl. Phys. Lett. Vol. 80, No. 24, pp.
4614-4616.
Efros, Al.L., Rosen, M., Kuno, M., Nirmal, M., Norris, D.J., and M. Bawendi, M. (1996).
Band-edge Exciton in Quantum Dots of Semiconductors With a Degenerate Valence
Band. Phys. Rev. B, Vol. 54, No. 7, 4843.
Éfros, Al.L., Éfros, A.L. (1982). Interband absorption of light in a semiconductor sphere. Sov.
Phys. Semicond., Vol.16(7), pp. 772-775.
Esparza-Ponce, H., Hernández-Borja, J., Reyes-Rojas, A., Cervantes-Sánchez, M., Vorobiev,
Y.V., Ramirez-Bon, R., Pérez-Robles, J.F., González-Hernández, J. (2009). Growth
technology, X-ray and optical properties of CdSe thin films. Materials Chemistry and
Physics, Vol. 113, pp. 824-828
Gao, X.H., Cui, Y.Y., Levenson,R.M., Chung, L.W.K., Nie S.M. (2004). In Vivo Cancer
Targeting with Semiconductor Quantum Dots. Nat Biotechnol, Vol. 22, pp. 969-976.
Gaponenko, S.V. (1998). Optical Properties of Semiconductor Nanocrystals, Cambridge
University Press, ISBN 0-521-58241-5, Cambridge.
Gerion, D., Pinaud, F., Williams, Sh.C., Parak, W.J., Zanchet, D., Weiss, Sh. and Alivisatos,
A.P. (2001). Synthesis and Properties of Biocompatible Water-Soluble Silica-Coated
CdSe/ZnS Semiconductor Quantum Dots. J. Phys. Chem. B, Vol. 105, pp. 8861-8871 .
Gerion, D., Parak, W.J., Williams, S.C., Zanchet, D., Micheel, C.M., Alivisatos, A.P. (2002).
Sorting Fluorescent Nanocrystals with DNA. J Am Chem Soc., Vol. 124, pp. 7070-
7074.
Grodzinski, P., Silver, M., Molnar, L.K. (2006). Nanotechnology for Cancer Diagnostics:
Promises and Challenges. Expert Rev. Mol. Diagn., Vol. 6, No. 6, pp. 307-318.
Guo, W., Jack Li, J., Wang, J.A., Peng, X. (2003). Conjugation Chemistry and Bioapplications
of Semiconductor Box Nanocrystals Prepared via Dendrimer Bridging. Chem.
Mater., Vol. 15, pp. 3125-3133.
Gao, X.H., Gui, Y.Y., Levenson, R.M., Chung, L.W.K., Nie, S.M. (2004). In Vivo Cancer
Targeting and Imaging with Semiconductor Quantum Dots. Nature Biotechnol., Vol.
22(8), pp. 969-976.
Greenham, N.C., Peng, X., Alivisatos, A.P. (1997). Charge Separation and transport in
conjugated polymer/cadmium selenide nanocrystal composites studied by
photoluminescence quenching and photoconductivity. Synthetic Metals
1997, Vol.
84, pp. 545-546.
Ferrari, M. (2005). Cancer Nanotechnology: Opportunities and Challenges. Nature Reviews,
Vol. 5, pp. 161-171.
Advanced Biomedical Engineering
176
Fogg, D.E., Radzilowski, L.H., Dabbousi, B.O., Schrock, R.R.;, Thomas E.L., Bawendi, M.G.
(1997). Fabrication of Quantum Dots/Polymer Composites. Macromolecules 1997,
Vol. 30, pp. 8433-8439.
Hai, L.B., Nghia, N.X., Nga, P.T., Manh, D.H., Hanh, V.T.H. and Trang, N.T.T. (2009).
Influence of Cd:Se Precursor Ratio on Optical Properties of Colloidal CdSe
Tetrapods Prepared in Octadecene. J. Phys: Conf. Ser., Vol. 187, 012027.
Han, M.Y., Gao, X.H., Su, J.Z., Nie, S. (2001). Quantum-Dot-Tagged Microbeads for
Multiplexed Optical Coding of Biomolecules. Nat. Biotechnol, Vol. 19, pp. 631-635.
Hanaki, K., Momo, A., Oku, T., Komoto, A., Maenosono, S., Yamaguchi, Y., Yamamoto, K.
(2003). Semiconductor quantum dot/albumin complex is a long-life and highly
photostable endosome marker. Biochem Biophys Res Commun, Vol. 302, pp. 496-501.
Haus, J.W., Zhou, H.S., Honma, Komiyama, J.H. (1993). Phys. Rev. B, Vol. 47, pp. 1359-1365,
1993.
Heine, J.R., Rodriguez-Viejo, J., Bawendi, M.G. and Jensen, K.F. (1998). Synthesis of CdSe
quantum dot ZnS matrix thin films via electrospray organometallic chemical vapor
deposition. J. Cryst. Growth, Vol. 195, pp. 564-568.
Hines, M.A., Guyot-Sionnest, P. (1996). Synthesis and Characterization of Strongly
Luminescing ZnS-Capped CdSe Nanocrystals J. Phys. Chem., Vol. 100, pp. 468-471.
Hwang, Y.N., Park, S.H., Kim, D. (1999). Size-dependent Surface Phonon Mode of
CdSe Quantum Dots. Phys. Rev.B, Vol. 59, 7285.
Hwang, Y.N., Park, S.H., Kim, D. (1999). Size-dependent Surface Phonon Mode of CdSe
Quantum Dots. Phys. Rev.B, Vol. 59, 7285.
Hong-Mei Gong & Zhang-Kai Zhou & Hao Song & Zhong-Hua Hao & Jun-Bo Han & Yue-
Ying Zhai & Si Xiao & Qu-Quan Wang, J Fluoresc (2007) 17:715–720.
Hoener, C. F.; Allan, K. A.; Bard, A. J.; Campion, A.; Fox, M. A. Mallouk, T. E.; Webber, S. E.;
White, J. M. J. Phys. Chem. 1992, 96, 3812.
Hoshino, A., Manabe, N., Fujioka, K., Suzuki, K., Yasuhara, M. and Yamamoto, K. (2007).
Use of Fluorescent Quantum Dots Bioconjugates for Cellular Imaging of Immune
Cells, Cell Organelle Labeling, and Nanomedicine: Surface Modification Regulates
Biological Function, Including Cytotoxicity. J. Artif. Organs, Vol. 10, No. 3, pp. 149-
157.
Huang DBPPV-CdSe-ZnS Quantum-Dot Light-Emitting Diodes. IEEE Photonics Technol.
Lett., Vol, C.Y., Su, Y K., Wen, T C., Guo, T F., and Tu, M L. (2008). Single-
Layered Hybrid. 20, No. 4, pp. 282-284.
Huynh, W.U., Peng, X., Alivisatos, A.P. (1999). Preparation and Characterization of CdSe
Nanoparticles Prepared by Using Ultrasonic Irradiation. Adv. Mater., Vol. 11, pp.
923-938.
Huynh, W.U., Dittmer, J.J., Alivisatos, A.P. (2002). Hybrid Polymer-Nanorod Solar Cell.
Science, Vol. 295, No. 5564, pp. 2425-2427.
Invitrogen – a Provider of Essential Life Science Technologies (2010).
Jaiswal J.K.; Mattoussi H.; Mauro J.M.; Simon S.M. Nature Biotechnol. 2003,21, 47.
Jamieson, T., Bakhshi, R., Petrova, D., Pocock, R., Imani, M., Seifalian, A.M. (2007). Biological
Applications of Quantum Dots. Biomaterials Vol. 28, pp. 4717-4728.
Semiconductor II-VI Quantum Dots with Interface States and Their Biomedical Applications
177
Ji, X., Zheng, J., Xu, J., Rastogi, V.K., Cheng, T.Ch., DeFrank, J.J. and Leblanc, R.M. (2005).
(CdSe)ZnS Quantum Dots and Organophosphorus Hydrolase Bioconjugate as
Biosensor for Detection of Paraoxon. J. Phys. Chem. B, Vol. 109, pp. 3793-3799.
Johnson, F.A., and Loudon, R. (1964). Proc. Roy. Soc. A, Vol. 281, 274-277.
Kim, S., Fisher, B., Eisler, H J., Bawendi, M. (2003). Type-II quantum dots:
Te/CdSe(core/shell) and CdSe/ZnTe(core/shell) heterostructures. J Am Chem Soc
Vol. 125, pp. 11466–11567.
Kim, S., Bawendi, M.G. (2003). Oligomeric Ligands for Luminescent and Stable Nanocrystal
Quantum Dots. J Am Chem Soc, Vol. 125, pp. 14652–14653.
Kirchner, C., Leidl, T., Kudera, S. (2005). Cytoxicity of Colloidal CdSe and CdSe/ZnS
Nanoparticles. Nano Lett., Vol. 5(2), pp. 331-338.
Klude, M., Passow, T., Heinke, H. and Hommel, D. (2002). Electro-Optical Characterization
of CdSe Quantum Dot Laser Diode. Phys. Status Solidi (b), Vol.229, No.2, pp. 1029-
1052.
Kongkanand, A., Tvrdy, K., Takechi, K., Kuno, M, and Kamat, P.V. (2008). Quantum Dots
Solar Cells. J. Am. Chem. Soc. Vol. 130, 4007-4015. (2008).
Kortan, A.R.; Hull, R., Opila, R.L., Bawendi, M.G., Steigerwald, M.L., Carroll, P.J., Brus, L.E.
(1990). Nucleation and Growth of Cadmium Selenide on Zinc Sulfide Quantum
Crystallite Seeds, and Vice Versa, in Inverse Micelle Media. J. Am. Chem. Soc. Vol.
112, pp. 1327-1332.
Kuno, M., Fromm, D.P., Hamann, H.F., Gallagher, A., Nesbitt, D.J. (2001). “On”/”off”
Fluorescence Intermittency of Single Semiconductor Quantum Dots. J. Chem. Phys.
Vol. 115, pp. 1028-1031.
Korsunskaya, N.E., Markevich, I.V., Torchinskaya, T.V. and Sheinkman, M.K. (1980a).
Photosensitivity Degradation Mechanism in CdS:Cu Single Crystals , phys. stat. sol
(a), Vol. 60, pp. 565-572.
Korsunskaya, N.E., Markevich, I.V., Torchinskaya, T.V. and Sheinkman, M.K. (1980b).
Electrodiffusion of shallow donors in CdS crystals, J.Phys.C. Solid St.Phys., Vol. 13,
pp. 2975 -2978.
Korsunskaya, N.E., Markevich, I.V., Torchinskaya, T.V. and Sheinkman, M.K. (1982).
Recharge-enhanced transformations of donor-acceptor pairs and clusters in CdS J.
Phys. Chem. Solid. Vol. 43, pp. 475-479.
Kozielski, M., Muhle, M., Z. Blaszczak, Z. (2004). J. Molecul. Liquid. Vol. 111, pp. 1-5.
Larson, D.R., Zipfel, W.R., Williams, R.M., Clark, S.W., Bruchez, M.P., Wise, F.W., Webb,
W.W. (2003). Water-Soluble Quantum Dots for Multiphonon Fluorescence Imaging
in Vivo. Science, Vol. 300, pp. 1434-1436.
Lee, LY., Ong, S.L., Hu, J.Y., Ng, W.J., Feng, Y.Y., X.L. Tan, X.L. (2004). Use of
Semiconductor Quantum Dots for Photostable Immunofluorescence Labeling of
Cryptosporidium parvum. Appl Environ Microbiol
, Vol. 70, pp. 5732-5736.
Liu,Y., Qiu, H.Y., Xu, Y., Wu, D., Li, M.J., J.X. Jiang, J.X. and G.Q. Lai, G.Q. (2007). Synthesis
and Optical Properties of CdSe nanocrystals and CdSe/ZnS Quantum Dots. J.
Nanopart. Res., Vol. 9, pp. 745-747.
Liang, J.G., Huang, S., Zeng, D., He, Z., Ji, X. and Yang, H. (2006). Highly Luminescent CdTe
Quantum Dots Prepared in Aqueous Phase as an Altenative Fluorescent Probe for
Cell Imaging. Talanta, Vol. 69, pp. 126-129.
Advanced Biomedical Engineering
178
Liboff, R.L., Greenberg, J. (2001). The Hexagon Quantum Billiard. J. Stat. Phys. Vol. 105, pp.
389-402
Liboff, R.L. (1994). The Polygon Quantum Billiard Problem. J. Math. Phys. Vol. 35, No.2, pp.
596-607
Lopez-Luke, T., Wolcott, A., Xu, L.P., Chen, S.W., Wcn, Z.H., Li, J.H., De La Rosa, E. and
Zhang, J.Z. (2008). Conjugating Luminescent CdTe Quantum Dots with
Biomolecules. J. Phys. Chem. C, Vol. 112, pp. 1282-1287.
Lou, X., Weng, W.J., Du, P.Y., Shen, G. and Han, G.R. (2004). Synthesis and Optical
Properties of CdSe Nanocrystals and CdSe/ZnS Quantum dots. Rare Met. Mater.
Eng., Vol. 33, pp. 291-299.
Madelung, O. (Ed.). (1992). Semiconductors, Data in Science and Technology. Springer-Verlag,
Berlin.
Malik, M.A., O’Brien, P. and Revaprasadu, N. (2005). Precursor Routes to Semiconductor
Quantum Dots. Phos. Sulfur Silicon Relat. Elem., Vol. 180, pp. 689-712.
Mattoussi, H., Radzilowski, L.H., Dabbousi, B.O., Fogg, D.E., Schrock, R.R., Thomas, E.L.,
Rubner, M.F., Bawendi, M.G. (1999). Composite Thin Films of CdSe Nanocrystals
and a Surface Passivating/Electron Transporting Block Copolymer. J. Appl. Phys.
1999, Vol. 86, 4390-4399.
Mattoussi, H., Mauro, J.M., Goldman, E.R., Anderson, G.P., Sundar, V.C., Mikulec, F.V.
(2000). Self-Assembly of CdSe-ZnS Quantum Dots Bioconjugates Using an
Engineered Recombinant Protein. J Am. Chem Soc., Vol.122, pp.12142–12150.
Medintz IL, Uyeda HT, Goldman ER, Mattoussi H. Nat Mater 2005;4:435–46.
Meulenberg, R.W., Jennings, T., Stroue, G.F. (2004). Compressive and Tensile Stress in
Colloidal CdSe Semiconductor Quantum Dots. Phys. Rev. B, Vol. 70, No. 23, 235311.
Miyazaki S, Yamaguchi H, Takada M, Hou WM, Takeichi Y, Yasubuchi H. Acta Pharm
Nordica 1990;2:401–6.
Murcia, M.J.; Shaw, D.L.; Long, E.C.; Naumann, C.A. (2008). Fluorescence Correlation
Spectroscopy of CdSe/ZnS Quantum Dots Optical Bioimaging Probes with Ultra-
Thin Biocompatible Coating. Opt. Commun., Vol. 281, No. 7, pp. 1771-1780.
Murray, C.B., Norris, D.J., Bawendi, M.G. (1993). Synthesis and Characterization of Nearly
Monodisperse CdE (E = Sulfur, Selenium, Tellurium) Semiconductor
Nanocrystallites. J Am.Chem.Soc., Vol. 115, pp. 8706-8715.
Murray, C.B., Kagan, C.R., Bawendi, M.G. (2000). Synthesis and Characterization of
Monodisperse Nanocrystals and Close-Packed Nanocrystal Assemblies. Annu. Rev.
Mater. Sci., Vol. 30, pp. 545-610.
Murray, C.B., Sun, S., Gaschler, W., Doyle, H., Betley, T.A., C.R. Kagan, C.R. (2001).
Colloidal synthesis of nanocrystals and nanocrystal superlattices. IBM J. Res. Dev.,
Vol. 45, pp. 47-56.
Nakamoto, K. (1997). Infrared and Raman Spectra of Inorganic and Coordination Compounds, Part
A, John Wiley &Sons, Inc., N.Y.
Nann, T. and Riegler, J. (2002). Monodisperse CdSe Nanorods at Low Temperatures. Chem.
Eur. J., Vol. 8, No. 20, pp. 4791-4795.
Nazzal, A.Y., X. Y. Wang, X.Y., Qu, L.H., Yu, W., Wang, Y.Z., Peng, X.G., and Xiao, M.
(2004). J. Phys. Chem. B Vol. 108, pp. 55075511.
Nordell, K.J., Boatman, E.M., Lisensky, G.C. (2005). A Safer, Easier, Faster Synthesis for
CdSe Quantum Dot Nanocrystals. J. Chem.Educ., Vol. 82, pp. 1697-1699.
Semiconductor II-VI Quantum Dots with Interface States and Their Biomedical Applications
179
Norris, D.J., Bawendi, M.G. Measurement and Assignment of the Size-Dependent Optical
Spectrum in CdSe Quantum Dots. (1996). Phys. Rev. B, 53, 16338.
Norris, D.J., Efros, Al.L., Rosen, M. and Bawendi, M.G. (1996). Size Dependence of Exciton
Fine Structure in CdSe Quantum Dots. Phys.Rev. B, Vol.53, No. 24, 16347.
Oda, M., Tsukamoto, J., Hasegawa, A., Iwami, N., K. Nishiura, Hagiwara, I., Amdo, N.,
Horiuchi, H. and Tani, T. (2006). J. Luminecs., Vol. 119–120, pp. 570-573.
Parak, W.J., Gerion, D., Zanchet, D., Woerz, A.S., Pellegrino, T., Micheel, Ch., Williams,
Sh.S., Seitz, M., Bruehl, R.E., Bryant, Z., Bustamante, C., Bertozzi, C.R. and
Alivisatos, A.P. (2002). Conjugation of DNA to Silanized Colloidal Semiconductor
Nanocrystalline Quantum Dots. Chem. Mater., Vol. 14, pp. 2113-2119.
Park, J., An, K., Hwang, Y., Park, J.E.G., Noh, H., Kim, J., Park, J., Hwang, N.M. and Hyeon,
T. (2004). Ultra-large Scale Synthesis of Monodisperse nanocrystals. Nat. Mater.,
Vol. 3, pp. 891-895.
Park, J., Lee, K.H., Galloway, J.F. and Searson, P.C. (2008). Synthesis of Cadmium Selenide
Quantum Dots from a Non-Coordinating Solvent: Growth Kinetics and Particle
Size Distribution. J. Phys. Chem. C, Vol. 112, pp. 17849-17854.
Parungo, C.P., Ohnishi, S., Kim, S.W., Kim, S., Laurence, R.G., Soltesz, E.G. (2005).
Intraoperative Identification of Esophageal Sentinel Limph Nodes Using Near-
Infrared Fluorescence Imaging. J Thorac. Cardiovasc Surg., Vol. 129, pp. 844-850.
Pathak, S., Choi, S.K., Arnheim, N., M.E. Thompson, M.E. (2001). Hydroxylated Quantum
Dots as Luminescent Probes for in Situ Hybridization. J. Am. Chem. Soc . Vol. 123,
pp. 4103-4104.
Pellegrino T, Manna L, Kudera S, Liedl T, Koktysh D, Rogach AL, Nano Lett 2004;4:703–7.
Peng, X., Schlamp M.C., Kadavanich A.V., Alivisatos A.P. (1997). Epitaxial Growth of
Highly Luminescent CdSe/CdS Core/Shell Nanocrystals with Photostabiliy and
Electronic Accessibility. J Am Chem Soc., Vol. 119, pp.7019–7029.
Peng, Z.A., and Peng X. (2001). Mechanisms of Shape Evolution of CdSe Nanocrystals. J.
Am. Chem. Soc., Vol. 123, pp. 1389-1395.
Ping Yang, Masanori Ando, Norio Murase. Encapsulation of Emitting CdTe QDs Within
Silica Beads to Retain Initial Photoluminescence Efficiency. Journal of Colloid and
Interface Science, Vol. 316, pp. 420–427.
Portney, N.G., and Ozkan, M. (2006). Nano-Oncology: Drug Delivery, Imaging and Sensing.
Anal. Bioanal. Chem., Vol. 384, pp. 620-630.
Qu, L.H., Peng, Z.A., Peng, X.G. (2001). Synthesis Conditions for Semiconductor CdSe
Nanocrystals in Organic Solvents. Nano Lett, Vol. 1, pp. 333-337.
Qu, L., Peng, X.G. (2002). Control of Photoluminescence Properties of CdSe Nanocrystals in
Growth. J. Am. Chem. Soc, Vol. 124, pp. 2049-2055.
Rakovich, Yu.P., J.F. Donegan, S.A. Filonovich, M.J.M. Gomes, D.V. Talapin, A.L. Rogach,
A. Eychmuller, A. (2003). Physica E, Vol. 17, pp. 99 – 100.
Roberti, T.W., Cherepy, N.J., and Zhang, J.Z. (1998). J. Chem. Phys. Vol. 108, pp. 2143-2150.
Rosenthal, S.J., McBride, J., Pennycook, S.J. and Feldman, L.C. (2007). Synthesis, surface
studies, composition and structural characterization of CdSe, core/shell and
biologically active nanocrystals. Surf. Sci. Rep., Vol. 62, pp. 111-157.
Rowe, B. W. , Pas, S. J. , Hill, A. J. , Suzuki, R., Freeman, B.D., Paul, D.R. (2009). Polymer Vol.
50, pp. 6149-6152.
Advanced Biomedical Engineering
180
Rusakov, K.I., Gladyshchuk, A.A., Rakovich, Yu.P., Donegan, J.F., Filonovich, S.A., Gomes,
M.J.M., Talapin, D.V., Rogach, A.L., and Eychmüller, A. (2003). Optics and
Spectroscopy, Vol. 94, pp. 859-863.
Salgueiriño-Maceira, V., Correa-Duarte, M.A., Spasova, M., Liz-Marzán, L.M., M. Farle, M.
(2006). Composite Silica Spheres with Magnetic and Luminescent Functionalities.
Adv. Funct. Mater., Vol. 16, pp. 509-514.
Selvan, S.T., Li, C.L., Ando, M., Murase, N. (2004). Synthesis of Highly Photoluminescent
Semiconductor nanoparticles by Aqueous Solution. Chem. Lett., Vol. 33, pp. 434-435.
Selvan, S.T., Tan, T.T., Ying, J.Y. (2005). Robust, Non-Cytotoxic, silica-Coated CdSe
Quantum Dots with Efficient Photoluminescence. Adv. Mater., Vol. 17, pp. 1620-
1625.
Shelby, M.D., and Wilkes, G.L. (1998). Polymer Vol. 39 No. 26, pp. 6767–6779.
Schiff, L.I. (1968). Quantum Mechanics, 3
rd
ed., McGraw-Hill, Inc., N.Y.
Schmid, M., S. Crampin, S., Varga, P. (2000). STM and STS of bulk electron scattering by
subsurface objects. J. Electron Spectr. and Rel. Phenomena, Vol. 109, pp. 71-84
Smith, A.M. & Nie, Sh. (2004). Chemical analysis and cellular imaging with quantum dots.
Analyst, Vol. 129, No. 8, pp. 672-677.
Sundar, V.C., Eisler, H.J., Bawendi, M.G. (2002). Room-Temperature, Tunable Gain Media
from Novel II–VI Nanocrystal–Titania Composite Matrices. Adv. Mater 2002, Vol.
14, pp. 739-743.
Tanaka, A., Onari, S., Arai, T. (1992). Raman Scattering from CdSe Microcrystals Embedded
in a Geramante Glass Matrix. Phys. Rev. B, Vol. 45, 6587.
Tashiro, A., Nakamura, H., Uehara, M., Ogino, K., Watari, T., Shimizu, H. and Maeda, H.
(2004).
マイクロリアクターを用いたCdSeナノ粒子の合成 (in Japanese) Kagaku
Kogaku Ronbunshu, Vol. 30, pp. 113-116.
Temple , P.A. & Hathaway, C.E. (1973). Phys. Rev. B, Vol. 7, pp. 3685-3691.
Tessler, N., Medvedev, V., Kazes, M., Kan, S.H., U. Banin, U. (2002). Efficient Near-Infrared
Polymer Nanocrystal Light-Emitting Diodes. Science, Vol. 295, p. 1506.
Torchynska, T.V., Diaz Cano, A., M. Dybic, S. Ostapenko, M. Morales Rodrigez, S. Jimenes
Sandoval, Y. Vorobiev, C. Phelan, A. Zajac, T. Zhukov, T. Sellers, T. (2007). phys.
stat. sol. (c), 4, pp. 241-244.
Torchynska, T.V., Douda, J., Ostapenko, S., S. Jimenez-Sandoval, C. Phelan, A. Zajac, T.
Zhukov, Sellers, T. (2008). J. Non-Crystal. Solids, Vol. 354, pp. 2885-2890.
Torchynska, T.V. (2009a). Interface States and Bio-Conjugation of CdSe/ZnS Core-Shell
Quantum Dots. Nanotechnology, Vol. 20, 095401.
Torchynska, T.V., Douda, J., Calva, P.A., Ostapenko, S.S., and Peña Sierra, R. (2009b).
Photoluminescence of Bioconjugated Core-Shell CdSe/ZnS Quantum Dots. J. Vac.
Sci. &Technol. B, Vol. 27(2), pp. 836-841.
T.V. Torchynska, J. Douda, R. Pena Siera, (2009c). Photoluminescence of CdSe/ZnS
core/shell quantum dots of different sizes, phys. stat. sol. (c) Vol. 6, pp. 143-147.
Torchynska, T.V., Quintos Vazquez, A.L., Pena Sierra, R., Gazarian, K., Shcherbyna, L.
(2010). Modification of Optical Properties at Bioconjugation of Core-Shell
CdSe/ZnS Quantum Dots. J. of Physics, Conference Ser., Vol. 245, 012013.
Vega Macotela, L.G., Douda, J., Torchynska, T.V., Peña Sierra, R. and Shcherbyna, L. (2010a).
Transformation of Photoluminescence Spectra at the Bioconjugation of Core-Shell
CdSe/ZhS Quantum Dots. Phys. Stat. Sol C, Vol. 7, pp. 724-727.
Semiconductor II-VI Quantum Dots with Interface States and Their Biomedical Applications
181
Vega Macotela, L.G., Torchynska, T.V., Douda, J. and Peña Sierra , R. (2010b). Variation of
Raman spectra of CdSe/ZnS quantum dots at the bioconjugation phys.stat.solid. (c),
Vol. 7, pp. 1192-1195.
Vorobiev, Y.V., Vieira, V.R., Horley, P.P., Gorley, P.N., González-Hernández, J. (2009).
Energy spectrum of an electron confined in the hexagon-shaped quantum well.
Science in China Series E: Technological Sciences, Vol. 52, No. 1, pp. 15-18, ISSN 1006-
9321
Vorobiev, Y.V., Gorley, P.N., Vieira, V.R., Horley, P.P., González-Hernández, J. Torchynska,
T.V., Diaz Cano, A. (2010). Effect of boundary conditions on the energy spectra of
semiconductor quantum dots calculated in the effective mass approximation.
Physica E, Vol. 42, No. 9, pp.2264-2267, ISSN 1386-9477
Vorobiev, Y.V., Vieira, V.R., Ribeiro, P., Gorley, V., Horley, P.P., González-Hernández, J.,
and Torchynska, T. (2011) Energy Spectra of an Electron in a Pyramid-shaped
Quantum Dot in Effective Mass Approximation with Even Mirror Boundary
Conditions. Proceedings of 3
rd
WSEAS Conference on Nanotechnology, WSEAS Press,
pp. 127-131, ISBN: 978-960-474-276-9, Cambridge, England, February 20 – 22 de
2011.
Walker, G.W., Sundar, V.C., Rudzinski, C.M., A.W. Wun, A.W., Bawendi, M.G., and Nocera,
D.G. (2003). Quantum-dot Optical Temperature Probe. Appl. Phys. Lett. Vol. 83, No.
17, pp. 3555-3558.
Wang YA, Li JJ, Chen HY, Peng XG. (2002). J Am Chem Soc., Vol. 124, pp. 2293–2298.
Wang, S., Jarrett, B.R., Kauzlarich, S.M., and Louie, A.Y. (2007). Core/Shell Quantum Dots
with High Relaxivity and Photoluminescence for Multimodality Imaging. J. Am.
Chem. Soc. Vol. 129, pp. 3848-3847.
William, W.Yu., Emmanuel Chang, Rebekah Drezek, Vicki L.C. (2006). Water Soluble
Quantum Dots for Biomedical Applications. Biochemical and Biophysical Research
Communications, Vol. 348, pp. 781–786.
Wolcott, A., Gerion, D., Visconte, M., Sun, J., Schwartzberg, Ad., Chen, Sh., and Zhang, J.Z.
(2006). Silica Coated CdTe Quantum Dots Functionalized with Thiols for
Bioconjugation to IgG Proteins. J. Phys. Chem. B, Vol. 110, p.5779-5789.
Wu, X.Y., Liu, H.J., Liu, J.Q., Haley, K.N., Treadway, J.A., J.P. Larson, J.P. (2002).
Immunofluorescent Labelling of Cancer Marker Her2 and Other Cellular Targets
with Semiconductor Quantum Dots. Nat Biotechnol, 21, 41-46.
Yang, L., Li, Y. (2006). Simultaneous Detection of Escherichia coli 0157:H7 and Salmonella
Typhimurum Using Quantum Dots as Fluorescence Labels. Analyst, Vol. 131, pp.
394-401.
Yoon, J.H., Chae, W.S., Im, S.J. and Kim, Y.R. (2005). Mild Synthesis of Ultra-Small CdSe
Quantum Dots in Ethylenediamine Solution. Mater. Lett., Vol.59, pp. 1430-1433.
Yu, K., Zaman, B., Singh, S., Dashan, W. and Ripmeester, J.A. (2005). Colloidal CdSe
Nanocrystals from Tri-n-Octyl J. Nanosci. Nanotechnol. Vol. 5, pp. 659-668.
Yu, W.W., Wang, A., Peng, X. (2003). Formation and Stability of Size-, Shape-, and Structure-
Controlled CdTe Nanocrystals: Ligand Effects on Monomers and Nanocrystals.
Chem. Mater., Vol. 15(22), 4300-4308.
Zenkevich, E.I., Blaudeck, T., Shulga, A.M., Cichosb, F., C. von Borczyskowski, C. (2007).
Identification and Assignment of Porphyrin CdSe Hetero-Nanoassemblies. J.
Luminescence, Vol. 122–123, pp. 784–788.
Advanced Biomedical Engineering
182
Zhang, C.Y., Yeh, H.C., Kuroki, M.T., T.H. Wang., T.H. (2005). Quantum-Dot Based
Nanosensor for RRE IIB RNA-Rev Peptide. Nat. Mater., Vol. 4, pp. 826–831.
Zhao, J., Bardecker, J.A., Munro, A.M., Liu, M.S., Niu, Y., Ding, I K., Luo, J., Chen, B., Jen,
A.K Y., and Ginger, D.S. (2006). Efficient CdSe/CdS Quantum Dot Light-Emitting
Diodes Using a Thermally Polymerized Hole Transport Layer. Nano Lett., Vol. 6,
pp. 463-467.
10
Image Processing Methods for
Automatic Cell Counting In Vivo or
In Situ Using 3D Confocal Microscopy
Manuel G. Forero
1
and Alicia Hidalgo
2
1
Cardiff University,
2
University of Birmingham,
United Kingdom
1. Introduction
Image processing methods have opened the opportunity to extract quantitative information
from confocal microscopy images of biological samples, dramatically increasing the range of
questions that can be addressed experimentally in biology. Biologists aim to understand
how cells behave and what genes do to build a normal animal, and what goes wrong in
disease or upon injury. For this, they look at how alterations in gene function and
application of drugs affect tissue, organ or whole body integrity, using confocal microscopy
images of samples stained with cell specific markers. Image-processing methods have
enormous potential to extract information from this kind of samples, but surprisingly, they
are still relatively underexploited. One useful parameter to quantify is cell number. Cell
number is the balance between cell division and cell death; it is controlled tightly during
growth and it can be altered in disease, most notoriously neurodegeneration and cancer.
Injury (e.g. spinal cord injury) results in an increase in cell death, plus a homeostatic
regulation of cell proliferation. Thus to understand normal animal development, injury
responses and disease, it is important to find out how many cells die or divide, or how
many cells of a given type there are in an organ. Generally, cells are counted using
automated methods after dissociating cells from a tissue (e.g. fluorescence-activated cell
sorting, FACS, based), or when they are distributed in a dish in cell culture experiments,
using image processing techniques in 2D (e.g. using Metamorph software). However, these
approaches alter the normal cellular contexts and the procedures themselves can alter the
relative numbers of cells. To maintain information relevant to how genes and cells behave in
the organism, it is best to count cells in vivo (i.e. in the intact animal) or at least in an entire
organ or tissue (i.e. in situ). Counting in vivo or in situ is generally carried out manually, or
it consists of estimates of number of cells stained with a particular cell marker or inferences
from anatomical alterations. These methods can be extremely time-consuming, estimates can
be inaccurate, and the questions that can be addressed using these methods are limited.
Manual counting can be experimentally cumbersome, tedious, labour intensive and error
prone. The advent of confocal microscopy, which allows the capture of 3D images, has
enabled the development of automatic and semi-automatic image processing methods to
count cells in whole tissues or entire small animals. Whereas excellent automated methods
Advanced Biomedical Engineering
184
can be purchased commercially and are widely used to count cells after dissociation or in
cell culture, fewer methods have been developed to count cells in situ or in vivo. Such
methods are challenging, as they require large stacks of images to capture the whole sample,
and can encounter greater difficulty in distinguishing labelled cells from background signal.
Some automatic techniques have been developed to segment cell nuclei from mammalian
tissue sections or from whole Drosophila brains in 2D and 3D images (Lin et al., 2003;
Shimada et al., 2005; Wählby 2003; Wählby et al., 2004), but they are not useful to analyse
large sample sizes because the intensive computation slows down the process. Identifying
all the nuclei is extremely challenging from the point of view of imaging because cells can be
tightly packed. In any case, counting all nuclei is not always most informative, as it does not
qualify on cell type (is the number of neurons or glia altered?) or cell state (do the changes
affect dividing or dying cells?). Cell Profiler (Carpenter, 2006) enables combinations of
image-processing methods that can be used to count cells, but it is not very user friendly for
most biologists as it requires computation expertise.
We have developed a range of publicly available methods that can count the number of
dividing or dying cells, neurons or glia, in intact specimens of fruit-fly Drosophila embryos
(Forero et al, 2009, 2010, 2010a). Quantification is automatic, accurate, objective and fast,
enabling reliable comparisons of multiple specimens of diverse genotypes. Additionally,
results are reproducible: automatic programs perform consistently and always yield the
same cell count for a given sample regardless of the number of times it is counted.
Drosophila is a powerful model organism generally used to investigate gene function,
developmental processes and model human diseases. Working in vivo or in situ with
Drosophila is one of the main reasons behind using it as a model organism. Using
Drosophila, researchers have investigated the number of dying cells, glial cells, and progeny
cells in a neuroblast lineage, or the number of cells within mosaic cell clones (Maurange et al
2008; Bello et al, 2006, 2008; Rogulja-Ortmann et al. 2007; Franzdottir et al. 2009; Ho et al.
2009). Our methods can be used to automate these quantitative analyses. Although our
image processing methods were developed from Drosophila images, these methods can be
adapted to work on other sample types (i.e. mammalian tissues).
The identification and counting of cells is a difficult task both for the human eye and for
image processing: i) Most often, cell visualisation with immunohistochemical markers
results in background signal (i.e. spots) as well as the signal corresponding to the cells; ii)
there is also natural variability within biological samples, as cell size and shape can vary;
iii) if a marker detects abundant cells, they can be tightly packed and it can be difficult to
determine the boundaries between adjacent cells; iv) and the properties of the detector,
the fluorescence settings and the lasers can also introduce error (Dima et al., 2002). As a
result, it can be difficult to decide what is a cell and what is not. Consequently, manual
counting is extremely error prone. Image processing methods are ideal for objective
quantifications, since once a good method has been established to identify the objects, all
samples are treated in the same way thus eliminating error. When analysing cell counts in
whole organisms (i.e. Drosophila embryos), tissues or organs, it is not appropriate to use
projections of a stack of images into a single 2D image, since this will occlude cells and
form tight clusters rendering it impossible to separate the individual cells. In vivo
quantification requires object recognition in 3D, which is achievable using confocal
microscopy.
In this chapter, we review the most relevant steps to be considered in the development of
automatic methods to segment and count cells in 3D for in-situ or in vivo preparations. The
Image Processing Methods for Automatic
Cell Counting In Vivo or In Situ Using 3D Confocal Microscopy
185
principles described will enable researchers of multiple disciplines to apply the logic of
image processing to modify the currently available programs making them applicable to
their own samples and research questions, as well as help them make further developments.
For two complementary reviews of image processing techniques and a description of some
of the existing software employed to analyse biology samples, please see (Meijering &
Cappellen, 2007) and (Peng, 2008).
2. Methodology
Counting cells in Drosophila is a complex task, due to variability in image quality resulting
from different cell markers. Cells are segmented according to their characteristics. But cell
shape changes with cell state (i.e. arrest, mitosis, or apoptosis). For instance, during mitosis
the shape is irregular and it can be difficult to determine when a dividing cell can be
considered as two daughter cells. Nuclei and glia cells have a more regular shape, between
elliptical and circular. Apoptotic cells have initially a very irregular shape, later on very
round, and can appear subdivided into different parts depending on the timing within
apoptosis. Depending on the kind of cells or cell state to be visualised, a different cell
marker (i.e. antibody) is employed. As a result, different image-processing methods must be
developed to quantify cells of different qualities.
2.1 Visualisation of distinct cell types and states using immunohistochemistry
Cells to be counted in Drosophila embryos were visualised with immunohystochemistry
methods, using antibodies as follows (Figure 1). (1) Dying (apoptotic) cells were stained
with anti-cleaved-Caspase-3 (hereafter called Caspase) (Figure 1a), a widely used marker
for apoptotic cells. The protein Caspase-3 is evolutionarily conserved. The commercially
available antibodies that we have used (Caspase-3, Cell Signalling Technology) cross-react
with a wide range of species, including Drosophila. Caspase is initially cytoplasmic and as
apoptosis progresses it reveals intense, round, shrunken cells. Organisms stained with
Caspase yield images with cells of irregular shape and size, low signal intensity and high
intensity background. (2) Dividing (mitotic) cells were stained with anti-pHistone-H3
(hereafter called pH3, Figure 1b). pH3 labels the phosphorylated state of the
evolutionarily conserved Histone-H3 characteristic of M-phase (mitosis) of the cell cycle.
The commercially available antibodies we used (Upstate Biotechnology) work well in a
wide range of species. The embryonic nuclei stained with pH3 are sparsely distributed
and do not tend to overlap or form large clusters. As pH3 stains chromosomes, shape can
be irregular. Nuclei can appear connected and must be separated. (3) Glial cell nuclei were
stained with anti-Repo (hereafter called Repo) (Figure 1c). Repo (Developmental Studies
Hybridoma Bank, Iowa) is the general nuclear marker for all glial cells, except the midline
glia, in Drosophila. Nuclei stained with Repo tend to be rather regular. pH3 and Repo
antibodies yield high signal intensity and low background, and stain nuclei that are
relatively sparsely distributed in the organism. (4) Neuronal nuclei were stained with
anti-HB9 (hereafter called HB9, gift of H. Brohier) in embryos (Figure 1d). Pan-neuronal
anti-Elav does not consistently yield stainings of comparable quality and visualising all
nuclei compromises resolution during object identification. Thus, a compromise solution
is using HB9, which stains with strong signal and low background a large subset of
interneurons and all motorneurons.
Advanced Biomedical Engineering
186
a. b.
c. d.
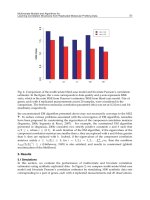
Fig. 1. Drosophila embryos labelled with: (a) Anti-cleaved-Caspase-3 to visualise apoptotic
cells. (b) Anti-p-Histone-H3 to visualise mitotic cells. (c) Anti-Repo to visualise glial cells. (d)
Anti-HB9 to visualise a subset of neuronal nuclei. A fraction of the ventral nerve cord is
shown in each case; all images show single confocal optical sections.
Whole embryos were dechorionated in bleach, then fixed in 4% formaldehyde in phosphate
buffer (PBS) for 20 minutes at room temperature, washed in PBS with 0.1% Triton-X100
(Sigma) and stained following standard protocols (Rothwell and Sullivan, 2000). Embryos
were incubated in diluted primary antibodies overnight at 4°C and the following day in
secondary antibodies for 2 hours at room temperature. Antibodies were diluted in PBS 0.1%
Triton as follows: (1) Rabbit anti-cleaved-Caspase-3 1:50; (2) Guinea-pig HB9 1:1000; (3)
Mouse anti-Repo at 1:100; (4) Rabbit-anti-phospho-Histone-H3 at 1:300. Secondary
antibodies were directly conjugated to Alexa-488 and used at 1:250. Anti-Caspase had a
tendency to yield high background, and different batches produced by Upstate
Biotechnology had different staining qualities. Thus each new batch had to be optimised. To
reduce background, embryos were first blocked in 1% Bovin Serum Albumin (BSA, Sigma)
and incubated in very small volumes (10 microliters worth of embryos in a 50-100 microliter
volume of diluted antibody), and the antibody was not reused. Signal amplification was not
used (i.e. no avidin) since this raised the Caspase background considerably. All other
antibodies were more robust and worked well using standard conditions, and antibody
aliquots were reused multiple times. Samples were mounted in Vectashield (Vector Labs) or
Image Processing Methods for Automatic
Cell Counting In Vivo or In Situ Using 3D Confocal Microscopy
187
70% glycerol. Mounted whole embryos were scanned using a BioRad Radiance 2000 or Leica
TCS-SP2-AOBS laser scanning confocal microscopes. The settings at the confocal microscope
were fixed for all samples and acquisition was set to ensure that the dynamic range of the
histogram covered all grey values. The conditions for scanning were 60x lens, no zoom and
0.5μm slice step, acquisition resolution of 512 x 512 pixels, no averaging. Fixed iris (pinhole
=1), laser intensity, gain and offset were maintained throughout all samples of the same
experiment. Software algorithms were developed and evaluated using Java and ImageJ
under an Ubuntu Linux platform in a PC Pentium 4 running at 3 GHz with 1.5 GB RAM.
2.1 Development
Most published techniques segment and count cells in two dimensions. With the appearance
of confocal microscopes, which allow to visualise cells plane by plane in 3D, new techniques
have been developed to count them in 3D.
In general, the automatic and semiautomatic techniques developed to count cells follow
these steps:
Acquisition.
Filtering for noise reduction.
Segmentation.
Post processing, including morphological filtering and separation of cells.
Classification.
2.2 Acquisition
The acquisition protocol is a very important step. If the quality of the images is poor or
strongly changes from one stack to another, it renders the development of an automatic
counting method challenging. For a given experiment were all samples are labelled with the
same cell marker and fluorophore, there can be considerable variability in the quality of the
images, and if of bad quality it can even become impossible for an experienced biologist to
identify reliably the cells. Therefore, several parameters must be optimised experimentally,
such as those relating to the treatment of samples (e.g. fixative, detergent, dilutions of
antibodies, incubation period, etc.) and the acquisition (e.g. laser intensity, filters, gain and
offset of the amplifiers, magnification, etc). Once the best quality of images is obtained, all of
these parameters must be fixed, and samples that do not produce images of adequate
quality should be rejected.
3D image processing techniques can be used to improve the quality of segmentation. This is
important when the signal to noise ratio is low, given that some spots can be considered
noise in a 2D image, but recognized as true particles in 3D (Gué, 2005). To work in 3D, other
techniques should be considered before filtering. In fluorescence confocal microscopy signal
intensity decreases with tissue thickness. Thus, frequently 3D techniques apply an intensity
correction. One of the simplest techniques employs the maxima or the average of the
foreground on each image to construct a function of the intensity attenuation and the
inverse function is used to compensate the intensity loss (Adiga, 2000; Lin, 2003; Wählby,
2004). However, the result is not always satisfactory, especially when the background or the
foreground changes abruptly or the background has some complexity, making it difficult to
define the foreground automatically. This is a common issue in Drosophila samples. More
complex techniques can also be used, although they are time-consuming (Conchello, 1995;
Guan, 2008; Kervrann, 2004; Rodenacker, 2001; Roerdink, 1993; Wu, 2005) or require
complex acquisition (Can, 2003).
Advanced Biomedical Engineering
188
Images are also degraded by out-of-focus blur, albeit to a lesser degree than with epi-
fluorescence. The Z resolution is lower than in the X-Y plane, which affects the results of 3D
segmentation techniques. De-blurring and restoration techniques, which both improve image
definition and reduce noise should be considered before applying 3D segmentation
techniques. Some of these methods are based on the knowledge of the Point Spread Function
(PSF) or are blind when the PSF is unknown. The Richarson-Lucy (Richardson , 1972; Lucy,
1974) and the Tikhonov deconvolution methods are two of the best known methods. Others
include maximum likelihood estimation, Wiener and wavelets (see review by Sarder &
Nehorai, 2006). Deconvolution methods can achieve very good results, but at the expense of a
very high computational cost. However, if a convenient segmentation technique is used to
process each image based only in its properties, an intensity correction procedure can be
avoided. Given such complexity and pitfalls, techniques have been developed to take the
alternative route of avoiding these steps. Accordingly, images are filtered and segmented in
2D, and 3D techniques are only applied once the intensity of the cells is no longer relevant, i.e.
after the images have been segmented, thus gaining speed in the process.
2.3 Filtering
3D restoration methods improve the quality of the images reducing noise. When these
methods are not employed, other noise reduction techniques must be used. In confocal
microscopy images, noise follows a Poisson distribution as image acquisition is based on
photon emission. Given that the number of photons produced is very small, statistical
variation in the number of detected photons is the most important source of noise. Although
some researchers employ linear filters like the Gaussian operator to reduce noise in confocal
microscopy (Wählby, 2004; Fernandez, 2010), they are not the most recommended to reduce
Poisson noise, which is signal dependent. Additionally, the use of linear filters results in a
lower definition of the cell borders, making it more difficult to distinguish cells, especially
when they are tightly packed. In the Poisson distribution the mean and variance are not
independent. Therefore, variance stabilising transformations (VST), like the Anscombe
(Anscombe, 1948) and, the Freeman and Tukey (Freeman & Tukey, 1950) transforms, which
approximately transform a random variable following a Poison distribution into a Gaussian,
could be applied (Kervrann, 2004a) before the use of a linear filter.
Bar-Lev and Enis (Bar-Lev & Enis 1988) developed a method for obtaining a class of
variance stabilizing transformations, which includes the Ascombe and, Freeman and Tukey
transforms. In this case, images are transformed, then filtered by using a linear operator and
then the inverse transform is applied before segmentation. However these transforms have
an important limitation, as they are not useful when the number of counts or photons per
pixel is lower than about 20 (Starck, 2002). Furthermore, bad results are also related to the
inverse process (Makitalo & Foi, 2011). New efforts have been made to improve these two
aspects (Foi, 2008, 2009; Makitalo & Foi, 2011, 2011a), but their developments have not been
tested for cell counting in confocal microscopy samples. Other models based on the analysis
of the acquisition system have been proposed (Calapez & Rosa, 2010).
Given the nature of the noise, non-linear filters are more appropriate. These filters in general
reduce the noise and the significant intensity heterogeneity typical of confocal images, without
strongly affecting the signal provided by the stained cells. The median filter is one of the
simplest methods and we found it provides good results (Forero et al, 2009, 2010, 2010a). Many
other median filter variations can also be employed, although they can require a more
exhaustive and time-consuming calculation, and some parameters to be fixed (Mitra, 2001;
Image Processing Methods for Automatic
Cell Counting In Vivo or In Situ Using 3D Confocal Microscopy
189
Forero & Delgado, 2003). Outlier filters can also serve to eliminate noise, while keeping the
edges on the image. In this kind of filter the value of each pixel p is replaced by the mean or the
median of the pixels included in a window centered in p, if the original value of p is further
from the mean or the median than a threshold t defined by the user. Noise reduction techniques
based on wavelets are also employed to filter confocal images. They can yield good results with
an appropriate bank of filters. Other edge preserving methods like bilateral filters (Tomasi &
Manduchi, 1998) can also be employed (Shen, 2009; Rodrigues, 2008). 3D filters have also been
used, but the computational cost is higher and results can be affected by the difference in the
resolution between the x-y plane and the z-axis. 2D restoration of the 3D methods mentioned
above can also be employed, but unfortunately they are still time-consuming.
In addition to the Poisson noise filters, other filters may be required to eliminate noise
specific to the kind of images being processed. For example, signal intensity is
heterogeneous in HB9 labelled nuclei, and image background is characterised by extremely
small spots or particles of very high intensity. To eliminate these small spots and render
signal intensity uniform, a grey scale morphological opening with a circular structural
element of radius r, higher than the typical radius of the spots, is applied to each slice of the
stack. As a generalization, particles of any particular size can be eliminated by
morphological granularimetry. In this way, granularimetry defined as:
G= Open (r
min
) - Open (r
max
) (1)
is used to eliminate particles of radius between r
max
and r
min
.
Another morphogical noise reduction technique, the alternating sequential filter (ASF) has
also been used to reduce noise in confocal images (Fernandez, 2010). This filter removes
particles starting from the smallest ones and moving toward the largest ones by doing an
alternating succession of opening and closing morphological operations with structural
elements of progressively larger size (Sternberg, 1986; Serra, 1988).
2.4 Segmentation
After filtering, segmentation is carried out. Segmentation is a procedure that subdivides the
image in disjoint regions or classes in order to identify the structures or objects of interest
appearing in the image. These structures can be basically identified by their similarity or
discontinuity. On the one hand, the detection of the edges or contours of the objects of
interest is given by searching the local discontinuities in the intensity of the grey levels of
the image. On the other hand, the extraction of the objects can be found by searching the
homogeneous areas in the grey level values. Thresholding techniques allow separating the
pixels of the image between background and foreground. In the simplest case, bilevel or
binarisation, the pixels take only two possible different grey levels. The objects in the
foreground are considered to belong only to one class and are separated from the
background by choosing an optimum threshold grey level t, in the interval [0, L], where L is
the maximum grey level in the image, based on certain criteria. Mathematically,
binarisation is a process of transformation that converts an image represented by the
function q(x, y) into the image r(x, y) given by:
1if (,)
(,)
0if (,)
qxy t
rxy
qxy t
(2)
where (x, y) represent the position of each pixel in the image.
Advanced Biomedical Engineering
190
A third kind of method to segment cells in confocal microscopy consists on the use of active
contour models. In their original description, snakes (Kass et al. 1988), the active contours
were seen as a dynamic elastic band that was located outside or inside the objects to be
segmented, and by contraction or expansion of the band the borders of the objects were
obtained. The snakes look for the borders by minimizing the energy of the band, using the
gradient of the image as one of the parameters to calculate the energy. This technique is very
sensitive to noise and initiation (i.e. where the band is initially located), and several methods
have been developed to overcome the limitations of finding a good initiation and of
segmenting nuclei (Clocksin, 2003; Chan et al., 2000, Chan & Vese, 2001, Osher & Sethian,
1988), using level sets (Cheng, 2009).
As cell borders are fuzzy, we preferred thresholding to edge detection methods for
segmentation. Depending on the intensity variation in the cells through each image, local or
global thresholding can be employed. An alternative consists on using more than one global
threshold (Long et al., 2007). Long et al. calculates a first threshold and cells detected over
that threshold are segmented and counted. Then the regions where the cells have been
counted are ignored and a new threshold is calculated. This second threshold is lower than
the first one and allows detecting cells of lower intensity. Then these new cells are also
processed and counted.
Due to fluorescence attenuation through the stack of images, cells are more clearly seen in
the first slices and for this reason using only one threshold to binarise the whole stack is not
appropriate. Instead, a threshold value is found for each image. The method chosen to find
the threshold t is critical and varies with the marker employed to label the cells or nuclei and
the characteristics of the resulting images. Thus a different binarisation method was
developed for each cell marker.
2.4.1 Neuronal nuclei
The method employed to binarise images depends on the characteristics of the
distribution of the intensities of the objects and background in the images, which can be
studied trough the histogram. One of the most popular thresholding methods, Otsu,
works especially well when the typical histogram of the images is bimodal, with a
Gaussian distribution. It works also well in highly contrasted images, where there is a
strong intensity difference between foreground and background. This was the case for
nuclei labelled with HB9 antibodies, and therefore this was the method employed to
binarise such images (Forero et al, 2010). A frequent case to be considered when working
with stacks, is when no cells or nuclei but only background appear in some images.
Whereas a very low threshold can be found, this would yield false nuclei. To solve this
problem, low thresholds are not taken into account when the maximum intensity of an
image is lower than a quarter of the maximum grey level or if the threshold is lower than
20, a value found empirically corresponding to the highest standard intensity of the
background. In these cases, images are binarised using the last valid threshold obtained in
a previous image of the stack. If a very low threshold is found in the first image of the
stack, the threshold takes the value of the maximum grey level and the binarised image
becomes black. The resulting binarised images are employed as masks and combined,
using a logic AND operation, with the images resulting of the opening operation to
produce images were the background becomes black (grey level ‘zero’) and the intensities
of the foreground remain unmodified. For further details, see (Forero et al, 2010).