Electric Vehicles The Benefits and Barriers Part 8 docx
Bạn đang xem bản rút gọn của tài liệu. Xem và tải ngay bản đầy đủ của tài liệu tại đây (694.25 KB, 20 trang )
Supercapacitors as a Power Source in Electrical Vehicles
129
- Mechanical transmission between motor and load that adjusts motor speed and torque
to torque of the working mechanism (load)
- Data from all elements (source, converter, motor, transmission, load) are collected by
regulator (controller), which based on given (required) parameters performs automatic
drive control.
DC source voltage is performed by means of DC-DC converter (chopper) combined with
non regulated rectifier. Figure 6 shows principal scheme of such a system.
Fig. 6. Principal scheme of chopper supply
To provide breaking, or to dissipate braking energy that cannot be returned to the network
through diode rectifier, it is required to have braking device with transistor T and resistor R.
Rectified voltage from rectifier (D
1
– D
6
) is filtered by simple LC filter and brought to the
chopper input that regulates mean value of output voltage U
d
.
For motor supply there are mostly used chopper voltage reducers, so they will be
considered here. Figure 7 shows simplified presentation of the chopper supply of a DC
motor. Chopper is shown as ideal breaker controlled by voltage (U
up
), so it can control
switching on (T
ON
) and switch-off (T
off
) exiting voltage (U
do
).
Fig. 7. Simplified presentation of the chopper supply of a DC motor
Chopping frequency is by the definition:
c
off
11
on
f
TT T
Electric Vehicles – The Benefits and Barriers
130
Also, compliance factor is defined:
on
T
d
T
,
So, output voltage is:
U
d
= d U
do
So, by changing T
on
/T
off
ratio, the output voltage U
d
can be adjusted between 0 and U
do
.
Simplified chopper shown can provide only first quadrant operation. For all four quadrant
operation transistor bridge as shown in figure 8 can be used:
L
C
d0
U
1
T
4
T
3
T
2
T
4
D
2
D
3
D
1
D
a
R
a
L
d
u
Fig. 8. Transistor bridge
Fig. 9. Circuit for speed regulation of DC motor with independent field
Supercapacitors as a Power Source in Electrical Vehicles
131
By switching on transistor pairs T
1
-T
2
or T
3
-T
4
positive or negative polarity of motor voltage
u
d
is provided. To close motor current at null or reverse polarization, diodes D
1
to D
4
are
provided.
General modern circuit for speed regulation of DC motor is shown in figure 9. Reference
rotary speed W
ref
is set and also maximum armature current I
amax
and their actual values are
monitored and also brought into regularotr which outputs present command values for
excitation actuators and inductor.
Out of base range (for speeds above nominal) method of reduced field is used so among
basic values excitation current, i
f
, is monitored.
Apart from classic PID action, regulating algorithm comprises other tasks (actuator
command input adaptation, change of regulating method in accordance with the given
speed, alarms etc.). Standard way of regulating DC drives, cascade regulation, consists of
two feedbacks: internal – current and external – speed.
Asynchronous motor at constant frequency and amplitude of supply voltage rotor speed
depends of load torque, which requires complicated governing algorithms in case when
precise speed control and/or position. This phenomenon is a consequence of principle of
asynchronous motor, and it is electromagnetic induction, which requires difference in
between rotor speed and rotary magnetic field generated by stator to create electromagnetic
torque. Electronics that creates algorithms mentioned was expensive earlier and such a use
of asynchronous motors was difficult, but today with cheaper electronics components and
use of microprocessors for regulating algorithms they are more often used.
Figure 2.15 represents block-diagram of regulated drive for AC motor. Depending on use
and requirements, some of feedbacks and regulators can be left out. Power block (converter
+ motor) has two input and five output values. Input (command) parameters are effective
polyphase supply voltage U
d
and frequency Ws. Output (regulated) values are motor
current Is, flux w, position O, rotary frequency w and torque me. Each of those has proper
regulator in negative feedback, in order as shown in figure 10.
Fig. 10. Block diagram of AC motor regulator
Regulation (close-loop control) comprises control with negative feedback, or feedbacks, by
means of which, by means of measuring regulated parameters and comparing with required
(reference) parameters those values, is acted upon command parameters, so it is
automatically achieved ahead defined values of controlled values. That way more complex
dynamic system is achieved which inputs no longer present control, but reference values,
Electric Vehicles – The Benefits and Barriers
132
5. Conclusion
Electric drive vehicles are one of the most advanced taking in account contamination of
environment. Lately there is an increased interest in the world for hybrid vehicles that
have smaller fuel consumption and substantially less contamination emission footprint.
Hybrid vehicles in most general terms can be described as vehicles comprising
combination of energy producing and storing. Two types of vehicles are considered – so
called parallel and serial hybrids. With parallel hybrids there is a mechanical connection
between power generator and driving wheels, and with serial hybrids there is no such a
connection. Serial hybrids have common advantages over parallel due to mechanical
simplicity, flexibility in terms of design and ability for simple new technology
incorporation.
Critical component in every hybrid or purely electrical vehicle is energy storing. Possible
solutions are accumulators, supercapacitors, flying wheels, hydraulic devices and new
special materials for hydrogen storing. It was already mentioned that accumulators have
specific power problem. Flying wheels are still in development same as energy storing using
hydrogen, so substantial technological improvements are needed before they can be put in
use. Supercapacitors are only available technology today that can provide high power (over
1kW/kg) and great cycle numbers at acceptable price. Supercapacitors have other properties
that makes them interesting in hybrid vehicles, and it’s ability of complete regeneration of
energy of braking (so called regenerative braking), which increases energy efficiency, no
special maintenance needed, great utilization of electric energy, small toxicity and easy
storage after use.
Most demanding requirements are set for capacitors that are used in electric drives, or in the
vehicles of the future. Batteries with large capacitance of several hundred Farads and few
hundred volts of working voltages are already produced. Apart from large capacitance and
relatively high working voltage those capacitors also must have high specific energy and
power (for reason of limited vehicle space). They have huge advantage in terms of specific
power compared to accumulator batteries, but they are incomparably worse in terms of
specific energy. That’s why the ideal combination becomes parallel connection of
accumulator and capacitor batteries. In steady state (normal drive) vehicle motor is supplied
from accu-battery and at sudden accelerating it is fed from supercapacitor. Very important
fact is that at sudden breaking all mechanical energy can be returned to a system by
transforming to electric energy only with presence of supercapacitors with high specific
power. For the reasons mentioned internal resistance of supercapacitors used has to be
significantly low. Leakage current is of no importance. Vehicles with this kind of drive are
still not highly implemented in use, mainly for economical reasons.
In this chapter theoretical base is presented, practical realization and use feasibility of
supercapacitors in block of electrical vehicle power supply in combination with accumulator
batteries or with fuel cells. It also presents regulator solutions and other essential power
solid state assemblies in optimized electrical vehicles.
6. Acknowledgment
This work was financially supported by the Ministry of Science and Technological
Development of Serbia (Project No. 172060).
Supercapacitors as a Power Source in Electrical Vehicles
133
7. References
Arbizzani, C.; Mastragostino, M. & Soavi, F. (2001). New trends in electrochemical
supercapacitors. Journal of Power Sources, Vol.100, No1-2, (November 2001), pp. 164-
170 ISSN 0378-7753
Ardizzone, S.; Fregonara, G. & Trasatti, S. (1990). »Inner« and »outer« active surface of RuO
2
electrodes. Electrochimica Acta, Vol.35, No1, (January 1990), pp. 263-267, ISSN 0013-
4686.
Bugarinović, S.; Rajčić-Vujasinović, M. & Stević, Z. Construction of double layer capacitors,
Proceedings of 39
th
International October Conference on Mining and Metallurgy, pp. 470-
476, ISBN 987-86-80987-52-1, Sokobanja, Serbia, October 7-10, 2007.
Bugarinović, S.; Rajčić Vujasinović, M. & Stević, Z. (2008). Supercapacitors based on
activated carbon, Proceedings on 40
th
International October Conference on Mining and
Metallurgy, pp. 417-422, ISBN 978-86-80978-60-6, Sokobanja, Serbia, October 5-8,
2008.
Conway, B.E. (1999). Fundamentals of Electrochemical Capacitor Design and Operation. In:
Electrochemical Supercapacitors: Scientific Fundamentals and Technological
Applications, Kluwer Academic/Plenum Publishers, ISBN 0-306-45736-9, New York,
USA.
Guerrero, M.A.; Romero, E.; Barrero, F.; Milanés, M. I. & González E. Supercapacitors:
Alternative Energy Storage Systems. Power Electronics & Electric Systems (PE&ES),
School of Industrial Engineering (University of Extremadura). Available from:
andes.unex.es/archives%5CP126.pdf
Hadartz, M. & Julander M. (June 6, 2008). Battery-Supercapacitor Energy Storage, Master of
Science Thesis in Electrical Engineering, Chalmers University of Technology,
Göteborg, Sweden.
Kotz, R. & Carlen, M. (2000). Principles and applications of electrochemical capacitors.
Electrochimica Acta, Vol.45, No15-16, (May 2000), pp. 2483-2498, ISSN 0013-4686.
Miller, J.M.; Dunn, B.; Tran, T.D. & Pekala, R.W. (1997). Deposition of ruthenium
nanoparticles on Carbon Aerogels for High Energy Density Supercapacitor
Electrodes. J. Electrochem. Soc., Vol.144, No12, (December 1997), L309-311, ISSN
0013-4651.
Park, J. & Mackay, S. (2003). Practical Data Acquisition for Instrumentation and Control Systems
(1
st
edition), Newnes, Oxford, Burlington, ISBN 07506 57960, Mumbai, India.
Stević, Z.; Andjelković , Z. & Antić, D. (2008). A New PC and LabVIEW Package Based
System for Electrochemical Investigations. Sensors, Vol.8, No3, (March 2008), pp.
1819-1831, ISSN 1424-8220.
Rajčić-Vujasinović, M.; Stanković, Z. & Stević, Z. Consideration of the electrical circuit
analogous to the copper or coppersulfide/electrolyte interfaces based on the time
transient analysis. Russian Journal of Electrochemistry, Vol.35, No3, (March 1999), pp.
320- 327, ISSN 1023-1935.
Stević, Z. Supercapacitors based on copper sulfides, Ph.D. Thesis, University of Belgrade,
2001
Stević, Z. & Rajčić-Vujasinović, M. (2006). Chalcocite as a potential material for
supercapacitors. Journal of Power Sources, Vol.160, No2, (October 2006), pp. 1511-
1517, ISSN 0378-7753.
Electric Vehicles – The Benefits and Barriers
134
Stević, Z.; Rajčić-Vujasinović, M.; Bugarinović, S. & Dekanski, A. (2010). Construction and
Characterisation of Double Layer Capacitors. Acta Physica Polonica A, Vol.117, No1,
(January, 2010), pp. 228-233, ISSN 0587-4246.
Stević, Z.; Rajčić-Vujasinović, M. & Dekanski, A. (2009). Estimation of Parameters Obtained
by Electrochemical Impedance Spectroscopy on Systems Containing High
Capacities. Sensors, Vol.9, No9, (September 2009), pp. 7365-7373, ISSN 1424-8220.
Stević, Z.; Rajčić-Vujasinović, M.; Nikolovski, D: & Antić, D. (2010). Hardware and software
of a system for electrochemical and bioelectrochemical investigations, Book of
abstracts on CD ISIRR 2010, 11th International Symposium on Interdisciplinary Regional
Research, pp. 139, Szeged, Hungary, October 13-15, 2010.
Stević, Z.; Rajčić-Vujasinović, M. & Stanković Z. (2002). Achievments and perspectives in
supercapacitors development and applying, Proceedings of 34
th
International October
Conference on Mining and Metallurgy, pp. 435-440, ISBN 86-80987-17-4, Bor Lake,
Serbia, September 30 – October 3, 2002.
Stević, Z.; Rajčić-Vujasinović, M. & Stanković, Z. (2002). Galvanostatic investigations of
copper sulfides as a potential electrode material for supercapacitors, PO 320, Book of
Abstarcts 3
rd
International Conference of the Chemical Societies of the South-Eastern
European Countries on Chemistry in the New Millennium – an Endless Frontier, Vol.II,
pp. 97, Bucharest, Romania, September 22-25, 2002.
Stević, Z.; Rajčić-Vujasinović, M. & Stanković, Z. (2003) Modelling of copper
sulphide/electrolyte systems as a potential material for supercapacitors Proceedings
of XXII International Mineral Processing Congress, pp.463, ISBN 0-9584663-4-3, Cape
Town, South Africa, September 28 – October 3, 2003.
Stević, Z.; Rajčić-Vujasinović, M. & Stojiljković, Z. (2004). Testing of system for
electrochemical impedance spectroscopy developed at Technical faculty in Bor,
Proceedings of 36
th
International October Conference on Mining and Metallurgy, pp. 415-
418, ISBN 86-80987-27-1 Bor Lake, Serbia, September 29 – October 2, 2004.
Van Voorden, A.M.; Ramirez Elizondo, L.M.; Paap, G.C.; Verboomen, J. & Van der Sluis, L.
(2007). The Application of Super Capacitors to relieve Battery-storage systems in
Autonomous Renewable Energy Systems. Power Tech, pp. 290-295.
Zheng, J.P.; Huang, J. & Jow, T.R. (1997). The limitations of energy density fro
electrochemical capacitors. J. Electrochem Soc., Vol.144, No6, (June 1997) pp. 2026-
2031, ISSN 0013-4651.
8
Integration of Electric Vehicles
in the Electric Utility Systems
Cristina Camus, Jorge Esteves and Tiago Farias
Instituto Superior de Engenharia de Lisboa, Instituto Superior Técnico
Portugal
1. Introduction
In the last decades, the energy use for electricity production and for the transportation sector
have more than duplicated (IEA - WEO, 2007) and today face a number of challenges related
to reliability, security and environmental sustainability. The scientific evidence on climate
change (IPCC, 2007) has been calling for urgent cross-sector emission cutting and electrified
transportation is in the portfolio of the technology options that may help to solve the
problem (IEA - ETP, 2008). In most of OCDE countries the transportation and electric power
systems contribute to the majority of CO
2
emissions (IEA - WEO, 2008) and most of the fossil
fuels (coal, natural gas and oil) used to produce electricity and for transportation are, in
many of these countries, imported. Oil accounts to the majority of this primary energy
imports and more than 60% of it, is used for transportation (mainly road transportation) and
so is responsible for the majority of emissions associated to the transport sector. All these
facts are pressing decision makers/manufacturers to act on the road transportation sector,
introducing more efficient vehicles on the market and diversifying the energy sources.
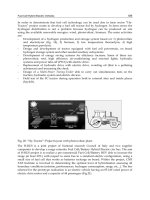
The technological evolution of the Electric Drive Vehicles (EDV) of different types: Hybrid
Vehicles (HEV), Battery Electric Vehicles (BEV) and Fuel Cell Vehicles (FCV), will lead to a
progressive penetration of EDV´s in the transportation sector taking the place of Internal
Combustion Engine Vehicles (ICEV). The next step in EDV technological development,
already announced by some of the main automakers, (EV World, 2009) is the possibility of
plugging into a standard electric power outlet so that they can charge batteries with electric
energy from the grid. A lot of companies including many key and niche players worldwide
are reported to have been developing models for the coming years in the segments of
battery powered electric vehicles, Plug-In Hybrid Electric Vehicles (PHEVs), and fuel cell
electric vehicles (EV ReportLinker, 2007).
By shifting currently non-electric loads to the grid, electric vehicles might play a crucial role in
the integration of these two critical elements of the whole energy system: power generation
and transportation. In a scenario where a commitment is made to reduce emissions from
power generation, the build-up of new intermittent power capacity is problematic for the
electric systems operation (Skea, J, et al., 2008) and usually needs large investments in energy
storage. The addition of extra load from electric vehicles in the electricity system can be
challenging, if together both systems are more efficient and able to reduce overall emissions.
Furthermore, for future energy systems, with a high electrification of transportation, Vehicle
to Grid (V2G) concepts can offer a potential storage capacity and use stored energy in
Electric Vehicles – The Benefits and Barriers
136
batteries to support the grid in periods of shortage. By itself, each vehicle is small in its
impact on the power system, but a large number of vehicles could have a significant impact
either as an additional charge or a source of distributed generating capacity (Kempton and
Tomic, 2005a; Kempton and Tomic, 2005b).
This chapter is concerned with studying the potential impacts of the electric vehicles on the
electricity systems, with a focus on the additional power demand, power generation
emissions associated with EVs and the role of demand side management (DSM) strategies in
supporting their penetration as well as the economic impacts of EVs on electric utilities.
The analysis of the impact on the electric utilities of large-scale adoption of plug-in electric
vehicles from the perspective of electricity demand, CO
2
and other green house gas
emissions and energy costs can be studied for two different electric utility´s environments:
A big electric system synchronized with similar systems within the same Continent, and a
small Island, a lower electric isolated system. Each case has very different characteristics the
most important ones are the robustness of the systems, the isolated system needs more
backup power installed and usually has less variety in the production technologies. Other
major difference is that in a small Island, due to its dimension and apartness, there is no
room to run an electricity market, so that the whole service of electricity supply is provided
by a regulated monopoly. These differences have influence on the final electricity price
formation.
Many studies regarding battery electric vehicles and Plug in hybrids are being performed in
different countries. In the US, for instance, the capacity of the electric power infrastructure
in different regions was studied for the supply of the additional load due to PHEV
penetration (Kintner-Meyer et al., 2007) and the economic assessment of the impacts of
PHEV adoption on vehicles owners and on electric utilities (Scott et al., 2007). Other studies
(Hadley, 2006) considered the scenario of one million PHEVs added to a US sub-region and
analyzed the potential changes in demand, impacts on generation adequacy, transmission
and distribution and later the same analysis was extended to 13 US regions with the
inclusion of GHG estimation for each of the seven scenarios performed for each region
(Hadley, 2008). The ability to schedule both charging and very limited discharging of
PHEVs could significantly increase power system utilization. The evaluation of the effects of
optimal PHEV charging, under the assumption that utilities will indirectly or directly
control when charging takes place, providing consumers with the absolute lowest cost of
driving energy by using low-cost off-peak electricity, was also studied (Denholm and Short,
2006). This study was based on existing electricity demand and driving patterns, six
geographic regions in the United States were evaluated and found that when PHEVs derive
40% of their miles from electricity, no new electric generation capacity was required under
optimal dispatch rules for a 50% PHEV penetration. A similar study was made also by
NREL (National Renewable Energy Laboratory) but here the analysis focused only one
specific region and four scenarios for charging were evaluated in terms of grid impact and
also in terms of GHG emissions (Parks et al., 2007). The results showed that off-peak
charging would be more efficient in terms of grid stress and energy costs and a significant
reduction on CO
2
emissions was expected thought an increase in SO
2
emissions was also
expected due to the off peak charging being composed of a large amount of coal generation.
The results obtained in one place on earth cannot be used in other regions only the
methodologies. Apart from reasons that are related to car use habits and roads’ topology,
there is the electricity production source mix that is different from place to place, more
expensive in some places and with more use of renewable sources in others. These
Integration of Electric Vehicles in the Electric Utility Systems
137
differences will also be focused on this chapter and the way they contribute to the EVs’
fuel/energy costs and the emissions balance between the power generation and the road
transportation sectors with electric mobility.
2. Electric utility systems
In this section, a description of the electric power systems demand is done emphasizing its
evolution along a day and the contribution that electric vehicles may have for leveling the
power consumption diagram. Examples of the typical load profiles filled with the different
technologies available (renewable sources, big hydro and thermal units) are presented, as
well as the possible percentage of renewable in the electricity production. Then, the
emissions associated with the electric vehicles’ recharging are accounted.
To study the economic impacts for the two case studies, the different rules for technology
dispatch are described in a market environment and in the case of a traditional integrated
electric system. In this section an explanation of how the price for end consumers (where
electric cars are included) is formed will be done with examples taken from a market
environment and from a vertically integrated company in an isolated Island.
2.1 Electricity demand
Nowadays, electric power systems are designed to respond to instantaneous consumer
demand. One of the main features of power consumption is the difference in demand along
the day hours, the week days and seasons. Fig. 1 shows, as an example, the hourly demand
profiles of the Portuguese electric system. Each curve represents a week of worth data from
four different seasons in 2008 and illustrates the variation in electricity demand. It can be
observed that, in this country, the annual peak demand occurs during winter months
(December or January), in the evening.
Fig. 1. Power demand profiles in Portugal for different seasons
This variation in daily and seasonal demand could mean that there is always some
underutilized capacity that could be used during off peak hours. Looking at average values,
Electric Vehicles – The Benefits and Barriers
138
Fig. 2 presents the evolution of the hourly average power consumption in Portugal over the
24 hours of the day during the whole year 2008. This evolution along the day has
nevertheless a valley during the night that represents about 60% of the peak consumption
and so has great financial consequences with the need of having several power plants that
are useless and an underutilized network during the night. This situation gives the
opportunity for electric vehicles contribution for levelling the power consumption diagram.
Fig. 2. Example hourly average power consumption during (weekdays in Portugal mainland
year 2008)
As an example, Fig. 3 shows the estimated contribution for the power consumption diagram
levelling when considering different levels of the electric vehicles penetration. Portugal
mainland was used as an example and it was considered that 85% of the electric vehicle
charging happens uniformly during the valley hours (from 11pm to 8am) with the rest
charge happening uniformly during the other 14 hours of the day. The extra energy that
each electric vehicle should charge from the grid in average was considered about 2.5MWh
per year, more or less 7kWh per day plus a 10% in transmission losses.
Fig. 3. Electric vehicles contribution to the consumption diagram leveling
Integration of Electric Vehicles in the Electric Utility Systems
139
As can be observed in Fig.3 only with a high penetration of vehicles like ca. 1million units
(almost ¼ of the country’s light duty fleet), the impacts are visible in the consumption
profile. The main question is how to incentivise off-peak charging?
It is easy to foresee major congestion problems in already heavily loaded grids and voltage
profile problems in predominantly radial networks, particularly if the peak load periods
coincide with EV charging periods. Hence, if no load management strategies are defined,
significant technical problems will occur and their drawbacks might even be larger than the
economic/environmental benefits arising from electric vehicles usage (Fig.4).
Fig. 4. Load profile simulation of the peak demand weak for year 2015 with 4, 9 and 17%
light duty fleet replacement with EV’s that recharge at peak hours in Portugal mainland.
The management strategies to prevent peak recharge can be adopted in two ways:
a. By developing a dynamic price signal approach such that EV will charge
predominantly during low energy price/demand moments or
b. By developing a technical management system such that charging can be distributed
during valley hour periods and at times when there is large renewable power
generation.
In a scenario of mass EVs penetration, the recharging profiles are important for the electric
utility system’s sake and their effects on peak consumption, electricity prices and grid
congestion should be carefully foreseen and studied.
2.2 Electric power consumption and power plants technologies
The hourly average power consumption during a day presented in Fig. 2 has an equivalent
diagram when analyzing the distribution during the 24 hours of the day of the annual
energy consumed. Fig. 5 presents this distribution and also the different power technologies
that generated this energy demand.
The great difference between the consumption at valley and at off-valley hours represents a
barrier to the penetration of generation technologies that need to work more hours per year
in order to became economically viable (usually with low unit variable costs but with large
fixed costs) or non dispatchable units (renewable energies).
The effective use of the country´s power plant fleet can be illustrated by the load duration
curve (LDC), where the hourly average power over the whole year is sorted by decreasing
order constituting a curve that begins with the year peak at hour 1 and the smallest demand
at hour 8760 as illustrated in Fig. 6. In this example, the unutilized capacity could be
Electric Vehicles – The Benefits and Barriers
140
annually 4000 GWh. Nowadays some of this capacity is used in pumping during off-peak
hours. In 2008, about 700GWh were used for pumping to provide energy storage in
reservoirs available for the peak hours. Without increasing capacity it would be possible to
account with around 3000 GWh a year for extra off-peak loads that could be used in plug-in
electric vehicles’ recharging. Considering a 3MWh/year of extra energy needed to charge an
EV, it is possible to have one million EVs charging their batteries during valley hours,
without any more investments in power installed and transmission lines.
Fig. 5. Example of hourly energy consumption with used power plants technologies
Fig. 6. Load duration curve for Portugal in year 2007
In addition to the fixed costs associated with underutilized capacity, the significant
cycling that occurs on a daily basis creates additional costs for plants due to the constantly
varying loads that could require generators to operate well below the “design point” of
optimum efficiency. Power plant cycling also increases operation and maintenance
requirements.
Integration of Electric Vehicles in the Electric Utility Systems
141
This last situation is more visible for instance at St. Miguel Island in Azores, where the
geothermal energy production (renewable energy without CO
2
emissions that should be
used as base load due to its impossibility of production variation) penetration is limited by
the valley consumption. If base load electricity generation is much higher than actual
demand, excess electricity will be wasted unless it is coupled to a storage system. This is an
example, where the use of EVs, charged during off-peak hours, allow the development of a
production technology from a renewable, endogenous source, with no CO
2
emissions,
against the systematic fuel imports (for vehicles and for electricity production).
S. Miguel has 27MW of existing geothermal capacity and the government wants to expand
this capacity to meet future demand. Expanding existing capacity would mean that
geothermal production will meet 40MW (EDA 2009). Current base load electricity demand
is nowadays less than 40MW (Fig.7).
There is the possibility of increasing the geothermal capacity in 3MW by 2011 and 10MW in
2013, but these investments are limited by the off-peak demand. Even considering a demand
increase of 4% for years 2010 to 2013, there is not enough off-peak demand to fill the valley
and at the same time assure at least a 10% of fuel power to prevent any shortage of the
renewable energy sources.
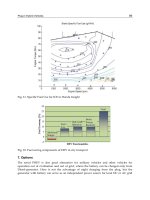
Fig. 7. Typical Winter Power consumption diagram at the S. Miguel Island, Azores, Portugal
As stated in last section, the fact that the valley demand, in this case, is about half the value
of peak demand, gives the opportunity for electric vehicles contribution for levelling the
power consumption diagram. The extra demand for charging the vehicles at each hour of
the day is computed using equation 1.
arg
arg
1
Vavg loss ch e
i
ch e
Epp
PN
h
(1)
Where E
Vavg
is the daily average energy needed for charging a vehicle, p
loss
is the percentage
of energy lost in the transmission lines, p
charge
and h
charge
are respectively the percentage that
is charged in each period (valley and off-valley) and the length of the considered period (in
hours) and N the number of vehicles.
Electric Vehicles – The Benefits and Barriers
142
Considering that 85% of the vehicles will uniformly recharge at night, the introduction of
these vehicles will create and additional electricity demand that, in the context of today’s
electricity generation mix, will be fulfilled by the running fuel oil power plants (Fig. 8).
As expected, the percentage of renewable energy decreases and in terms of marginal
emissions, they are simply being transferred from the tail pipes to the fuel power plants
chimneys.
Considering an emissions rate of 830gCO
2
/kWh for the fuel power plants, the additional
CO
2
emissions to daily charge EVs (an extra energy of 86MWh), should be 71.4 tons of CO
2
.
The TTW daily emissions avoided if these same vehicles were conventional was about 120
tons.
Fig. 8. Load profile in S. Miguel for Winter season with EVs extra demand (30% of Light
Duty fleet replaced for EVs)
However, if additional renewable electricity installed capacity is deployed, then the vehicles
will also be running on renewable electricity. It can be considered that these EVs charged
during off-peak hours are charged 100% with renewable energy. In fact there are three
possible approaches:
1. It is considered the EVs as marginal load and as stated in Fig. 8, the energy and
emissions associated with EVs charging would be mainly on fuel.
2. It is considered the EVs as a base load because they justify the increase in renewable
base load generation and the energy and emissions associated with EVs are from
renewable sources (zero emissions).
3. It is considered the EVs equal to the other load and the energy and emissions associated
to EVs charging would be an average of the production mix. In this case the emissions
associated with EVs recharging is as stated by equation 2
EV
EV TOTAL
TOTAL
Demand
Emissions Emissions
Demand
(2)
These different approaches will lead to different CO
2
emissions associated to EVs’ recharge
(in this example, 8% of total daily electricity consumption).
Integration of Electric Vehicles in the Electric Utility Systems
143
In the first case, a daily 71.4 tons of CO
2
emissions for EVs recharge under the considered
scenario of EV penetration, in the second case, a daily zero emissions for EVs recharge and
in the third case a 37 tons.
It is possible to see in Fig. 9, for instance for the typical Spring load profile that the new
geothermal plus wind power penetration are not possible unless they increase valley
consumption.
Fig. 9. Expected load profile in S. Miguel for Spring (2013), 4% demand increase, 9 MW of
wind, 13MW of new geothermal power and 30% LD fleet replacement by EVs.
The CO
2
emissions factors, unit consumption and daily usage of vehicles considered in this
analysis are resumed in Table 1.
CO2 Emissions Unit Consumption Daily
kg/litre kg/kWh litres/100km kWh/100km kg/kWh km
ICEV Gasoline 2.31 7 32
ICEV Diesel 2.68 6 32
Fuel Plants 0.83 0.25
EV 123 32
Table 1. Emission factors considered for the LD fleet and fuel power plants and average unit
energy consumption.
It is easy to see that even considering that EVs are recharged by fuel, there are advantages in
the CO
2
emissions balance, as the daily 120 tons from the car tail pipes, are replaced by 72
tons in the fuel power plants chimneys. Although the correct mode is to attribute emissions
for the percentage of electricity consumption to EVs’ recharge, and that is only 37 tons.
2.3 Electricity costs
Electricity supply is considered a service of general economic interest. In the past, the
electricity industry was organized as vertically integrated state-owned monopolies and
consequently not subjected to the normal rules of competition. The liberalization process
was put into force in many countries including in the European community (EC) in 1996 by
Directive 96/92/EC, and led to the unbundling of activities. This directive defined common
rules for the gradual liberalization of the electricity industry with the objective of
Electric Vehicles – The Benefits and Barriers
144
establishing one common European market. Vertically integrated utilities have been
vertically separated or unbundled and barriers to entry in generation and retailing were
being removed to create competition.
In the two case studies presented in this chapter, two situations are analyzed: In the case of a
small isolated system, a vertically integrated company is considered and the average unit
production costs are used to define the merit order for technology dispatch. In the case of a
continental European country, the marginal production costs are used to provide a supply
curve and schedule the technology dispatch and find the wholesale price by market
simulation.
2.3.1 Average unit production costs and rules for technology dispatch
The unit average cost for each technology is an average value that contains many
simplifications. The cost functions are not linear and the average costs depend highly on the
performance points in which the plants usually work. There are also the start-up costs
(higher if there is a cold start) that should increase unit average cost if the plants don’t work
in a continuous state. In a monopoly context, the unit commitment service is centrally
provided by the system operator as all the units belonged to the same company. In a market
context this decisions are private and individual companies will predict the price of energy
for the time under consideration and will then incur the cost of starting up if they expect to
make a profit.
In this case, simple empirical rules are applied to distribute the energy source technologies
to provide for the different scenarios of daily load profile. The rules used to order the power
technologies that support expected demand plus EVs consider:
1. The special producers either renewable or thermal (special producers like cogeneration)
are the first in order;
2. The cheaper technologies follow afterwards. For each case, the cheaper technologies
enter in increasing cost order until a certain percentage of the power installed is used
and only then follows the next technology;
3. Production from reservoirs are used only in peak hours;
In any case the technical limits of each group committed to electricity production should be
taken into account. In this case the imposed limitation is made by the power installed in
each technology.
In the S. Miguel (Azores) case study, as a volcanic Island, the renewable source is mainly
geothermal. Geothermal power plants are characterized by high capital investments for
exploration, drilling wells and plant installation but low cost for operation and maintenance,
so that they should be considered base load plants.
The unit costs per technology, considered in this example are described in Table 2 and the
unit average production cost depends on the electricity mix. In table 2 there are two
examples of electricity production mix and the associated average production costs. It is
easy to see that the use of more fuel power plants instead of geothermal ones makes the unit
variable costs higher due to fuel cost. Fuel prices tend to increase because of world oil
demand increase and it must also not be forgotten that, associated to fuel plants use, there
are the CO
2
emission costs that also tend to increase due to increasing environmental
concerns.
It is also easy to see that the available technologies for electricity production make electricity
costs expensive in S. Miguel Island. This has to be added to the fact that, an isolated system
Integration of Electric Vehicles in the Electric Utility Systems
145
needs more redundancy and power installed in thermal plants to assure a high level of
security of supply. This also increases fixed costs (the cost of power assurance).
Production
Technology
Unit costs
€/MWh
Production
scenario 1
Production
scenario 2
Geothermal 33 37% 51%
Wind 82 4% 4%
Hydro 80 3% 3%
Fuel 100 56% 42%
Average unit prod. cost (€/MWh) 74 65
Table 2. Unit average costs per technology, percentage of production scenarios and unit
average production costs.
Added to the production costs there are also the costs associated to transmission lines use.
Customers have to pay for the net’s investments and maintenance and at the end for the
service of distribution, accounting and billing. As all these services are supplied for the same
vertically integrated company in a monopoly context, the final prices that end customers
have to pay for electricity supply are regulated.
The impact EVs have on overall costs, depend on the additional variable cost associated
with generating more electricity to serve the Plug-in vehicles’ charging. Average variable
costs may rise with increased electricity sales because higher cost generation plants are
brought to service. Assuming though, no new infrastructure investment, average fixed
costs will decrease, because the existing debt-service obligation is spread over more
energy sold.
The time of vehicles charging is crucial for this analysis. An off-peak recharge can, in this
example increase the penetration of geothermal power, decrease variable unit costs and
fixed unit costs while at the same time reduces emissions and fuel oil consumption and
imports.
2.3.2 Marginal production costs and rules for technology dispatch
To use the marginal production costs to schedule technologies to the expected load, a
market simulation can be done with the demand and supply curves interception. A supply
curve per technology should be generated. These curves should be added to generate a
whole supply curve. Supply curves per technology are generated based on the expected
power installed per technology and the supply curves verified in the past. As an example it
can be observed the supply curves for the Portuguese units for the different technologies
that play in the Iberian Electricity (MIBEL) spot market. In Fig.10 is an example of the
supply curves per technology that occurred in two winter days, (2009/01/12) at 12h and
(2010/01/19) at 22h.
The supply curves in 2010 (the right hand side graphic in Fig. 10) show very low priced bids
in hydro due to climate influence and also some low priced bids in natural gas due to more
available supply (860MW were installed in the production system during the year 2009).
Electric Vehicles – The Benefits and Barriers
146
Fig. 10. Supply curves per technology for day 22 Jan 2009 at 12h and 19 Jan 2010 at 22h in the
Portuguese market
The supply curves to be generated would represent different scenarios according to the
expected power installed per technology, a dry or wet year scenario and the season. There
are in the majority of the cases, 2 steps in the supply curves for each technology. The
amplitude of the slops depends on the hydrologic conditions of the hydro resources and the
natural gas availability. If there is too much of these resources, low priced platforms are
expected at the beginning of the supply curves as observed for year 2010 in Fig. 10. The
power where the steps occur and its amplitude depends on the power installed in the
technology, the climate conditions scenarios, season and hour of the day. The rules for
supply curves generation are the following:
1. There are four cases of supply curves per technology associated with each season
(Spring, Summer, Autumn or Winter);
2. The expected power installed in each technology in the year in study is an input that
limits power generation;
3. The scenarios to be studied (a dry year with high priced hydro resources or a wet year
with low priced hydro and natural gas offers) are inputs that lead to different supply
curves shape;
4. Two or three slops are generated for each technology with more or less the same shape
of the past supply curves observed as seen in Fig. 10.
5. According to the scenario studied, the season and power installed, the slops of the
supply curves are generated with the same shapes of past technology’s supply curves
observed in similar conditions. A small randomness that represents the observed
variations is also programmed.
6. The supply curves generated for each technology are added in ascending order of price
to form a global supply curve that will intersect demand.
An example of supply curves for year 2020 in Portugal mainland can be seen in Fig. 11.
In this case, the rules for technologies dispatch are:
1. The special producers either renewable or thermal (special producers like cogeneration)
are the first in order;
2. The technologies with lower marginal costs follow afterwards. For each hour, according
to demand level, the intersection gives market price and quantity per technology that
will fulfill the daily load profile.
In this case, the wholesale electricity price is formed by supply and demand curves
intersection. An increase in demand makes demand curve shift to the right and so electricity
prices rise as the curves intersection occurs at a higher point in the slop. As an example, it is
Integration of Electric Vehicles in the Electric Utility Systems
147
possible to see price formation for instance in hour 5, in the Portuguese sub-market, for the
23th Jan 2008 with the real data available at Market operator (OMEL 2009) site. It is possible
to see the effects of an increase in off-peak load to plug-in vehicles recharging, in the market
prices. As an example, considering that a huge amount of EVs were charging at this hour (5
a.m.) with an extra 800 kW power demand. The demand curve shifts to the right (Fig. 12).
The price rises for almost three cents and some of the previous low cost clients (the pumping
charges) were not supplied because they had lower priced buying bids.
Fig. 11. Scenario of supply curves per technology for year 2020 in the Portuguese market
Fig. 12. Price formation in the Portuguese sub-market at hour 5 (economic simulation) and
the effect of an extra 800MW of power for EV off peak recharge has in the market price.
The leveling of load profile may have the consequences of making the hydro-pumping less
profitable. In fact, the reversible hydro plants’ profits come from the discharging and selling
at peak prices revenues less the costs from pumping with energy bought with off-peak
prices. The following relation must occur:
Electric Vehicles – The Benefits and Barriers
148
p
eak
p
eak o
ff p
eak o
ff p
eak
p
EE
(3)
Where
peak
,
off-peak
represent the peak and off-peak prices, E
peak
, E
off-peak
the peak energy sold
when discharging and the off-peak energy bought for pumping and
p
the total
performance of the hydro reversible system.
2.3.3 Electricity costs for end consumers
Over the wholesale prices, there come the net access prices. The national regulator
establishes the access and pricing rules of the transmission and distribution activities. The
revenues for transmission and distribution network’s operators are assured by the payment
of a use tariff. The transmission and distribution network use tariffs are established by the
regulator. In Table 3 there is the peak and off peak low voltage net access tariffs imposed in
Portugal in the last years.
Low voltage net access
tariffs
2008 2009 2010 2011
Peak [cents/kWh]
Off peak [cents/kWh]
7.45
3.28
5.39
0.68
9.09
3.76
8.92
3.86
Table 3. Evolution of low voltage net access regulated tariffs in Portugal
Apart from the networks access regulated tariffs and wholesale prices, consumers should
have to pay also retailing electricity costs. These activities work in competition as the
established model imposed the existence of electricity wholesale and retail markets and the
possibility for any customer to choose between different retailers. Depending on the retailer
that each end consumer chooses, the cost of electricity to be paid by consumers should
include the cost that the retailer paid for the energy at the wholesale electricity market plus
the value of the regulated net access tariffs plus the revenue for the retailer. Considering a
4% on the wholesale electricity cost for the retailer revenue and the values presented in
Table 3, Fig. 13 depicts the evolution of the final cost of energy that a low voltage domestic
consumer should pay along the day.
Fig. 13. Average daily evolution for final costs of energy for a domestic consumer in 2009