Ferroelectrics Applications Part 2 pptx
Bạn đang xem bản rút gọn của tài liệu. Xem và tải ngay bản đầy đủ của tài liệu tại đây (3.35 MB, 23 trang )
Ferroelectrics - Applications
12
0.0
50.0
100.0
150.0
200.0
250.0
20.00 25.00 30.00 35 .00 4 0.00 45.00
Ti (m o l%)
T e m perature (℃)
Pseudo-cubic
Tetragonal
Cubic
(110) (100)
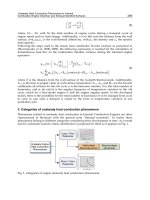
Fig. 10. Phase diagram of Pb(Mg
1/3
Nb
2/3
)O
3
-PbTiO
3
single crystals grown by a solution
Bridgman method.
3.1.2 Impedance response analysis of giant k
31
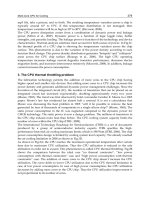
Figures 11(a), (b) and Figs. 12 (a), (b) show the frequency responses of impedance on the
fundamental k
31
modes and up to 500 kHz in the cases of (100) and (110) PMNT single-
crystal plates poled at 40 ºC, E=1000 V/mm and 10 min. The values of k
31
in (100) and (110)
PMNT single-crystal plates were 42.6% and 84.6% (giant k
31
), respectively. The k
31
fundamental and its overtones were observed to have complicated spurious responses in
(100) PMNT in Fig. 12(a). However, the k
31
fundamental and its 3rd, 5th, 7th and 9th
overtones were confirmed not to have spurious responses in (110) PMNT with giant k
31
in
Fig. 12(b), and were also confirmed the frequency responses of impedance in (100)
PZNT91/09 single-crystal plates with giant k
31
. Therefore, it is found that a single vibration
was generated in the direction of the length (L). In order to clarify the resonance response
near 300 kHz [inside the ellipse in Fig. 12(b)], the original single-crystal plate
(13
L
x4.0
W
x0.47
T
mm) was cut to the small plate dimensions (0.97
L
x4.0
W
x0.47
T
mm). The k
32
in
Frequency (kHz)
Phase (deg)
Impedance (Ω)
40 6050 70 80 90
50−
100−
0
100
50
2
10
3
10
4
10
10
(a)
50 7060 80 90 100
2
10
3
10
4
10
5
10
10
50−
100−
0
100
50
Frequency (kHz)
Phase (deg)
Impedance (Ω)
(b)
Fig. 11. Impedance and phase responses of the fundamental k
31
mode in (a) (100) and (b)
(110) PMNT single-crystal plates.
Giant k
31
Relaxor Single-Crystal Plate and Their Applications
13
0200100 300 400 500
Impedance (Ω)
10
2
10
3
10
4
10
6
10
Frequency (kHz)
0200100 300 400 500
Impedance (Ω)
2
10
3
10
4
10
5
10
10
Frequency (kHz)
5
10
k
31
3rd
(a)
(b)
k
31
fundamental
5th
5th
k
31
3rd
k
31
fundamental
k
32
fundamental
7th
9th
k
32
fundamental
7th
9th
0200100 300 400 500
Impedance (Ω)
10
2
10
3
10
4
10
6
10
Frequency (kHz)
0200100 300 400 500
Impedance (Ω)
2
10
3
10
4
10
5
10
10
Frequency (kHz)
5
10
k
31
3rd
(a)
(b)
k
31
fundamental
5th
5th
k
31
3rd
k
31
fundamental
k
32
fundamental
7th
9th
k
32
fundamental
7th
9th
Fig. 12. Frequency responses of impedance in fully poled (a) (100) and (b) (110) PMNT
single-crystal plates (DC poling conditions: 40 ºC, 1000 V/mm, 10 min).
the width (W) direction was 69%, which was calculated from the resonance response of the
small plate. Furthermore, the frequency constants on the k
31
(length direction) and k
32
(width direction) modes became 680 Hz·m and 1425 Hz·m, respectively. Consequently, it
was found that the (110) PMNT single-crystal plate with giant k
31
possessed an anisotropy in
the frequency constant on the 13
L
x4.0
W
mm plate and consisted of a mono-domain as in the
case of the (100) PZNT91/09 single-crystal plate with giant k
31
.
3.1.3 Relationship between crystal plane and poling direction
The mechanism for realizing giant k
31
can be explained by using the crystal plane and poling
direction. Figure 13 shows the relationship between the crystal plane, which determines the
direction of the spontaneous polarization, and the poling direction in (100) and (110) PMNT
single-crystal plates. While applying the poling field to the (100) PMNT single-crystal plate
at a poling temperature of 40 ºC (pseudo-cubic phase), the poling field only acts to expand
the x-axis in the direction of the poling field. In the (110) PMNT plate, the poling field acts to
generate strain via the expansion of the x and y-axes (Fig. 13), which moves the ferroelectric
domains on the (110) plane. While the domain structure on the (110) plane became singular
due to the generated strain, it is thought that the anisotropy of the frequency constants on
the k
31
and k
32
modes appeared and the giant value of the k
31
mode in (110) PMNT was
achieved through the poling process.
z
x
y
z
x
y
110) PMN
T
Giant
k
31
Pseud
o
-
cubi
c
↓
”
Move
p
lane
”
x
z
(100) PMN
T
y
x
z
y
Pseudo-cubic
↓
”Expand axis”
Poling
direction
Spontaneous
polarization
Pb (A ion
)
Zn, Mg, Nb, Ti
(B ion)
Crystal
plane
Fig. 13. Relationship between crystal plane, direction of the spontaneous polarization and
poling direction in (100) and (110) PMNT single-crystal plates at 40 ºC (pseudo-cubic phase).
Ferroelectrics - Applications
14
Table 2 shows the values of k
31
, k
32
, d
31
and d
33
constants in PMNT and PZNT single-crystal
plates with various crystal planes. Although giant k
31
and d
31
constant were obtained in the
(110) PMNT plate, a large d
33
constant (2420 pC/N) was realized in the (100) PMNT plate.
On the other hand, giant k
31
, d
31
constant, and large d
33
constant (2400 pC/N) were obtained
simultaneously in the (100) PZNT91/09 plate. Therefore, it was clarified that giant k
31
, d
31
and d
33
constants appeared in the peculiar combination of the crystal plane and poling
direction in the relaxor single crystals. Moreover, there was anisotropy on the k
31
(length
direction) and k
32
(width direction) modes in (110) PMNT with giant k
31
as well as in (100)
PZNT with giant k
31
.
Crystal
plane
Single
crystal
k
31
(%)
-d
31
(pC/N)
k
t
(%)
d
33
(pC/N)
k
32
(%)
Pr
(μC/cm
2
)
Ec
(V/mm)
Aging
(100) PZNT 86 2100 55 2400 42 35 600 Good
(100) PMNT 65 1030 60 2420 22 300 NG
(110) PZNT 30~60 300~720 40 530~1030 NG
(110) PMNT 87 1320 48 970 69 30 200 Good
(111) PZNT 20 ~170 50 190~560 Good
Table 2. Giant k
31
and d
31
constant in PMNT and PZNT single-crystal plates with various
crystal planes. k
t
is the coupling factor of thickness vibration in a plate, and piezoelectric d
33
constant was measured with a d
33
meter.
In conclusion of this part, giant k
31
over 86% in (110) PMNT single-crystal plates was
realized in order to control the relationship between the crystal plane, which determines the
direction of the spontaneous polarization, and the poling direction. The plate with giant k
31
shows the impedance responses with a single vibration generated in the length direction. It
is thought that the origin of giant k
31
is the mono-domain structure in the plate.
3.2 Chemical composition dependnce of ginat k
31
in PMNT single-crystal plates
A giant electromechanical coupling factor of k
31
mode of more than 86% was found for (100)
Pb[(Zn
1/3
Nb
2/3
)
0.91
Ti
0.09
]O
3
(PZNT91/09) single-crystal plates (13
L
x4.0
W
x0.36
T
mm) and (110)
Pb[(Mg
1/3
Nb
2/3
)
0.74
Ti
0.26
]O
3
(PMNT74/26) single-crystal plates (13
L
x4.0
W
x0.47
T
mm) poled in
the [001] and [110] directions, respectively. In this part, the chemical composition
dependence of k
31
mode in PMNT single-crystal plates with (110) plane is investigated in
detail and furthermore, the relationships between the crystal phase after poling and giant k
31
are clarified.
3.2.1 Ti composition dependence of ginat k
31
The (110) PMNT(1-x)/x (x=0.251~0.301) single-crystal plates in this study have pseudo-
cubic phase before poling below 100 ºC (x=0.25) and 90 ºC (x=0.30). Figure 14 shows the
relationships between relative dielectric constant (ε
r
) before and after poling [Fig. 14(a)], k
31
and the frequency constant (half the bulk wave velocity) of k
31
mode (fc
31
) [Fig. 14(b)], and
the electromechanical coupling factor of the thickness vibration mode of the plate (k
t
) and
frequency constant of k
t
mode (fc
t
) [Fig. 14(c)] versus Ti composition (x) in (110) PMNT(1-
x)/x single-crystal plates. Although ε
r
(○) in (110) PMNT is almost constant and abruptly
increases for x>0.293 before poling, ε
r
(●) after poling is divided into four groups 1~4: group
1 (x=0.251~0.255), group 2 (x=0.269~0.279), group 3 (x=0.291~0.293) and group 4
Giant k
31
Relaxor Single-Crystal Plate and Their Applications
15
(x=0.296~0.301) in Fig. 14(a). Since the groups of ε
r
correspond to the groups of the domain
structure, it was thought that the PMNT single-crystal plates processed different domain
structures in each group after DC poling. On the other hand, k
31
increases with an increase
in x and reaches a maximum of 92% at x=0.291. After that, k
31
suddenly decreases with x as
shown in Fig. 14(b). The fc
31
also has four groups and shows an opposite tendency
compared with k
31
vs x. This means that higher k
31
is obtained for lower fc
31
, because the
decrease in the number of domain boundaries through the improvement of the poling
process in the single-crystal plates leads to a decrease in stiffness. Since k
t
and fc
t
are
independent of x in Fig. 14(c), the domain structures are almost the same in the thickness
direction of the plates. Therefore, the chemical composition dependence of ε
r
after poling,
k
31
and fc
31
appears to be dependent on the domain structure in the plate (13
L
x4.0
W
mm).
0
2000
4000
6000
8000
24 25 26 27 28 29 30 31
Ti (mol%)
ε
r
After poling
Before poling
1
2
3
4
(a)
0
20
40
60
80
100
24 25 26 27 28 29 30 31
Ti (mol%)
k
31
(%)
0
280
560
840
1120
1400
fc
31
(Hz
・
m)
k fc
1
1
2
2
3
3
4
4
31
31
(b)
0
10
20
30
40
50
60
24 25 26 27 28 29 30 31
Ti (mol%)
k
t
(%)
0
500
1000
1500
2000
2500
3000
fc
t
(Hz
・
m)
k fc
tt
(c)
Fig. 14. Ti composition dependence of (a) ε
r
before and after poling, (b) k
31
, fc
31
and (c) k
t
, fc
t
in PMNT(1-x)/x single-crystal plates.
Ferroelectrics - Applications
16
3.2.2 Impedance response analysis of ginat k
31
Figure 15 shows the frequency responses of impedance to 500 kHz in the cases of groups
1~4 in Fig. 14. The k
31
fundamental and their odd-number overtones of 3rd, 5th, 7th and 9th
with the k
32
fundamental vibration (width direction) were confirmed without spurious
responses in groups 1~3 in (110) PMNT with giant k
31
, as well as the frequency response of
impedance in the (100) PZNT91/09 single-crystal plate with giant k
31
. However, the k
31
fundamental and their overtones were observed with complicated spurious responses in
group 4 in the (110) PMNT with k
31
=60%. Therefore, it was found that a single vibration is
generated in the direction of the length (L) in the (110) PMNT with giant k
31
, similar to the
case of the (100) PZNT91/09 single-crystal plate with giant k
31
.
Fig. 15. Frequency responses of impedance in fully poled (110) PMNT(1-x)/x single-crystal
in cases of (a) group 1, (b) group 2, (c) group 3 and (d) group 4 (●1: k
31
fundamental
vibration, ●3-9: k
31
odd-number overtones, ○1: k
32
fundamental vibration; DC poling
conditions: 40ºC, 1000 V/mm, 10 min).
3.2.3 Crystal phase to realize ginat k
31
A mechanism to realize giant k
31
can be explained by the crystal plane, which strongly
affects the direction of the spontaneous polarization and poling direction. Giant k
31
in
relaxor single-crystal plates can be achieved when the poling field generates sufficient
strain to move the ferroelectric domains in the plates (13
L
x4.0
W
mm), not merely to
expand the spontaneous polarization axes in the direction of the poling field. We will
Giant k
31
Relaxor Single-Crystal Plate and Their Applications
17
discuss in detail the relationships between crystal planes, spontaneous polarization axes
and poling direction in (110) PMNT single-crystal plates (groups 1~4) in comparison with
the cases of (100) and (110) PZNT91/09 single-crystal plates (see Fig. 27 in the paragraph
4.2.3). Furthermore, it will be clarfied that the crystal phases after poling can be estimated
by the value of k
31
and the combination between the directions of the spontaneous
polarization axes and the poling field, which generates the strain sufficient to move the
domains in the plates.
In conclusion of this part, giant k
31
of more than 80% in (110) PMNT single-crystal plates
was clarified to possess Ti composition dependence. The frequency response of impedance
in (110) PMNT single-crystal plates with giant k
31
was composed of a single vibration in the
length direction. In addition, the domain movement to realize giant k
31
in the crystal plate
was due to the combination between the direction of the spontaneous polarization and the
poling direction.
4. Other characteristics investigation
The giant k
31
and d
31
constant in the PZNT91/09 and PMNT(1-x)/x single-crystal plates
were due to the generation of a single vibration in the length direction. However, there is as
yet no evidence of the close relationship between the mono-domain plate with a giant k
31
,
which means a single vibration body, and the single vibration in the plates measured from
the impedance response.
Furthermore, the P-E hysteresis loops and the relationship to electric field (E) vs strain
measurement were investigated from the viewpoints of giant k
31
.
4.1 Frequency response analysis by finite element method in relaxor single-crystal
plates with ginat k
31
In this part, the frequency response analysis of impedance on the giant k
31
mode is
evaluated by a finite element method (FEM) in order to characterize the mono-domain
plates. Since the number of ferroelectric domains in the plates corresponds to the number of
piezoelectric vibration bodies, the frequency response analysis by FEM was applied to the
evaluation of their domain structures. Moreover, the domain behavior of the PZNT91/09
single-crystal plates is also investigated by FEM, particularly focusing on the 3rd overtone of
the k
31
fundamental vibration.
4.1.1 FEM application
Resonators composed of relaxor single-crystal plates, the dimensions of which are
13
L
x4.0
W
x0.36
T
mm, with a giant k
31
in PZNT91/09 with the (100) plane and PMNT74/26
with the (110) plane
were analyzed using a commercial analysis program (ANSYS) by FEM.
For the FEM simulation, an electric field of 1.0 V/mm to simulate the impedance responses
was added in the thickness direction of the plate resonators because the actual voltage to be
measured was 0.5 V by the impedance analyzer. The material constants obtained from the
measured and reference data on the relaxor single crystals were used to calculate the
impedance responses. The numbers of the elements and nodes for FEM were 800 pieces and
4271 points, respectively. Piezoelectric equations were applied to the orthorhombic phase.
Furthermore, Poisson ratio in the length direction (k
31
mode) and width direction (k
32
mode)
Ferroelectrics - Applications
18
was measured from the impedance responses by single-crystal plate resonators with
different dimensions. In order to evaluate domain structures in the single-crystal plates, the
relationships between the number of domains in the PZNT91/09 single-crystal plates and
the 3rd overtone splitting of the k
31
fundamental vibration were also investigated by FEM
simulation.
Table 3 shows the coupling factors of k
31
, k
32
and their frequency constants (fr x L or W,
where fr is the resonant frequency) of fc
31
, fc
32
in the relaxor single-crystal plates with a giant
k
31
of more than 80%. The values of σ
W
E
/σ
L
E
in Table 3 were calculated from the elastic
compliance of s
11
E
and s
22
E
because σ
L
E
=-(s
12
E
/s
11
E
) and σ
W
E
=-(s
12
E
/s
22
E
), where σ
L
E
and σ
W
E
are the Poisson ratios in the directions of length (13 mm) and width (4 mm), respectively. In
the simulation, σ
W
E
/σ
L
E
was used to evaluate the crystal anisotropy of the relaxor single
crystals, because of the difficulty in measuring the values of s
12
in the single crystals. It was
confirmed that there are large crystal anisotropies of s
11
E
and s
22
E
between the L and W
directions and large differences in σ
W
E
/σ
L
E
of 3.4 (PZNT91/09) and 4.5 (PMNT74/26),
respectively.
single
crystal
k
31
(%)
k
32
(%)
fc
31
(Hz·m)
fc
32
(Hz·m)
s
11
E
(10
-12
m
2
/N)
s
22
E
(10
-12
m
2
/N)
σ
W
E
/σ
L
E
PZNT91/09 86 42 520 830 110 32 3.4
PMNT74/26 87 69 683 1425 67 15 4.5
Table 3. Material constants of relaxor single-crystal plates with giant k
31
.
Although the values of k
t
(coupling factor of plate thickness vibration) and fc
t
(frequency
constant of the k
t
mode) of the PZNT91/09 and PMNT74/26 single-crystal plates with a
giant k
31
were 57, 49% and 2087, 2588 Hz・m, respectively, it was thought the crystal
structure of the plate resonators after DC poling becomes a field-induced phase such as
the orthorhombic phase, because of the anisotropy of the bulk wave velocities (twofold
the frequency constant) in the length (L=13 mm), width (W=4.0 mm) and thickness
(T=0.36 mm) directions. Furthermore, a giant k
31
could be obtained only in the
orthorhombic phase after DC poling from the relationships between the directions of the
spontaneous polarization and DC poling field to move domains in the plate (13
L
x 4.0
W
mm).
4.1.2 Simulation of k
31
and k
32
modes by FEM
The change in the values of σ
W
E
and σ
L
E
affected the frequency response of impedance on k
31
fundamental vibration, the overtones, and k
32
fundamental vibration in the frequency range
of 0~500 kHz. The simulated response at σ
W
E
/σ
L
E
=3.2 (σ
L
E
=0.089, σ
W
E
=0.29) and s
12
E
=-10
(10
-12
m
2
/N) was well fitted to the measured responses, as shown by the arrows in Fig. 16, in
the case of the PZNT91/09 single-crystal plate. The simulated data at σ
W
E
/σ
L
E
=4.9
(σ
L
E
=0.041, σ
W
E
=0.20) and s
12
E
=-3 (10
-12
m
2
/N) in the PMNT74/26 single-crystal plates also
showed the same result (Fig. 17). In the calculations, the values of s
12
E
were chosen to fit the
simulated responses to the measured responses. Moreover, the Poisson ratio affected the
value of k
31
as well as the frequency response of impedance.
Giant k
31
Relaxor Single-Crystal Plate and Their Applications
19
0 100200300 400500
F requency (kHz)
10
1
10
2
10
3
10
4
10
5
01
0
Impedance (Ω)
10
1
10
2
10
3
10
4
10
5
(a)
k31 fundamenta l
3
rd
overtone
5
th
k
32
fundamental + 7
th
9
th 11
th
13
th
(b )
k
31
fundamental
3
rd
overtone
5
th
7
th
9
th
11
th
k32 fundamental
Fig. 16. Frequency responses of impedance on k
31
and k
32
modes in PZNT91/09 single-
crystal plates; (a) measured and (b) simulated data.
0 100 200 300 400 500
F requency (kHz)
(b )
10
1
10
2
10
3
10
4
10
-1
01
0
Impedance (Ω)
10
1
10
2
10
3
10
4
10
5
(a)
k
31 fund amenta l
3
rd
overtone
5
th
k
32
fundamental + 7
th
9
th
k31 fundamental
3
rd
overtone
5
th
7
th
9
th
k
32
fundamental
Fig. 17. Frequency responses of impedance on k
31
and k
32
modes in PMNT74/26 single-
crystal plates; (a) measured and (b) simulated data.
4.1.3 Simulation of k
t
mode by FEM
The impedance responses up to 30 MHz in Fig. 18 were calculated in the PZNT91/09 single-
crystal plates at σ
W
E
/σ
L
E
=3.2, σ
L
E
=0.045-0.13, and σ
W
E
=0.15-0.41. The k
t
fundamental
vibration and the 3rd and 5th overtones of the k
t
fundamental vibration were observed
between σ
L
E
=0.063-0.11 and σ
W
E
=0.20-0.35. In particular, sharp responses of the k
t
fundamental vibration and the 3rd overtone were obtained between σ
L
E
=0.080-0.098 and
σ
W
E
=0.26-0.32. The simulated coupling factor of k
t
=64% was higher than that of k
t
=57%
calculated from the measured response. It was clarified that the large difference in
σ
W
E
/σ
L
E
=3.2 and the suitable values of the elastic compliance, particularly -s
12
E
=9-11 (10
-12
m
2
/N), were key factors for the appearance of the k
t
fundamental vibration and overtones.
Ferroelectrics - Applications
20
The simulated response of the PMNT74/26 single-crystal plates is shown in Fig. 19 at
σ
W
E
/σ
L
E
=4.9 (σ
L
E
=0.041, σ
W
E
=0.20) and s
12
E
=-3 (10
-12
m
2
/N). The fundamental k
t
mode
(k
t
=65%) and the 3rd overtone were observed independent of -s
12
E
values between 1~7 (10
-12
m
2
/N). In the calculations, the values of -s
12
E
were chosen at a Poisson ratio (σ
W
E
) within
0~0.5.
0 5 10 15 20 25 30
Frequency (MHz)
k
t
fundamental
Impedance (Ω)
(a)
(b)
10
1
10
2
10
3
10
4
01
0
10
5
3
rd
overtone
5
th
overtone
k
t
=64%
Fig. 18. Frequency responses of impedance on k
t
mode in PZNT91/09 single-crystal plates;
calculation for (a) σ
W
E
/σ
L
E
=3.2 (σ
L
E
=0.13, σ
W
E
=0.41)/ s
12
E
=-14 (10
-12
m
2
/N) and (b)
σ
W
E
/σ
L
E
=3.2 (σ
L
E
=0.089, σ
W
E
=0.29)/ s
12
E
=-10 (10
-12
m
2
/N).
0 5 10 15 20 25 30
Frequency (M Hz)
10
1
10
2
10
3
01
0
10
-1
k
t
fundamental
3
rd
overtone
Impedance (Ω)
k
t
=65%
Fig. 19. Frequency responses of impedance on k
t
mode in PMNT74/26 single-crystal plates;
calculation for σ
W
E
/σ
L
E
=4.9 (σ
L
E
=0.041, σ
W
E
=0.20) and s
12
E
=-3 (10
-12
m
2
/N).
Figure 20 shows the impedance and phase responses of k
t
fundamental vibration in the
PZNT91/09 single-crystal plates. The impedance response consisted of four peaks split into
①-④ in the cases of the simulated and the measured responses. Herein, the PZNT91/09 plate
resonator with a giant k
31
of 84% was prepared under the poling conditions of a DC poling
field (E) of 1200 V/mm. Although the simulation for the splitting was calculated from the
values of σ
W
E
/σ
L
E
=3.2 (σ
L
E
=0.089, σ
W
E
=0.29) and s
12
E
=-10 (10
-12
m
2
/N), the splitting of the four
peaks occurred in the case of a giant k
31
in the PZNT91/09 single-crystal plates. Therefore, it
was confirmed that the simulation data were exactly fitted to the measured data in both the
Giant k
31
Relaxor Single-Crystal Plate and Their Applications
21
cases of the generation of the k
t
mode and the impedance and phase responses of the k
t
fundamental vibration. The impedance and phase responses of the k
t
fundamental vibration of
PMNT74/26 single-crystal plates are shown in Fig. 21 [σ
W
E
/σ
L
E
=4.9 (σ
L
E
=0.041, σ
W
E
=0.20) and
s
12
E
=-3 (10
-12
m
2
/N)] in comparison with the measured responses. The simulated impedance
and phase responses were well fitted to the measured responses.
Impedance (Ω)
01
1
10
2
10
2
10
3
(a)
E=1200 V/mm (k
31
=84.4%)
k
t
=57
Phase (deg)
-90
-90
0
4.5 4.7 5.0
5.2 5.5
5.8
Phase (deg)
3.75 4.00 4.25 4.50 4.75 5.00 5.25
Frequency (M Hz)
(b)
Impedance (Ω)
10
1
10
2
10
3
01
0
10
4
10
5
k
t
=64%
○
1
○
2
○
3
○
4
-90
-90
0
Fig. 20. Frequency responses of impedance and phase on k
t
fundamental vibration in
PZNT91/09 single-crystal plates; (a) measured and (b) simulated data.
8.0 8.8 9.6 10.4 11.2 12.0
Frequency (M Hz)
10
1
10
2
01
0
Impedance (Ω)
Phase (deg)
k
t
=65%
-90
-90
0
10
2
10
3
10
1
k
t
=49%
-90
-90
0
(a)
(b)
E=1000 V/mm (k
31
=80.8%)
Fig. 21. Frequency responses of impedance and phase on k
t
fundamental vibration in
PMNT74/26 single-crystal plates; (a) measured and (b) simulated data.
Ferroelectrics - Applications
22
4.1.4 Domain behavior evaluation by FEM
The 3rd overtone in the k
31
mode was calculated to synthesize one-third of the simulated
responses each in the cases of (i) σ
W
E
/σ
L
E
=2.5 (σ
L
E
=0.13, σ
W
E
=0.32), (ii) σ
W
E
/σ
L
E
=2.4
(σ
L
E
=0.13, σ
W
E
=0.31), and (iii) σ
W
E
/σ
L
E
=1.8 (σ
L
E
=0.17, σ
W
E
=0.31). The simulated 3rd overtone
response consisted of three peaks splitting in PZNT91/09 [shown in the circle of Fig. 22(a)].
On the other hand, the plate resonator DC poled at E=400 V/mm, the poling field of which
is just below that required to obtain a giant k
31
, also possesses the 3rd overtone with three
peaks splitting [shown in the circle of Fig. 22(b)]. Therefore, it was thought that the
PZNT91/09 single-crystal plate was composed of three vibration bodies, namely, three large
domains with σ
W
E
/σ
L
E
values of 2.5, 2.4, and 1.8. Since the splitting of the three peaks of the
3rd overtone response formed one peak at E= 1200 V/mm obtaining a giant k
31
of 84.4%
(shown in the circle of Fig. 22(c)), it was proved that a mono-domain plate with a giant k
31
was achieved. From our study, it was confirmed that frequency response analysis of
impedance is an effective tool for the evaluation of domain structures in single-crystal
plates.
(b)
k
32
fundamental
5
th
Impedance (Ω)
10
2
10
3
10
4
10
5
k
31
fundamental
3
rd
overtone
E=400 V/mm
k
31
=70.2%
10
1
10
2
10
3
10
4
01
0
10
5
(a)
k
31
fundamental
3
rd
overtone
k
31
=77.2%
10
1
10
2
10
3
10
4
10
5
Frequency (kHz)
5
th
k
32
fundamental
k
32
fundamental
(c)
0 100
200 300
400 500
3
rd
overtone
k
31
fundamental
k
31
=84.4%
5
th
E=1200 V/mm
Fig. 22. Frequency responses of impedance on 3rd overtone on k
31
mode in PZNT91/09
single-crystal plates; (a) simulated data, (b) measured data of plate resonator DC poled at
E=400 V/mm, and (c) measured data of plate resonator DC poled at E=1200 V/mm.
4.1.5 Origin of giant k
31
from viewpoints of material constants
The most significant factors for realizing giant piezoelectricity in the k
31
mode in the relaxor
single-crystal plates were thought as follows: Firstly, large s
11
E
values of 110 (10
-12
m
2
/N) in
the PZNT91/09 single-crystal plates and 67 (10
-12
m
2
/N) in the PMNT74/26 single-crystal
plates in the direction of length were required (Table 3). These s
11
E
values are relatively
Giant k
31
Relaxor Single-Crystal Plate and Their Applications
23
larger than that of 11-17 (10
-12
m
2
/N) in PZT ceramics. This means that the single-crystal
plates with a giant k
31
of more than 80% became markedly soft and showed a low Poisson
ratio, particularly σ
L
E
<0.1 after DC poling. Secondly, a large anisotropy of bulk wave
velocity (twofold the frequency constant) accompanied by a large σ
W
E
/σ
L
E
=3.2-3.4 in
PZNT91/09 single-crystal plates and a large σ
W
E
/σ
L
E
=4.5-4.9 in PMNT74/26 single-crystal
plates was essential. Therefore, it was thought that the physical meaning of the above-
mentioned large s
11
E
, low σ
L
E
, and large σ
W
E
/σ
L
E
originated from a field-induced phase such
as the orthorhombic phase by DC poling because the combination of the directions of
spontaneous polarization and poling field in the orthorhombic phase could only move
domains in the plates.
In conclusion of this part, impedance response analysis by FEM was performed using the
k
31
, k
32
, and k
t
modes in relaxor single-crystal plates with a giant k
31
. It was found that a
large anisotropy on the k
31
and k
32
modes was generated in the plate resonators with a giant
k
31
. As the Poisson ratios of the length and width directions in the plates were changed, the
simulation results were well fitted to the measured impedance responses. These results
could be explained by the material constants in a field-induced phase induced by the DC
poling field. Furthermore, the domain behavior in the single-crystal plates was evaluated
from the synthesized impedance response of three vibration bodies, i.e., three domains with
different Poisson ratios.
4.2 Giant k
31
and d
31
in relaxor single-crystal plates evaluated using P-E hysteresis
loops and strain
The longitudinal-mode electromechanical coupling factor k
33
of over 90% was easy to obtain
because the vibration direction of the k
33
mode is the same as that of the poling field.
However, the relationship between the giant k
31
and k
33
modes is not clarified. In this part,
we could explain the relationship using P-E hysteresis loops and electric field (E) vs strain
measurement from the viewpoint of giant k
31
.
4.2.1 P-E hysteresis loops
Figure 23 shows the electric field (E) dependence of P-E hysteresis loops in (100) PZNT91/09
single-crystal plate measured at 40℃ by a high voltage test system. While a symmetrical P-E
loop was observed at E = 1000 V/mm, a triple loop was generated as E ≧ 1500 V/mm in the
case of the crystal plate with giant k
31
.
-50
-40
-30
-20
-10
0
10
20
30
40
50
-2 -1 0 1 2
P (μC/cm
2
)
E (kV/mm)
-50
-40
-30
-20
-10
0
10
20
30
40
50
-2 -1 0 1 2
P (μC/cm
2
)
E (kV/mm)
(a)
(b)
Fig. 23. P-E hysteresis loops in PZNT91/09 single-crystal plates (a) before (E=1000 V/mm)
and (b) after (E=1500 V/mm) the appearance of giant k
31
over 80%.
Ferroelectrics - Applications
24
Therefore, it was considered that the E of 1500 V/mm is a coercive field to obtain giant k
31
.
In addition, the triple loops were realized at 20-60 ºC, in the rhombohedral phase of
PZNT91/09.
Figure 24 shows the Ti composition (x) dependence of k
31
[Fig. 24(a)] and P-E loops [Fig. 24(b)]
in PMNT(1-x)/x single-crystal plate measured at 40 ºC (pseudo-cubic phase) under E =1500
V/mm. Although a symmetrical P-E hysteresis loop was obtained at x = 0.296-0.301 in the
plate with k
31
=60%, triple loops were observed at x=0.273-0.293, and asymmetrical loops were
observed at x=0.251-0.262 in the plates with giant k
31
(>80%). The E=800 V/mm to generate the
triple and asymmetrical loops corresponds to a coercive field to realize giant k
31
.
50
60
70
80
90
100
24 25 26 27 28 29 30 31
T i (m o l% )
k
31
(% )
(a)
(b)
Fig. 24. Ti composition (x) vs (a) k
31
and (b) P-E hysteresis loops in PMNT(1-x)/x single-
crystal plates; x=0.251 (asymmetrical part near dotted lines), x=0.273/ 0.293 (triple loop at
high E), and x=0.296 (symmetrical loop).
Giant k
31
Relaxor Single-Crystal Plate and Their Applications
25
4.2.2 Shrinkage strain characteristics
Figure 25 shows the dependence of the shrinkage strain measured at room temperature
(rhombohedral phase of PZNT91/09) on the electric field (E) applied in the same direction
as the DC poling field using a photonic sensor. A large hysteresis regarding E vs strain
appeared between 400 and 1500 V/mm, the E of which (1500 V/mm) is the coercive field to
obtain giant k
31
in PZNT91/09. The large hysteresis for E vs shrinkage strain corresponds to
the large hysteresis for E vs expansion strain in PZNT91/09 single crystal. Therefore, it was
found that the large hysteresis for E vs strain (shrinkage and expansion) is due to the
generation of giant k
31
.
0
50
100
0 1000 2000 3000
E (V/mm)
Strain (μm )
0
50
100
0 1000 2000 3000
E (V/mm)
Strain (μm)
0
50
100
0 1000 2000 3000
E (V/mm)
Strain (μm )
0
50
100
0 1000 2000 3000
E (V/mm)
Strain (μm )
0
50
100
0 1000 2000 3000
E (V/mm)
Strain (μm)
0
50
100
0 1000 2000 3000
E (V/mm)
Strain (μm )
Fig. 25. Applied field (E) dependence of shrinkage strain in the length (13 mm) direction in
PZNT91/09 single-crystal plate with giant k
31
.
Figure 26 shows the Ti composition (x) dependence of E vs strain in PMNT(1-x)/x single-
crystal plates measured at room temperature (pseudo-cubic phase) and under E=1500
V/mm. By increasing x from 0.251 to 0.299, the linear relationship between E and strain
changed into a line with a brake, and finally reached to a typical E vs strain similarly to the
case of PZT ceramics. Furthermore, the E of 800 V/mm to generate the triple and
asymmetric loops corresponded to the E of a break in the line for E vs strain.
Ferroelectrics - Applications
26
0.0
0.1
0.2
0.3
0.4
0.0 0.5 1.0 1.5 2.0 2.5 3.0
Strain (%)
E (kV/mm)
x = 0.251
0.0
0.1
0.2
0.3
0.4
0.0 0.5 1.0 1.5 2.0
Strain (%)
E (kV/mm)
x = 0.279
0.0
0.1
0.2
0.3
0.4
0.0 0.5 1.0 1.5
Strain (%)
E (kV/mm)
x = 0.291
0.0
0.1
0.2
0.3
0.4
0.0 0.5 1.0 1.5
Strain (%)
E
(
kV/mm
)
x = 0.299
Fig. 26. Ti composition dependence (x) of E vs strain in PMNT(1-x)/x single-crystal plates;
x=0.251(linear line and small hysteresis), x=0.279/ 0.291 (line with break and intermediate
hysteresis) and x=0.299 (large hysteresis like PZT ceramics).
4.2.3 Field-induced phase transition
A mechanism to realize giant k
31
can be explained using the crystal plane, which closely
affects the direction of the spontaneous polarization, and poling direction. Giant k
31
in
relaxor single-crystal plates can be achieved when the poling field generates strain to move
the ferroelectric domains in the plates (13
L
×4.0
W
mm) and not to only expand the
spontaneous polarization axes in the direction of the poling field. Figure 27 shows the
relationships between crystal planes, spontaneous polarization axes, and poling direction in
(110) PMNT(1-x)/x single-crystal plates (x=0.251-0.301) in comparison with the case of (100)
and (110) PZNT91/09 single-crystal plates. The crystal phases after poling can be estimated
using the values of k
31
and the combination between the directions of the spontaneous
polarization axes and the poling field, which generates the strain to move the domains in the
plates. Therefore, it was considered that the crystal phase of the PMNT(1-x)/x single-crystal
plates after poling changed from pseudo-cubic to pseudo-cubic (x=0.251-0.262) from
pseudo-cubic to orthorhombic (x=0.273-0.293), and from pseudo-cubic to rhombohedral
(x=0.296-0.301), because of the combination to move the domains in the plates. These results
were supported by the fact that the shapes of the P-E loops are triple or asymmetrical.
Furthermore, it was considered that the E for such types of loops to appear was a coercive
field to generate the DC-field-induced phase transition with giant k
31
.
In conclusion of this part, the relationships between giant k
31
(>80%) and k
33
(>90%) in (100)
PZNT91/09 and (110) PMNT(1-x)/x single-crystal plates were clarified to investigate the P-E
hysteresis loops and the strain measurement. Triple and asymmetrical loops appeared in
PMNT(1-x)/x single-crystal plates with giant k
31
as well as in PZNT91/09 single-crystal plates
with giant k
31
. The typical relaxor-type hysteresis was observed for the electric-field-induced
strain and their break points correspond to the coercive field to generate giant k
31
. The crystal
Giant k
31
Relaxor Single-Crystal Plate and Their Applications
27
phases after DC poling could be estimated using the relationships between the crystal plane,
which closely affects the direction of the spontaneous polarization, and poling direction.
Rhombohedral (100) PZNT
Rhombohedral (110) PMNT Orthorhombic (110) PMNT Pseudo-cubic (110) PMNT
k
31
<60%
k
31
<60%
k
31
>80%
k
31
>80%
k
31
>88%
triple P-E hysteresis loop
triple P-E hysteresis loop symmetrical P-E hysteresis loop
symmetrical P-E hysteresis loop
asymmetrical P-E hysteresis loop
<110>
Rhombohedral (110) PZNT
x = 0.251-0.262 x = 0.273-0.293 x = 0.296-0.301
<110>
<110>
<110>
<100>
Crystal plane
Poling direction
Spontaneous
polarization axes
Fig. 27. Schematic diagrams of relationships between crystal plane, which affects direction of
spontaneous polarization, and poling direction for realizing giant k
31
(>80%) in (110)
PMNT(1-x)/x (pseudo-cubic phase before poling) and PZNT91/09 (rhombohedral phase
before poling) single-crystal plates at poling temperature of 40 ºC.
5. Applications
Utilizing the giant k
31
and d
31
in PZNT91/09 single crystals, devices such as piezoelectric
unimorphs and bimorphs were fabricated in comparison with the devices consisting of PZT
ceramics.
5.1 Applications of Pb[(Zn
1/3
Nb
2/3
)
0.91
Ti
0.09
]O
3
single-crystal plates with giant k
31
to
piezoelectric unimorphs and bimorphs
In this part, the piezoelectric and displacement properties on various kinds of unimorphs
and bimorphs were reported. Piezoelectric unimorphs were prepared by sticking the
PZNT91/09 single-crystal plates with giant k
31
on center shim plates (15
L
x4
W
x0.10
T
/ 0.20
T
mm) composed of 42 nickel alloy. These were compared with unimorphs fabricated by
ordinary PZT ceramic plates (k
31
=37%, d
31
=-330 pC/N) with the same dimensions.
Furthermore, series-type bimorphs were made from the unimorphs by sticking other
PZNT91/09 single-crystal plates and also PZT ceramic plates. The coupling factors on the
bending mode (k
b
) of the unimorphs and bimorphs were evaluated. The displacement of the
devices was measured by laser displacement equipment at room temperature.
5.1.1 Realization of giant k
31
over 80% in single-crystal plates
Table 4 shows the poling and annealing processes to obtain the giant k
31
over 80%. When we
poled three plate samples (13
L
x4
W
x0.36
T
mm) of Nos. 1~3, only the one sample of No. 3-1
had a giant k
31
of 85.6%. The others were 42.2% (No. 1-1) and 40.4% (No. 2-1). Therefore, the
Ferroelectrics - Applications
28
Sample No. E (kV/mm) k
31
(%)
k
t
(%)
1-1 1.0 42.2 55.1
Annealing 0.0 0.0
1-2 1.0 49.6 59.0
1-3 1.5 39.6 55.8
1-4 2.0 79.5 56.2
1-5 2.5 55.7 59.6
1-6 3.0 39.8 55.7
2-1 1.0 40.4 54.9
Annealing 0.0 0.0
2-2 1.0 45.4 54.2
2-3 1.5 86.2 56.2
3-1 1.0 85.6 56.8
Table 4. Process combination of poling and annealing to obtain Giant k
31
.
annealing at 200 ºC for 30 min was carried out to de-polarize the samples. On the following
processes, the poling fields increased from 1.0 kV/mm to 3.0 kV/mm. As a result, the giant
k
31
was realized in the cases of No. 1-4 and No. 2-3 while the electromechanical coupling
factors of the thickness mode (k
t
) were almost the same of 54~60%. This means that the
domain reorientation in thickness had been saturated; on the other hand, the one in the plate
is changeable by the poling field. Furthermore, there was an optimum DC poling field for
appearing the giant k
31
on each individual plate sample. As mentioned above, the giant k
31
can be obtained by the process combination of the DC poling and the annealing. Figure 28
Fig. 28. Frequency responses of impedance on k
31
mode in (a) PZNT91/09 single-crystal
plate and (b) PZT ceramic plate.
Giant k
31
Relaxor Single-Crystal Plate and Their Applications
29
shows the comparison between frequency responses of impedance in (a) the PZNT91/09
single-crystal plate and (b) the conventional PZT ceramic plate. The k
31
’s were 86.2%
(PZNT91/09: sample No. 2-3 in Table 4) and 37.3% (PZT), respectively.
5.1.2 Bending mode prpperties
The PZNT91/09 single-crystal plate (13
L
x4.0
W
x0.36
T
mm) with giant k
31
of 86.2% (No. 2-3 in
Table 4) was stuck on a center shim plate (15
L
x4
W
x0.20
T
mm) composed of 42 nickel alloy to
prepare a piezoelectric unimorph. The same dimensions of the PZT ceramic plate (k
31
=37%,
d
31
=-330 pC/N) was also used to realized a unimorph. Figure 29 shows the comparison
between frequency responses of impedance in (a) the PZNT91/09 single-crystal unimorph
and (b) the conventional PZT ceramic unimorph. The k
b
=64.7% on bending mode in the
PZNT91/09 single-crystal plate was three times larger than the k
b
=20.6% in the PZT ceramic
plate. Therefore, it was confirmed that the giant k
31
and d
31
constant could be useful to
realize the piezoelectric unimorphs with high efficiency as well as the plate (13
L
x4.0
W
x0.36
T
mm) resonators with giant k
31
and d
31
constant.
Fig. 29. Frequency responses of impedance on k
b
mode in (a) PZNT91/09 single-crystal
unimorph and (b) PZT ceramic unimorph.
A piezoelectric bimorph was fabricated by sticking the PZNT91/09 single-crystal plate with
giant k
31
of 85.6% (No. 3-1 in Table 4) on the PNZT91/09 single-crystal unimorph with the k
b
of 64.7% as previously mentioned. A PZT ceramic bimorph was also prepared. Figure 30
shows the comparison between frequency responses of impedance in (a) the PZNT91/09
Ferroelectrics - Applications
30
single-crystal bimorph and (b) the conventional PZT ceramic bimorph. The k
b
=69.8% on
bending mode in the PZNT91/09 single-crystal plate was twice larger than k
b
=31.2% in the
PZT ceramic plate. Therefore, it was confirmed that highly efficiency piezoelectric devices
could be realized to utilize PZNT91/09 single-crystal plates with giant k
31
and d
31
constant
in the cases of the piezoelectric bimorphs as well as the piezoelectric unimorphs.
Fig. 30. Frequency responses of impedance on k
b
mode in (a) PZNT91/09 single-crystal
bimorph and (b) PZT ceramic bimorph.
5.1.3 Displacement properties
The displacement was evaluated regarding the PZNT91/09 single-crystal unimorphs (the
center shim plate thickness of 0.20 mm)/ bimorphs (the center shim plate thickness of 0.10
mm) and the PZT ceramic unimorphs (the center shim plate thicknesses of 0.10 mm and 0.20
mm)/ bimorphs (the center shim plate thickness of 0.10 mm). In the case of a series-type
bimorph in Fig. 31, the total displacement (
u =a+b) was estimated by the following
equation;
2
31
3
12
2
s
t
l
ud V
tt
α
⎛⎞
⎛⎞
⎛⎞
⎜⎟
=⋅+×
⎜⎟
⎜⎟
⎜⎟
⎝⎠
⎝⎠
⎝⎠
(1)
where
l : effective length (9 mm), t : thickness of devices (0.36+0.2 mm for single-crystal and
ceramic unimorphs, 0.36+0.1 mm for ceramic unimorph, and 0.36x2+0.1 mm for single-
Giant k
31
Relaxor Single-Crystal Plate and Their Applications
31
crystal and ceramic bimorphs),
s
t : thickness of shim plate (0.1 mm and 0.2 mm), V : applied
voltage and
α
: non-linearity coefficient, respectively.
u
a
b
-V
+V
l
Fig. 31. Series type bimorphs and total displacement.
The relationships between the applied voltage and the displacement were shown in Fig. 32
for the different shim thickness in the PZNT single-crystal unimorph and the PZT ceramic
unimorph. The d
31
constants of the stuck piezoelectric plates calculated from the frequency
responses of the impedance were -2020 pC/N in the PZNT91/09 single crystal and -330
pC/N in the PZT ceramics, respectively. The displacement of the PZNT91/09 single-crystal
unimorph was twice larger than the one of the PZT ceramic unmorph. The decrease in
thickness of the shim plate from 0.20 mm to 0.10 mm increased the displacement in the
range of over 100 V. The
α
calculated from (1) was 0.4~0.5 in the PZNT91/09 single-crystal
unimorph. Otherwise, the
α
was 1.0 (≦100 V) and 1.6 at 180 V in the PZT ceramic
unimorph. Furthermore, the
α
was independent of the shim plate thickness in the PZT
ceramic unimorphs.
Fig. 32. Applied voltage dependence of displacement in PZNT91/09 single-crystal
unimorph (□: shim thickness of 0.20 mm) and PZT ceramic unimorph (■: shim thicknesses
of 0.20 mm and ◆: 0.10 mm).
Ferroelectrics - Applications
32
Figure 33 shows the applied voltage dependence of the displacement in the PZNT91/09
single-crystal bimorph and the PZT ceramic bimorph. The average d
31
constants of the two
stuck PZNT91/09 single-crystal plates and the two stuck PZT ceramic plates also showed in
this figure. Although the d
31
constant of the PZNT91/09 single crystals is 4~7 times larger
than the d
31
of the PZT ceramics, the displacement of the PZNT91/09 single-crystal bimorph
became almost twice larger than the one of the PZT ceramic bimorph. The reason the
displacement becomes twice, not more, was due to that the
α
in the PZNT91/09 single-
crystal bimorph was a half of the
α
in the PZT ceramic bimorph.
Fig. 33. Applied voltage dependence of displacement in PZNT91/09 single-crystal
bimorph (○: shim thickness of 0.10 mm) and PZT ceramic bimorph (●: shim thickness of
0.10 mm).
The origin of the decrease in
α
of the PZNT91/09 single-crystal bimorph was thought the
mechanical softness of PZNT91/09 single-crystal plates with giant k
31
and d
31
constant.
Namely, the Young’s modulus of PZNT single crystals (0.89x10
10
N/m) is one order smaller
than the one of PZT ceramics (6~8x10
10
N/mm). In addition to the above mentioned, the
values of
α
in bimorphs were approximately twice larger than the ones of unimorphs. This
phenomenon was thought that the
α
depends on the number of the piezoelectric plate; one
plate in unimorph and two plates in bimorph, respectively.
In conclusion of this part, the process combination of poling and annealing to obtain giant
k
31
and d
31
constant was clarified to fabricate PZNT91/09 single-crystal unimorphs and
bimorphs. The coupling factors on bending mode (k
b
) in PZNT91/09 single crystal
unimorphs and bimorphs were 2~3 times larger than the k
b
’s in PZT ceramic unimorphs
and bimorphs. The displacement of PZNT91/09 single-crystal unimorphs and bimorphs
was almost twice larger than the one of PZT ceramic devices. The advantage of PZNT91/09
single-crystal plates with giant k
31
and d
31
constant was confirmed through the development
of piezoelectric devices such as unimorphs and bimorphs.
Giant k
31
Relaxor Single-Crystal Plate and Their Applications
33
6. Conclusion
We found the giant electromechanical coupling factor of k
31
mode to be over 80% and the
piezoelectric d
31
constant to be nearly -2000 pC/N
in ferroelectric relaxor single-crystal
plates. The discovery of the giant k
31
and the d
31
constant became breakthroughs in
applications to high-performance sensors and actuators utilizing k
31
mode.
7. Acknowledgments
This work was partially supported by the Grant-in-Aid for Scientific Research C (Nos.
12650327, 17560294) from the Ministry of Education, Culture, Sports, Science and
Technology, and the Foundation from the Regional Science Promotion (RSP) program 2004
of the Japan Science and Technology Agency, and the Research Foundation Grant 2003,
2006, 2007, 2008 jointly sponsored by Academia and Industry of Fukuroi City. The author
would like to thank the Research Laboratory of JFE Mineral Co., Ltd. for supplying the
PZNT and PMNT single-crystal plates.
8. References
Koto, R. et al. (2006). Chemical Composition Dependence of Giant Piezoelectricity on k
31
Mode in Pb(Mg
1/3
Nb
2/3
)O
3
–PbTiO
3
Single Crystals, Jpn. J. Appl. Phys., Vol.45, pp.
7418-7421.
Koto, R. & Ogawa, T. (2007). Frequency Response Analysis by Finite Element Method in
Relaxor Single-Crystal Plates with Giant k
31
, Jpn. J. Appl. Phys., Vol.46, pp. 7058-
7062.
Kuwata, J. et al. (1982). Dielectric and Piezoelectric Properties of 0.91Pb(Zn
1/2
Nb
2/3
)O
3
-
0.09PbTiO
3
Single Crystals, Jpn. J. Appl. Phys., Vol.21, p. 1298-1302.
Matsushita, M. et al. (2001).
Abstr. Am. Ceram. Soc., 103rd Annual Meet., p. 247.
Ogawa, T. & Nakamura, K. (1999). Effect of Domain Switching and Rotation on Dielectric
and Piezoelectric Properties in Lead Zirconate Titanate Ceramics,
Jpn. J. Appl. Phys.,
Vol.38, pp. 5465-5469.
Ogawa, T. et al. (2002). Giant Electromechanical Coupling Factor of k
31
Mode and
Piezoelectric d
31
Constant in Pb[(Zn
1/3
Nb
2/3
)
0.91
Ti
0.09
]O
3
Piezoelectric Single Crystal,
Jpn. J. Appl. Phys., Vol.41, pp. L55-L57.
Ogawa, T. & Numamoto, Y. (2002). Origin of Giant Electromechanical Coupling Factor of k
31
Mode and Piezoelectric d
31
Constant in Pb[(Zn
1/3
Nb
2/3
)
0.91
Ti
0.09
]O
3
Single Crystal,
Jpn. J. Appl. Phys., Vol.41, pp. 7108-7112.
Ogawa, T. et al. (2005). Giant Piezoelectricity on k
31
Mode in Pb(Mg
1/3
Nb
2/3
)O
3
–PbTiO
3
Single Crystal,
Jpn. J. Appl. Phys., Vol.44, pp. 7028-7031.
Ogawa, T. (2005). Piezoelectric Bimorph with Giant Electromechanical Coupling
Factor of Bending Mode Nearly 70% Fabricated by Low Symmetry
Mono-Domain Pb[(Zn
1/3
Nb
2/3
)
0.91
Ti
0.09
]O
3
Single Crystal, Ferroelectrics, Vol.320, pp.
115-123.
Ferroelectrics - Applications
34
Ogawa, T. (2008). Giant Transverse-Mode Electromechanical Coupling Factor and
Piezoelectric Strain in Relaxor Single-Crystal Plates Evaluated Using P-E Hysteresis
Loop,
Jpn. J. Appl. Phys., Vol.47, pp. 7655-7658.
Yin, J. et al. (1999).
IEEE Proc. Med. Imag., Vol.3664, p. 239.