REPORT NO. 2011-080 JANUARY 2011 DEPARTMENT OF THE LOTTERY Financial Audit _part2 ppt
Bạn đang xem bản rút gọn của tài liệu. Xem và tải ngay bản đầy đủ của tài liệu tại đây (400.99 KB, 9 trang )
JANUARY 2011 REPORT NO. 2011-080
4
Nonoperating income increased $45.8 million over the prior fiscal year. Unrealized appreciation on
investments accounted for $44 million of the increase due to higher market values of investments of similar
securities in fiscal year 2010 compared to fiscal year 2009.
EETF transfers from unclaimed prize money decreased $3 million from the prior fiscal year due primarily to
the reduction of unclaimed prize money generated by On-line games. Scratch-Off games generated $2.2
million additional unclaimed prize money over fiscal year 2009.
OVERVIEW OF THE FINANCIAL STATEMENTS
The Lottery is accounted for as an enterprise fund, reporting transactions using the accrual basis of accounting similar
to the method used by business entities. This MD&A is intended to serve as an introduction to the Lottery’s basic
financial statements, including the notes to the financial statements. The Statement of Net Assets on page 13, the
Statement of Revenues, Expenses, and Changes in Net Assets on page 14, and the Statement of Cash Flows on page
15 report the Lottery’s net assets and changes therein. The notes to the financial statements provide additional
information that is essential to a reader’s understanding of the data provided in the financial statements.
The Lottery transfers its net profits each fiscal year to the EETF. As a result, the Lottery’s net assets consist of funds
invested in fixed capital assets and restricted assets. The restricted net assets consist of the investments being held by
the Lottery to fund deferred prize payouts, 20 percent of unclaimed prizes designated for future prize payouts, the
Multi-State Lottery Association (MUSL) deposit amount, and a reserve fund established to pay set prize amounts.
(Refer to the Net Assets and Changes in Net Assets section of the MD&A for explanation of the elimination of this
reserve fund in 2010.) The financial statements do include the cumulative effect of periodic adjustments to recognize
the fair value of the grand prize investments despite the fact that the Lottery purchased the investments with the
intention of holding the investments until maturity in order to meet future obligations and, therefore, will not realize
any gains or losses that will be available for distribution as net proceeds.
This is trial version
www.adultpdf.com
JANUARY 2011 REPORT NO. 2011-080
5
SUMMARY OF NET ASSETS
Table 1 presents a comparative summary of the Lottery’s Statement of Net Assets for fiscal years 2010, 2009, and
2008.
2010 2009 2008
Assets
Current Assets $ 176
,
765 $ 173
,
395 $ 188
,
200
Restricted Assets 1
,
745
,
058 1
,
926
,
734 2
,
306
,
205
Ca
p
ital Assets
,
Net of De
p
reciation 1
,
421 1
,
235 1
,
279
Total Assets
1
,
923
,
244 2
,
101
,
364 2
,
495
,
684
Liabilities
Current Liabilities 171
,
126 173
,
542 187
,
526
Current Liabilities Pa
y
able from Restricted Assets 1
,
018
,
424 1
,
083
,
453 1
,
310
,
654
Noncurrent Liabilities 599
,
586 722
,
190 837
,
694
Total Liabilities
1
,
789
,
136 1
,
979
,
185 2
,
335
,
874
Net Assets
Net Investment in Ca
p
ital Assets 1
,
421 1
,
235 1
,
279
Restricted Net Assets 132
,
687 120
,
944 158
,
531
Total Net Assets
$ 134
,
108 $ 122
,
179 $ 159
,
810
Table 1
Condensed Statement of Net Assets
As of June 30, 2010, 2009, and 2008
(
In Thousands
)
Assets
Total assets at the end of fiscal year 2010 decreased $178.1 million from $2.1 billion at June 30, 2009, to $1.9 billion at
June 30, 2010. At the end of fiscal year 2009, total assets were $394 million less than the $2.5 billion at the end of
fiscal year 2008.
Current assets increased from $173.4 million in 2009 to $176.8 million in 2010, representing an increase of
$3.4 million. This net increase was primarily due to an increase of $30 million in cash and cash equivalents
mostly on deposit with the State Board of Administration and a decrease of $27 million in accounts
receivable. The decrease in accounts receivable for fiscal year 2010 was due to fewer days in the billing cycle
to retailers when compared to the prior year.
Restricted assets decreased $181.7 million from $1.9 billion in 2009 to $1.7 billion in 2010. This decrease was
predominately due to the continued decrease in the deferred payment investment portfolio as the preference
in payout options for jackpot prizewinners progressively shifts toward the cash option instead of the
alternative annuity option. There were $201.7 million in payouts of annuities and $2.2 million in purchases of
new investments in fiscal year 2010 in comparison to fiscal year 2009, which had annuity payouts of $220.0
million, and purchases of new investments of $22.1 million. As a result of the downward trend in the
investment portfolio, there was also a decrease in the fair value of the grand prize investments of $145.7
million. Additionally, the amount of invested collateral from the lending of those securities declined. At June
This is trial version
www.adultpdf.com
JANUARY 2011 REPORT NO. 2011-080
6
30, 2010, the Lottery held $749.1 million in invested collateral, $842.7 million at June 30, 2009, and $1.1
billion at June 30, 2008.
Liabilities
Total liabilities at June 30, 2010, were $1.8 billion, which was approximately $190 million lower than the total liabilities
of $2.0 billion at June 30, 2009. The total liabilities at June 30, 2009, were $357 million lower than the June 30, 2008,
amount of $2.3 billion.
Current liabilities decreased from $173.5 million on June 30, 2009, to $171.1 million on June 30, 2010. The
decrease of $2.4 million was due to a combination of factors. The most notable change in current liabilities
was a decrease of $24.5 million in the amount due to the EETF at June 30, 2010. However, this decrease was
offset primarily by an increase in prizes payable of $17.1 million. At June 30, 2010, the On-line LOTTO
game had an obligation of $29.1 million related to multiple rollovers with a large jackpot near fiscal year-end.
The same liability for the 2009 fiscal year was $17.1 million. The liability related to Scratch-Off games was
$37.5 million for 2010 and $27.1 million in 2009.
As expected, current liabilities payable from restricted assets decreased $65 million from $1.08 billion at June
30, 2009, to $1.02 billion at June 30, 2010. The amount of grand prizes payable due within one year and the
obligation under securities lending, which are the two primary components of this liability class, are associated
with the amounts payable to jackpot winners who have chosen the deferred payment option. The obligation
under securities lending decreased by $42.1 million and the current portion of grand prizes payable decreased
by $22.4 million. At June 30, 2009, the current liability balance of $1.08 billion was $227.2 million less than
the balance of $1.31 billion at June 30, 2008. This decrease was also attributable to a net decrease of $207.6
million in obligations under securities lending. Noncurrent liabilities principally consist of the long-term
portion of grand prizes payable, which represents the amount to be paid to grand prizewinners over future
years. Correlative to current grand prizes payable, the long-term grand prizes payable decreased $123 million
from fiscal year-end 2009 to 2010 and decreased $115.8 million from fiscal year-end 2008 to 2009.
Net Assets and Changes in Net Assets
Net assets increased $11.9 million from June 30, 2009, to June 30, 2010. Net assets at June 30, 2010, 2009, and 2008
were $134.1 million, $122.2 million, and $159.8 million, respectively.
The increase was predominately due to the increase in restricted net assets for undistributed appreciation on
restricted investments caused by unrealized gains related to grand prize investments. The increase resulted
from lower interest rates in fiscal year 2010, which led to higher market values on investments. The Lottery
expects this increase in net assets to be short-term and the declining trend to return for the foreseeable future
as grand prizewinners consistently choose the cash option when they claim their prizes. The decrease will be
amplified as the majority of grand prizewinners that are currently receiving annual payments will be paid off
within the next four years. Refer to Note 2 – Cash and Investments in the Notes to the Financial Statements
for more details.
This is trial version
www.adultpdf.com
JANUARY 2011 REPORT NO. 2011-080
7
A decrease can be seen in the assets in the restricted prize pool. The elimination of the LOTTO PLUS game
during fiscal year 2010 accounts for this decline. The reserve was created as required to support this game;
therefore, the $38.5 million balance remaining after all prizes were paid was transferred to EETF. Refer to
Note 1 and Note 8 in the notes to the financial statements for further detail.
The Lottery joined MUSL in the prior fiscal year as required in order to participate in the POWERBALL® with
Power Play® game. In accordance with MUSL’s rules, the Lottery must contribute to various prize reserves funds
maintained by MUSL for unforeseen prize payouts related to the POWERBALL with Power Play game. The
Lottery’s deposits in reserve funds with MUSL totaled $9.3 million and $3.1 million as of June 30, 2010, and June 30,
2009, respectively. Refer to Note 6 in the Notes to the financial statements for further detail.
SUMMARY OF REVENUES, EXPENSES, AND CHANGES IN NET ASSETS
The most important element demonstrated with the Lottery’s financial statements is the transfer to the EETF.
Accordingly, the primary focus of these financial statements is determining net income available for transfer, rather
than the change in net assets of the Lottery, which primarily reflects the changes in fair value of restricted
investments.
Table 2 presents a condensed Summary of Revenues, Expenses, and Changes in Net Assets for the fiscal year ended
June 30, 2010, and the prior fiscal years ended June 30, 2009, and June 30, 2008, as derived from the Lottery’s
Statement of Revenues, Expenses, and Changes in Net Assets.
2010 2009 2008
O
p
eratin
g
Revenues
Ticket Sales $ 3,900,499 $ 3,938,037 $ 4,174,776
Bad Debt Ex
p
ense
(
1,075
)
(
1,256
)
(
674
)
On-line & Retailer Fees and Miscellaneous 7,599 7,408 7,724
Total Operating Revenues 3,907,023 3,944,189 4,181,826
O
p
eratin
g
Ex
p
enses
Prizes 2,346,162 2,340,372 2,476,032
Retailer Commissions 216,207 220,548 235,651
Vendor Commissions 58,286 59,875 81,300
Other Ex
p
enses 71,519 71,223 72,587
Total Operating Expenses 2,692,174 2,692,018 2,865,570
Income from Operations 1,214,849 1,252,171 1,316,256
Nonoperating Revenue, Net of Expenses 43,874 (1,947) 34,191
Income Before Operating Transfers 1,258,723 1,250,224 1,350,447
T
ransfers to EETF from Revenue
(
1,203,024
)
(
1,241,015
)
(
1,216,839
)
T
ransfers to EETF from Unclaimed Prizes
(
43,770
)
(
46,840
)
(
66,575
)
Total Transfers to EETF (1,246,794) (1,287,855) (1,283,414)
Chan
g
e in Net Assets 11,929
(
37,631
)
67,033
Net Assets, Beginning of Year 122,179 159,810 92,777
Net Assets, End of Year $ 134,108 $ 122,179 $ 159,810
T
able 2
Condensed Statement of Revenues, Expenses, and Chan
g
es in Net Assets
As of
J
une 30, 2010, 2009, and 2008
(
In Thousands
)
This is trial version
www.adultpdf.com
JANUARY 2011 REPORT NO. 2011-080
8
Sales
For the fiscal year ended June 30, 2010, ticket sales decreased $37.5 million, which continues to reflect the downturn
in the economy. However, the decrease was an improvement over the $236.7 million decline experienced from fiscal
year 2008 to 2009, which appears to be consistent with the slow recovery of the economic condition in Florida. Sales
for On-line products decreased $51.5 million with decreases in all games except the POWERBALL with Power Play
game, which increased $201 million. This increase was expected since the game began in January of 2009 and only
contributed six months of sales in the prior fiscal year. As POWERBALL with Power Play continued to provide an
additional revenue source, the first Florida player to become a POWERBALL grand prizewinner was announced in
October of 2009 with a $193 million jackpot. POWERBALL had four rollover series in 2010 that achieved jackpots
above $200 million, while LOTTO had fewer consecutive rollovers and lower jackpots in 2010 when compared to the
prior fiscal year. However, combined sales for the two games have been higher than LOTTO sales were prior to
POWERBALL beginning.
Sales of Scratch-Off tickets increased slightly from $2.06 billion for fiscal year 2009, to $2.08 billion for fiscal year
2010, and were 52.4% and 53.3% of combined sales in each of the two fiscal years, respectively. Despite the
decreases primarily in the $5 and $10 price points, there was a $24.9 million increase in the $1 price point and a
notable $72.9 million increase in the $3 price point. The $1 Monopoly game launched in July 2009 dominated in this
price point, accounting for more than $27 million in sales. In the $3 price point, the Gold Bar Crossword game that
was used for the first time in 2009 took the lead with $32 million in sales. During fiscal year 2009-10, the new $3
games launched, Match and Win, Power Play Crossword, and Triple Bingo, generated a combined total of $65 million
in sales. The Power Play Crossword game that began in December 2009 produced $26 million in ticket sales, 40% of
this total. The Lottery’s October 2009 deployment of 1,000 Instant Ticket Vending Machines (ITVMs), which
function similar to other vending machines, had a notable impact on ticket sales during the year. The machines
increased the visibility of Scratch-Off ticket products and offered a new convenience to players.
Bad debt expense is reported as a reduction in gross revenue in accordance with Governmental Accounting Standards
Board requirements. The amount of bad debt expense for the fiscal years ended June 30, 2010, and 2009, was
$1,075,000 and $1,256,000, respectively.
This is trial version
www.adultpdf.com
JANUARY 2011 REPORT NO. 2011-080
9
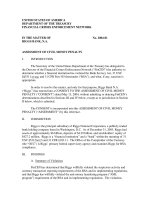
The following charts show sales by product for the various Lottery games during fiscal years 2010 and 2009:
Sales by Product for Fiscal Year 2009-10 Sales by Product for Fiscal Year 2008-09
The following chart and table show sales by game for the last ten fiscal years:
Department of the Lottery
Historical Lottery Sales by Game
(In Thousands)
Scratch-Off
53%
LOTTO
12%
CASH 3
8%
FANTASY 5
7%
Play 4
6%
POWERBALL
with Power
Play
11%
MEGA
MONEY
2%
RAFFLE
1%
Scratch-Off
52%
LOTTO
17%
CASH 3
8%
FANTASY 5
7%
PLAY 4
6%
POWERBALL
with Power
Play
6%
MEGA
MONEY
3%
RAFFLE
1%
$0
$500,000
$1,000,000
$1,500,000
$2,000,000
$2,500,000
$3,000,000
$3,500,000
$4,000,000
$4,500,000
2001 2002 2003 2004 2005 2006 2007 2008 2009 2010
Scratch‐Off
POWERBALLwith
PowerPlay
RAFFLE
MEGAMONEY
CASH3
PLAY4
FANTASY5
LOTTO
Fiscal Year-End
This is trial version
www.adultpdf.com
JANUARY 2011 REPORT NO. 2011-080
10
Fiscal Year
MEGA Scratch- Combined
Ended June
30
LOTTO
TM
FANTASY 5
TM
PLAY 4
TM
CASH 3
TM
MONEY
TM
Off Sales
2001 845,433$ 191,614$ 163,157$ 326,471$ 108,842$ 639,209$ 2,274,726$
2002 806,023 262,923 170,708 329,830 98,315 662,566 2,330,365
2003 925,474 259,999 182,716 330,001 95,930 1,073,861 2,867,981
2004 785,415 259,728 192,580 349,227 125,944 1,358,068 3,070,962
2005 689,820 252,467 206,982 345,598 131,248 1,844,619 3,470,734
2006 835,028 306,679 215,529 343,174 128,502 2,100,118 3,929,030
2007 735,585 326,241 225,285 348,694 130,142 $ 72,549 2,283,620 4,122,116
2008 778,954 309,445 227,940 336,096 122,742 30,818 2,368,781 4,174,776
2009 650,603 287,285 238,957 320,157 102,190 41,314 $ 233,396 2,064,135 3,938,037
2010 445,881 281,963 235,027 304,039 92,060 29,334 434,062 2,078,133 3,900,499
RAFFLE
TM
with
Power Play ®
Department of the Lottery
Historical Lottery Sales By Game
Last Ten Fiscal Years
(In Thousands)
MILLIONAIRE POWERBALL ®
Expenses
Section 24.121, Florida Statutes, stipulates that funds remaining in the Operating Trust Fund after the transfer to the
EETF shall be used for the payment of administrative expenses of the Lottery. These expenses include On-line game
expenses, Scratch-Off ticket expenses, advertising, and other expenses required for the day-to-day operations of the
Lottery.
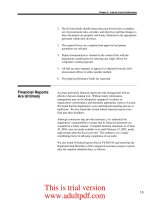
The following charts show the major components of Lottery operating expenses and transfers as a percentage of
ticket sales for the 2010 and 2009 fiscal years:
Operating Expenses and Transfers Operating Expenses and Transfers
Fiscal Year 2009-10 Fiscal Year 2008-09
Prizes
60%
Transfers
32%
Retailer
Commissions
5%
Ticket Vendor
Fees
1%
Other
1%
Advertising
1%
Prizes
58%
Transfers
32%
Retailer
Commissions
5%
Ticket
Vendor Fees
2%
Other
2%
Advertising
1%
This is trial version
www.adultpdf.com
JANUARY 2011 REPORT NO. 2011-080
11
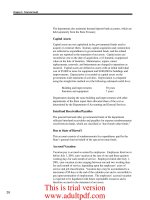
$0
$600
$1,200
$1,800
2006 2007 2008 2009 2010
$1,225
$1,263
$1,283
$1,288
$1,247
Transfers
(In Millions)
Prizes, commissions, and vendor fees directly relate to sales and fluctuate accordingly. In fiscal year 2010, these
expenses changed proportionally, yet as a percentage of total expenses they remained constant. The other expenses,
which consist of advertising, salary and benefits, professional fees, rent, maintenance, and depreciation, remained
relatively stable. Fiscal year 2010 and 2009 administrative expenses were $71.5 million and $71.2 million, respectively.
Transfers
The Lottery’s contribution to the EETF for the fiscal year ended June 30, 2010, $1.25 billion, was slightly below the
prior fiscal year contribution of $1.29 billion, but for the eighth consecutive year the Lottery contributed over $1
billion. Despite the decrease in sales the drop in the transfer was minimal, primarily because the Lottery liquidated
previously required reserves for LOTTO PLUS and a portion of the reserves related to prizes that were unclaimed by
winners. With the exception of the 2010 fiscal year, the Lottery has shown increases in transfers since fiscal year
2001. Although the transfer in the current year is minimally below the prior fiscal year’s, overall the Lottery’s transfer
rates have increased slightly over the rate of inflation during the 23-year period.
The following chart shows the total transfers to the EETF for the past five fiscal years:
ECONOMIC FACTORS AND FUTURE IMPACTS
The main economic factors affecting lottery sales are population growth, personal income growth, tourism, and
competition for discretionary consumer spending. The Lottery is challenged with Florida’s unemployment rate, which
rose above 11% during the fiscal year 2010, declining population growth that is expected to remain relatively flat over
Fiscal Year-End
This is trial version
www.adultpdf.com
JANUARY 2011 REPORT NO. 2011-080
12
the next few years, and consumer confidence recovering at a slow rate. Ways to improve its generation of funds for
the EETF and maintain the annual transfer to the EETF of over $1 billion must be found. The Lottery’s strategies
revolve around enhancing On-line and Scratch-Off product sales and increasing retailer penetration in the State. The
following are some of the functional strategies currently being explored by Lottery management:
Increase the focus of research and product development for the On-line and Scratch-Off product
segments. This functional strategy will be accomplished through product development, redesign of
existing On-line games, advertised promotions, Scratch-Off games, etc.
Chapter 24.121, Florida Statutes, authorizes the Lottery to utilize variable prize payout for both On-line
games and Scratch-Off games. The Lottery began utilizing higher prize payouts for On-line games in
fiscal year 2005 and did not expect the same rate of return for the On-line games; however, the Lottery
has experienced a positive return from applying the variable prize payout strategy. During fiscal year
2010, the Lottery utilized the higher payout authority for EZ Match promotions, LOTTO PLUS, and
three raffle games.
Improve market penetration through expansion of Lottery retailer network and provision of
alternative retail channels. The Lottery has set internal goals for continuing to grow the number of
retailers so that Florida’s per capita level of retailers is comparable to other successful states. Efforts to
continually increase the retailer base are on-going. The Department conducted two retailer recruitment
seminars across the State, which resulted in mutiple application submissions. In addition, the Lottery
continued individual communication efforts with potential retailers. As of the fiscal year-end 2010, the
retailer base is holding steady at just under 13,200 retailers. The Lottery also installed 1,000 ITVMs in
existing retailer locations in October of 2009. The installations were proven to have a positive impact on
ticket sales for the fiscal year 2010.
FINANCIAL CONTACT
The Lottery’s financial statements and this Management’s Discussion and Analysis are designed to give a general
overview to the reader. If you have any questions regarding this report or require additional information, please
contact the State of Florida, Department of the Lottery, Chief Financial Officer, 250 Marriott Drive, Capitol
Complex, Tallahassee, Florida 32399.
This is trial version
www.adultpdf.com