REPORT NO. 2011-080 JANUARY 2011 DEPARTMENT OF THE LOTTERY Financial Audit _part4 pptx
Bạn đang xem bản rút gọn của tài liệu. Xem và tải ngay bản đầy đủ của tài liệu tại đây (119.34 KB, 9 trang )
JANUARY 2011 REPORT NO. 2011-080
22
Authorized securities include primarily certificates of deposit, corporate and medium term notes, asset-
backed securities, and repurchase agreements. The invested cash collateral generally has a shorter
maturity than the securities on loan.
A risk factor associated with this lending agreement is the potential for declines in the value of the
investment holdings purchased with the cash collateral. If these investments must be liquidated, any
shortfall between the value of the investments and the securities lending obligation becomes the
responsibility of the Lottery. As of June 30, 2009, the total unrealized shortfall was $45 million. For the
fiscal year 2009-10, a net realized loss of $5.4 million is reported with unrealized gains and losses in the
Statement of Revenues, Expenses, and Changes in Net Assets as Net appreciation (depreciation) in fair
value of investments. This loss is due to a decline in value of various mortgage-backed investments
held by the SBA on behalf of the Lottery. The recovery in value of these investments was not
considered probable. Therefore, the underlying securities were sold and the resulting loss realized. As
of June 30, 2010, the total unrealized shortfall was $8 million.
Other risk factors associated with security lending include counterparty default and failure of the
custodial bank to indemnify the Lottery.
Securities lending income and expenses for the years ended June 30, 2010, and 2009, consisted of (in
thousands):
d. Investment Credit Risk
Lottery grand prizewinner investments have been limited to U.S. Government guaranteed securities.
The State Treasury Investment Pool’s current rating by Standard and Poor’s is Af.
Listed below are the Standard and Poor’s credit ratings for the lending program’s invested cash
collateral (in thousands):
2010 2009
Securities lending income 2,909$ 18,183$
Less broker rebates (1,483) (7,835)
Less bank fees (37) (1,145)
Net securities lending revenue 1,389$ 9,203$
This is trial version
www.adultpdf.com
JANUARY 2011 REPORT NO. 2011-080
23
Investment Type AAA AA A BBB B A-1 NR
Certificates of De
p
osit -$ 17,883$ -$ -$ -$ -$ 180,065$ 197,948$
Commercial Pa
p
er - - - - - 161,357 - 161,357
Domestic Corporate Bonds &
Notes - 22,867 7,705 - - - - 30,572
Domestic Non-government Asset-
backed Securities 218,071 - - 3,527 1,014 - 6,701 229,313
Domestic Non-government
Backed CMO's 4,392 - - - - - - 4,392
International Corporate Bonds &
Notes - 11,911 - - - - 10,970 22,881
International Non-government
A
sset-backed Securities 13,405 - - - - - - 13,405
International Non-government
Backed CMO's 37,930 - - - - - - 37,930
Re
p
urchase A
g
reements - - - - - - 51,339 51,339
Grand Total 273,798$ 52,661$ 7,705$ 3,527$ 1,014$ 161,357$ 249,075$ 749,137$
Standard and Poor's Credit Rating
Totals
As of June 30, 2010
Investment Type AAA AA A BBB BB CCC NR
Certificates of De
p
osit -$ -$ -$ -$ -$ -$ -$ -$
Domestic Corporate Bonds &
Notes - 9,953 195,387 12,416 - - 4,921 222,677
Domestic Non-government Asset-
backed Securities 317,625 - - 4,196 1,494 2,114 14,357 339,786
Domestic Non-government
Backed CMO's 3,913 - - - - - - 3,913
International Corporate Bonds &
Notes 19,942 - - - - - - 19,942
International Non-government
A
sset-backed Securities 12,150 - - - - - - 12,150
International Non-government
Backed CMO's 72,225 - - - - - - 72,225
Re
p
urchase A
g
reements - - - - - - 171,988 171,988
Grand Total 425,855$ 9,953$ 195,387$ 16,612$ 1,494$ 2,114$ 191,266$ 842,681$
Standard and Poor's Credit Rating
Totals
As of June 30, 2009
e. Investment Interest Rate Risk
The investment policy objective is to match maturities of investments with the maturities of the lottery
winner annuities. Therefore, investments are held to maturity after they are purchased thereby
eliminating interest rate risk. Listed below are the Lottery’s investments in U.S. Treasury Strips (in
thousands):
Time to Maturity Fair Value
< 1 year 201,477$
> 1 year to 3 years 325,664
> 3 years to 5 years 221,593
> 5 years to 10 years 178,920
> 10 years to 15 years 47,805
> 15 years to 20 years 37,026
> 20 years to 25 years 15,410
> 25 years 1,864
Total 1,029,759$
As of June 30, 2009
Time to Maturity Fair Value
< 1 year 178,478$
> 1 year to 3 years 283,945
> 3 years to 5 years 181,658
> 5 years to 10 years 132,986
> 10 years to 15 years 52,935
> 15 years to 20 years 47,871
> 20 years to 25 years 4,505
> 25 years 1,680
Total 884,058$
As of June 30, 2010
This is trial version
www.adultpdf.com
JANUARY 2011 REPORT NO. 2011-080
24
The Lottery contracts with the SBA to execute the securities lending program. The securities lending
authorization agreement between Mellon and the SBA requires that the maximum weighted average
portfolio maturity not exceed 90 days. The lending program invests a significant amount of its assets in
floating rate securities and limits the maximum reset period for interest rate changes to six months. Next
reset dates are used in the calculation of weighted average maturity. Listed below are the weighted
average maturities for the lending program’s invested cash collateral:
The effective duration of the State Treasury Investment Pool at June 30, 2010, and June 30, 2009, was
approximately 1.81 years and 1.84 years, respectively.
f. Investment Concentration of Credit Risk
Since all long-term investments (other than in the securities lending program) are in U.S. Government-
guaranteed securities, the Lottery has not adopted a policy regarding concentration of credit risk. The
securities lending program has established investment concentration of credit risk policies that limit the
aggregate exposure to any one issuer or guarantor that is not the U.S. Government or guaranteed by the
U.S. Government to 10 percent of the book value of the lending program’s invested cash collateral. No
invested cash collateral exceeded the 10 percent limitation.
However, the security lending program had
investments in GE Floorplan (5.73 percent), Discover Card (5.14 percent), and Chase Issuance (5.09
percent) that exceeded 5 percent of invested security lending collateral.
g. Investment Custodial Credit Risk
Custodial credit risk is defined as the risk that an entity may not recover securities held by another party.
The Lottery does not have a formal policy regarding custodial credit risk. The custodian for the SBA-
administered lending program is also the counterparty to the investment transactions. Therefore, the
amount of investments subject to investment custodial credit risk at June 30, 2010, and June 30, 2009,
was $749,137,000 and $842,681,000, respectively.
Investment Type
Weighted
Average
Maturity
(Days)
Weighted
Average
Maturity
(Days)
Certificates of Deposit 197,948$ 33 -$ -
Commercial Paper 161,357 31 - -
Domestic Corporate Bonds & Notes 30,572 48 222,677 42
Domestic Non-government Asset-backed Securities 229,313 16 339,786 19
Domestic Non-government Backed CMO's 4,392 6 3,913 7
International Corporate Bonds & Notes 22,881 56 19,942 15
International Non-government Asset-backed Securities 13,405 77 12,150 77
International Non-government Backed CMO's 37,930 28 72,225 32
Repurchase Agreements 51,339 1 171,988 1
Total Fair Value 749,137$ 842,681$
Portfolio weighted average maturity 27 23
Fair Value
(Thousands)
June 30, 2010 June 30, 2009
Fair Value
(Thousands)
This is trial version
www.adultpdf.com
JANUARY 2011 REPORT NO. 2011-080
25
Investment Type
June 30, 2010
Carrying Value
June 30, 2009
Carrying Value
Commercial Paper
161,357$
-$
Certificates of Deposit
197,948
-
Repurchase Agreements
51,339
171,988
U.S. Government Obligations & Federally Guaranteed
Obligations
55,507
152,569
Domestic Corporate Bonds & Notes
30,572
222,677
Domestic Non-government Asset-backed Securities
229,313
339,786
International Corporate Bonds & Notes
22,881
19,942
International Non-government Asset-backed Securities
13,405
12,150
Domestic Non-government Backed CMO's
4,392
3,913
International Non-government Backed CMO's
37,930
72,225
Investments Held by Others Under Securities Lending
Agreements - U.S. Obligations
828,551
877,190
Pooled Investments with State Treasury
169,616
175,759
Total Investments
1,802,811$
2,048,199$
At June 30, 2010, and June 30, 2009, all non-lending investments held were either insured or registered
and held by the Lottery or its agents in the Lottery’s name and thus were not subject to custodial credit
risk.
h. Foreign Currency Risk
The Lottery had no exposure to foreign currency risk as of June 30, 2010, and June 30, 2009.
i. Investment Summary
The following schedule summarizes all investments and investments loaned under securities lending
agreements at June 30 (in thousands):
The following schedules reconcile cash and investments to the Statement of Net Assets at June 30
(in thousands):
Investments
Cash at
Financial
Institutions
Cash at
State
Treasury Total
Cash and cash equivalents 125,169$ 807$ 86$ 126,062$
Restricted cash and cash equivalents 50,590 - - 50,590
Investments, grand prize 1,029,759 - - 1,029,759
Investments, security lending collateral 842,681 - - 842,681
Total 2,048,199$ 807$ 86$ 2,049,092$
June 30, 2009
Investments
Cash at
Financial
Institutions
Cash at
State
Treasury Total
Cash and cash equivalents 155,758$ 310$ 245$ 156,313$
Restricted cash and cash equivalents 13,858 85,561 - 99,419
Investments, grand prize 884,058 - - 884,058
Investments, security lending collateral 749,137 - - 749,137
Total 1,802,811$ 85,871$ 245$ 1,888,927$
June 30, 2010
This is trial version
www.adultpdf.com
JANUARY 2011 REPORT NO. 2011-080
26
3. ACCOUNTS RECEIVABLE
Accounts receivable as of June 30 consisted of (in thousands):
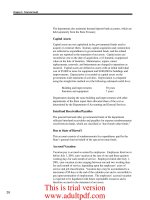
4. SECURITY DEPOSITS AND DEPOSITS PAYABLE
The Lottery receives certificates of deposit and cashier’s checks from certain vendors and retailers in order
to secure contract performance. Certificates of deposit are held in trust by the State with any interest
earnings being credited to the vendor or retailer. Cashier’s checks are held as cash by the Lottery. These
deposits are established to reduce the potential financial risk to the Lottery in the event of a breach of
contract. The certificates appear on the Statement of Net Assets, in assets as security deposits, and in
liabilities, as deposits payable. The checks appear on the Statement of Net Assets, in assets as cash, and in
liabilities, as deposits payable.
5. CAPITAL ASSETS
Capital assets at June 30 consisted of (in thousands):
6. MULTI-STATE LOTTERY ASSOCIATION
MUSL is an unincorporated government-benefit voluntary association created for the purpose of
administering joint lottery games. MUSL included 31 state lottery entities, the District of Columbia, and
the Virgin Islands during fiscal year 2009-10. This association offers the POWERBALL with Power Play
On-line game and several other On-line games in participating states. The chief executive officer of each
member lottery serves on the MUSL board of directors.
As a member of MUSL, the Lottery is required to contribute to various prize reserve funds maintained by
MUSL. The prize reserve funds serve as a contingency reserve to protect MUSL from unforeseen prize
payments. MUSL periodically reallocates the prize reserve funds among the states based on relative
2010 2009
Ticket sales receivable 18,080$ 44,533$
Other receivables 25 118
Total receivables 18,105 44,651
Less allowance for doubtful accounts (1,632) (1,466)
Accounts receivable, net 16,473$ 43,185$
Balance Balance Balance
30-
J
un-08 Increase Decrease 30-
J
un-09 Increase Decrease 30-
J
un-10
$ 9,236 $ 317 $
(
4,162
)
$ 5,391 $ 33 $
(
1,466
)
$ 3,958
5,968 - - 5,968 -
(
117
)
5,851
3,056 367
(
308
)
3,115 -
(
81
)
3,034
- - - - 651 - 651
18,260 684 (4,470) 14,474 684 (1,664) 13,494
16,981 684
(
4,426
)
13,239 494
(
1,660
)
12,073
$ 1,279 $ - $ (44) $ 1,235 $ 190 $ (4) $ 1,421
2008-09 2009-10
Vehicles and other e
q
ui
p
ment
Data
p
rocessin
g
e
q
ui
p
ment
Software
Office e
q
ui
p
ment and fixtures
Less accumulated de
p
reciation
T
otal ca
p
ital assets, net
This is trial version
www.adultpdf.com
JANUARY 2011 REPORT NO. 2011-080
27
Year Ended June 30 Amount
2011 178,569$
2012 154,618
2013 132,754
2014 109,945
2015 82,458
2016-2020 157,194
2021-2025 84,163
2026-2030 97,029
2031-2035 11,080
2036-2039 4,995
Grand prizes (face value) 1,012,805
Less imputed interest (244,424)
Net present value of grand prizes payable 768,381$
POWERBALL with Power Play sales levels. All remaining funds remitted, and the related interest earnings
(net of administrative costs), will be returned to the Lottery upon leaving MUSL, less any portion of
unanticipated prize claims that may have been paid from the fund.
As of June 30, 2010, and June 30, 2009, the Lottery had deposits with MUSL of $9,336,505, and
$3,073,441, respectively, representing the Lottery’s deposits of reserve funds.
A copy of the MUSL financial statements may be obtained by submitting a written request to MUSL, 4400
N.W. Urbandale Drive, Urbandale, Iowa 50322.
7. LONG-TERM LIABILITIES
a. Grand Prizes Payable
Grand prizes payable at June 30 consisted of (in thousands):
The following depicts by fiscal year the value (in thousands) of the grand prize annuities to pay
prizewinners:
2010 2009
LOTTO grand prizes (face value) 962,505$ 1,159,485$
Mega Money grand prizes (face value) 7,754 8,081
Win for Life grand prizes (face value) 12,658 13,022
Flamingo Fortune Game Show grand prizes (face value) 800 900
Monthly Grand game prizes (face value) - 12
Win a Million grand prizes (face value) 400 450
Yearly Bonus grand prizes (face value) 150 200
Lucky for Life grand prizes (face value) 12,950 11,900
Set for Life grand prize (face value) 2,460 2,640
Cash Spectacular grand prize (face value) 650 700
Cash for Life 230 240
Loaded for Life 3,050 3,150
Billion Dollar Blockbuster 9,000 9,500
Gas for Life 198 204
Less imputed interest (244,424) (296,739)
Net present value of grand prizes payable 768,381$ 913,745$
Current prizes payable from restricted assets 172,589$ 194,955$
Noncurrent prizes payable from restricted assets 595,792 718,790
Total grand prizes payable 768,381$ 913,745$
This is trial version
www.adultpdf.com
JANUARY 2011 REPORT NO. 2011-080
28
b. Compensated Absences Payable
Compensated absences payable at June 30 consisted of (in thousands):
c. Changes in Long-Term Liabilities
Changes in long-term liabilities are summarized as follows (in thousands):
See Note 9 for additional information regarding the postemployment healthcare benefits payable.
8. DUE TO EDUCATIONAL ENHANCEMENT TRUST FUND
Effective July 1, 2005, variable percentages of the gross revenue from the sale of On-line and Scratch-Off
lottery tickets as determined by the Lottery, and other earned revenue, excluding application processing
fees, shall be deposited in the Educational Enhancement Trust Fund (EETF) as provided in Section
24.121, Florida Statutes, as amended. The amount transferred for the fiscal year ended June 30, 2010, was
$1,246,794,000 (31.1 percent of revenues), and for the fiscal year ended June 30, 2009, the transferred
amount was $1,287,855,000 (32.6 percent of revenues).
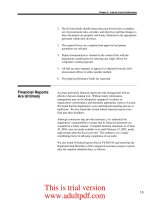
Because the net appreciation in fair value of investments and amortization of grand prizes payable, included
in nonoperating revenue and expenses, relate to valuations of the restricted grand prize investments and
grand prizes payable, they are excluded from the determination of transfers to the EETF.
2010 2009
Current compensated absences 873$ 889$
Noncurrent compensated absences 2,804
2,942
Total 3,677$
3,831$
Balance
J
ul
y
1, 2008
A
dditions Reductions
Balance
J
une 30, 2009
Amount
Due
Within
One Year
Grand prizes payable $1,046,844 $86,881 ($219,980) $913,745 $194,955
Com
p
ensated absences
p
a
y
able 3,749 1,775
(
1,693
)
3,831 889
Postemployment healthcare
benefits
p
a
y
able 252 206 - 458 -
Total long-term liabilities $1,050,845 $88,862 ($221,673) $918,034 $195,844
2008-2009
Balance
June 30,
2009 Additions Reductions
Balance
June 30, 2010
Amount
Due
Within
One Year
Grand prizes payable $913,745 $56,324 ($201,688) $768,381 $172,589
Compensated absences payable 3,831 1,799 (1,953) 3,677 873
Postemployment healthcare
benefits payable 458 532 - 990 -
Total long-term liabilities $918,034 $58,655 ($203,641) $773,048 $173,462
2009-2010
This is trial version
www.adultpdf.com
JANUARY 2011 REPORT NO. 2011-080
29
June 30, 2010 June 30, 2009
On-line ticket sales 1,822,365$ 1,873,902$
Average percent transferred 39% 41%
Transfer of On-line ticket sales 712,347 767,245
Unclaimed On-line ticket prizes 30,166 36,816
Percent transferred 80% 80%
Transfer of unclaim ed On-line ticket prizes 24,133 29,453
Scratch-Off ticket sales 2,078,134 2,064,135
Average percent transferred 21% 22%
Transfer of Scratch-Off ticket sales 442,444 450,384
Un clai m ed Scrat ch -Off t ick et p ri z es 24, 54 6 21,734
Percent transferred 80% 80%
Transfer of unclaimed Scratch-Off ticket prizes 19,637 17,387
Nonoperating revenues (expenses), net 43,874 (1,947)
Add:
Net (appreciation) depreciation in fair value of investments (90,875) (46,832)
Amortization of grand prizes payable 54,079 64,757
Total Nonoperating revenues, net 7,078 15,978
On-line fees and miscellaneous revenue 7,599 7,408
Nonrecurring transfers, net 33,556 -
Due for the year 1,246,794$ 1,287,855$
Balance due, beginning of year 83,765 112,879
Paid during the year (1,271,251) (1,316,969)
Due to Educational Enhancement Trust Fund, June 30 59,308$ 83,765$
Effective July 1, 2005, provisions of the Act relating to the allocation of revenues for public education were
revised. The changes in the provisions were designed to maximize the transfers of moneys to the EETF.
These revisions resulted in changes in the methodology used to calculate the transfer based on a business
model of revenue minus expenses rather than a percent of revenue.
Included in the current year is a nonrecurring transfer of approximately $33,556,000. This represents the
balance in prior year reserves for unclaimed prizes designated for future prize payouts and Lotto Plus,
which no longer required a reserve due to the discontinuation of this game in the 2009-10 fiscal year.
The amount due to the EETF at June 30, 2010, and June 30, 2009, was as follows (in thousands):
This is trial version
www.adultpdf.com
JANUARY 2011 REPORT NO. 2011-080
30
9. PENSIONS AND OTHER POSTEMPLOYMENT BENEFITS
a. Retirement Programs
Florida Retirement System
. The Florida Retirement System (FRS) is a State-administered
cost-sharing multiple-employer retirement plan that offers members an initial choice between
participating in a defined benefit plan (FRS Pension Plan) or a defined contribution plan (Public
Employee Optional Retirement Program, or FRS Investment Plan) and one additional choice to
change plans before retirement. FRS provisions are established by Chapters 121, 122, and 238, Florida
Statutes; Chapter 112, Part IV, Florida Statutes; and Florida Retirement System Rules, Chapter 60S,
Florida Administrative Code; wherein eligibility, contributions, and benefits are defined and described
in detail. Essentially, all employees of participating employers in regularly established positions must be
enrolled as members of the FRS or other non-integrated defined contribution plans in lieu of FRS
membership.
Benefits in the FRS Pension Plan vest at six years of service. Special Risk Class members are eligible
for normal retirement benefits at age 55 and vested or after 25 years of service at any age. All other
members are eligible for normal retirement benefits at age 62 and vested or at any age after 30 years of
service. Early retirement is available but imposes a penalty for each year a member retires before his or
her normal retirement age. Retirement, disability, and death benefits are provided and retirees receive
annual cost-of-living adjustments. Benefits are calculated at retirement based on the age, years of
service, accrual value by membership class, and average final compensation (average of highest five
fiscal years’ salaries).
Members of the FRS Pension Plan who reach normal retirement may participate in the Deferred
Retirement Option Program (DROP), subject to provisions of Section 121.091(13), Florida Statutes.
DROP participants are technically retired, deferring termination and receipt of monthly retirement
benefits for up to 60 months. During the period of DROP participation, deferred monthly benefits are
held in the FRS Trust Fund and accrue interest.
FRS Investment Plan benefits are established in Part II, Chapter 121, Florida Statutes, and participation
is available to all FRS members in lieu of the FRS Pension Plan. Members vest after one year of
creditable service for Investment Plan contributions; the funds represented by a present value of
Pension Plan service require a total of six years to be vested in those contributions and associated
earnings. Benefits under the FRS Investment Plan are based on the account balance at retirement
composed of contributions plus investment gains less investment losses and fees. Employer
contributions are a percentage of salary and based on membership class (Regular Class, Special Risk
Class, etc.). Contributions are directed to individual member accounts and the individual members
allocate contributions and account balances among various approved investment choices offered under
the plan.
The Florida Legislature establishes uniform contribution rates for participating FRS employers. FRS
employers pay the same contribution rate by membership class regardless of whether the members
participate in the FRS Pension Plan or FRS Investment Plan. Contribution rates as a percentage of
gross salary were as follows:
This is trial version
www.adultpdf.com