New South Wales Auditor-General’s Report Financial Audit Volume Nine 2011 Focusing on Education and Communities_part3 pot
Bạn đang xem bản rút gọn của tài liệu. Xem và tải ngay bản đầy đủ của tài liệu tại đây (126.96 KB, 11 trang )
21
NSW Auditor
-
General's Report
Volume Nine 2011
NEW SOUTH
WALES
ABORIGINAL LAND COUNCIL
Indigenous Money Mentor Program
During 2010–11, the Council introduced the Indigenous Money Mentor Program together with
National Australia Bank. It provides a range of no interest and low interest loans and financial
management services to the Aboriginal communities and enterprises.
Tracker Magazine
During 2010–11, the Council launched the first monthly magazine ‘Tracker’ which provides
information regarding land claims and other initiatives to members of LALCs across New
South Wales.
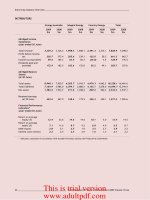
Financial Information
Abridged Statement of Comprehensive Income
Year ended 30 June
2011
$’000
2010
$’000
Investment income
34,705
47,335
Other income
6,454
16,031
Operating Revenue
41,159
63,366
Employee expenses
12,746
11,643
Funding of local Aboriginal Land Councils
13,957
13,690
Net increment on investment revaluation
(10,328)
(16,271)
Other expenses
19,070
19,786
Operating Expenses
35,445
28,848
Surplus
5,714
34,518
Other Comprehensive Income
Net assets transferred from dissolved Local
Aboriginal Land Councils
5,856
Net increment on revaluation of assets
236
Other comprehensive gain/(loss)
5
(241)
Total Other Comprehensive Income
5
5,851
Total Comprehensive Income
5,719
40,369
See detailed analysis of investment income under Statutory Investment Fund previously.
Other income of $6.4 million ($16.0 million) includes Australian Government grants of
$1.3 million ($4.3 million), Income from Rural Properties of $2.0 million ($2.2 million) and other
miscellaneous income of $3.02 million ($9.4 million).
Other income decreased substantially in the current year. In 2009-10, an impairment provision
of $6.7 million relating to a LALC receivable was reversed as the amounts were recovered.
This resulted in an unusually high balance in that year. There was no similar issue in the
current year.
Other expenses include $2.2 million ($945,000) scholarship grants and $2.7 million
($4.8 million) program expenses. The program expense relates to Walgett and Subdivision
project.
This is trial version
www.adultpdf.com
22
NSW Auditor
-
General's Report
Volume Nine 2011
NEW SOUTH
WALES
ABORIGINAL LAND COUNCIL
Abridged Statement of Financial Position
At 30 June
2011
$’000
2010
$’000
Current assets
559,340
551,822
Non-current assets
47,140
49,599
Total Assets
606,480
601,421
Current liabilities
7,972
8,648
Non-current liabilities
324
309
Total Liabilities
8,296
8,957
Net Assets
598,184
592,464
Current assets increased by $7.5 million due to an increase in value of investment portfolios.
Non-current assets decreased by $1.4 million due to an increased impairment provision for
receivables from LALCs.
Current liabilities decreased by $1.7 million as deferred grants were recognised in income.
Council Activities
The Council was constituted under the Aboriginal Land Rights Act 1983, which was amended
in 2007 to substantially increase the scope and range of responsibilities and functions of the
Council. The Council comprises nine members, each elected by voting members of the
LALCs within the nine regions of New South Wales.
For further information on the Council, refer to www.alc.org.au
.
This is trial version
www.adultpdf.com
23
NSW Auditor
-
General's Report
Volume Nine 2011
ART GALLERY
OF NEW
SOUTH WALES TRUST
Audit Opinion
The audits of the Gallery and its controlled entity’s financial statements for the year ended
30 June 2011 resulted in unmodified audit opinions within the Independent Auditor’s Reports.
Unless otherwise stated, the following commentary relates to the consolidated entity.
Operational Snapshot
The Gallery comprises the Art Gallery of New South Wales and the Australian Institute of
Asian Culture and Visual Arts Limited. Its main functions are to:
x develop and maintain a collection of works of art
x propagate and increase knowledge and appreciation of art
x give particular emphasis on the visual art of Australia and Asia.
The Gallery had expenditure of $47.2 million in 2010–11 and the surplus for the year was
$25.2 million.
Performance Information
The Gallery provided the following information regarding its performance.
Year ended 30 June
2011 2010 2009 2008 2007
Visitor numbers (’000s)
*
1,328
1,283
1,706
1,356
1,302
Admission fees ($m)
7.3
1.9
4.8
2.6
1.9
Number of exhibitions*
36
31
41
38
38
Collections
Total items (’000s)*
30
29
29
29
28
Total value ($m)
841
825
813
795
782
Acquisitions during the year:
value of purchases ($m)
4.6
10.7
17.2
12.4
5.5
value of donations ($m)
12.1
1.1
1.4
1.7
2.7
total number of items*
676
425
504
467
442
Source: Art Gallery of New South Wales Trust (unaudited).
The annual exhibition program is a major driver of visitor numbers, which were four per cent
higher in 2010–11 than the previous year. In 2010–11, there were a number of successful
ticketed exhibitions including ‘The First Emperor – China’s Entombed Warriors’ and near
record attendance at the Archibald, Wynne and Sulman Prizes.
During the year, the Gallery acquired $16.7 million of artworks, of which $12.1 million were
gifted. These acquisitions included:
x art works from the John Kaldor Family collection valued at $6.0 million. This is part of an
estimated $35.0 million donation. New contemporary galleries featuring the John Kaldor
Family collection were opened in May 2011.
x the $2.2 million purchase of the Last Supper, 1958, by Ian Fairweather.
Art Gallery of New South Wales Trust
There were over
305,000 visitors to
the ‘First Emperor
– China’s
Entombed
Warriors
’
exhibition
This is trial version
www.adultpdf.com
24
NSW Auditor
-
General's Report
Volume Nine 2011
ART GALLERY
OF NEW
SOUTH WALES TRUST
Other Information
Human Resources
Last year, I reviewed the following areas relating to human resources:
x employee age profile to identify the number of employees nearing retirement age and
actions taken to address any risks arising
x management of annual leave balances in excess of threshold policies
x management of excessive flex leave balances.
I made recommendations relating the management of annual leave and flex leave balances.
Comments on the progress of those recommendations follow.
Annual Leave Balances
Last year, I recommended the Gallery establish individual leave plans with employees to
reduce leave balances within an acceptable timeframe. The Gallery has advised that this
issue is under continual review at executive meetings and the number and value of excessive
leave balances reduced at 30 June 2011 compared to the prior year. The value of excessive
leave at 30 June 2011 was $66,000 compared to $75,000 in the previous year.
Flex Leave
Last year, I recommended the Gallery implement a centralised system for monitoring accrued
flex leave balances. This has not occurred. The Gallery advised most of its departments use
standard hours, however, for departments that do use flex leave, consideration will be given to
centralising the management of accrued flex balances.
Financial Information
Abridged Statement of Comprehensive Income
Year ended 30 June
2011
$’000
2010
$’000
Government contributions
31,845
37,345
Sale of goods and services
14,032
7,406
Other
26,492
15,445
Total Revenue
72,369
60,196
Personnel services expenses
22,840
20,109
Operating expenses
19,642
13,890
Depreciation and amortisation
4,688
3,215
Total Expenses
47,170
37,214
Surplus
25,199
22,982
Other Comprehensive Income
Transfer from asset revaluation reserve
(313)
Total Comprehensive Income
24,886
22,982
The $25.2 million surplus includes donated art works, $12.1 million and funding for capital
works projects, $5.9 million.
Government contributions in 2010–11 included a recurrent grant of $24.8 million (2009–10,
$20.7 million) and capital grant of $5.9 million ($15.5 million). The fall in capital funding
reflects the completion of the storage facility at Lilyfield in 2009–10. The major capital project
undertaken in 2010–11 was the construction of the contemporary galleries mentioned above.
This is trial version
www.adultpdf.com
25
NSW Auditor
-
General's Report
Volume Nine 2011
ART GALLERY
OF NEW
SOUTH WALES TRUST
Sale of goods and services revenue and operating expenses both increased, largely due to
the major exhibitions referred to previously.
Other revenue was higher during 2010–11 due to the donated assets received of
$12.1 million, compared to $1.1 million in the previous year.
Abridged Statement of Financial Position
At 30 June
2011
$’000
2010
$’000
Current assets
20,734
27,133
Non-current assets
1,059,172
1,027,902
Total Assets
1,079,906
1,055,035
Current liabilities
6,283
6,299
Non-current liabilities
22
21
Total Liabilities
6,305
6,320
Net Assets
1,073,601
1,048,715
The increase in non-current assets was due to purchased and gifted artwork, and the
completion of the Kaldor Gallery.
Gallery Activities
The Gallery is constituted under the Art Gallery of New South Wales Act 1980. It is subject to
the control and direction of the Minister for the Arts.
For further information on the Gallery, refer to www.artgallery.nsw.gov.au
.
Controlled Entity
The controlled entity has not been reported on separately as it is not material by its size or the
nature of its operations to the consolidated entity.
For further financial and other information on this entity we have listed the entity’s website.
Entity Name
Website
The Australian Institute of Asian Culture and Visual
Arts Limited
www.asianart.com.au
This is trial version
www.adultpdf.com
26
NSW Auditor
-
General's Report
Volume Nine 2011
AUSTRALIAN MUSEUM
TRUST
Audit Opinion
The audit of the Museum’s financial statements for the year ended 30 June 2011 resulted in
an unmodified opinion within the Independent Auditor’s Report.
Operational Snapshot
The Museum propagates knowledge about the natural environment of Australia, particularly in
the natural sciences of biology, anthropology and geology. It engages with local, regional and
remote stakeholders through onsite exhibits and interactive areas and provides innovative
learning services, travelling exhibitions and online services.
In 2010–11, the Museum’s expenses were $39.8 million and it made a surplus of $1.7 million.
Key Issues
Valuation using recollection cost
Recommendation
The Museum should, in collaboration with other similar agencies, and in consultation with
NSW Treasury and the Audit Office, review the application of recollection cost in the valuation
of collections.
The Museum’s financial statements for the year ended 30 June 2011 initially included an
increase in the value of collection assets of $406 million. This increase comprised both
inflation adjustments ($92.8 million) and new additions ($313 million) since the last formal
valuation exercise in 2007–08. The Museum determined the increase using the same basic
methodology used in previous valuation exercises based on guidelines issued by NSW
Treasury. The Museum only performs a full revaluation of its collection, assisted by an
independent expert, every five years as it is a time consuming and expensive exercise.
The adjustment of $406 million would have increased the value of collections in one year by
52.9 per cent to $1.2 billion at 30 June 2011. Following my audit, the increase in collection
assets was reduced from $406 million to $92.8 million.
I concluded that the value of new additions could not be reliably measured. These new
additions included a large number of small biological specimens donated to and collected by
the Museum, particularly in the insect collection. The estimated recollection cost was applied
to each individual specimen, rather than to a group of similar items. This approach led to an
unreasonably large value for these specimens. Furthermore, the estimate of recollection cost
includes an amount for documentation and preparation of the specimens regardless of
whether this has actually been done. There are many collected specimens that have not been
formally catalogued.
The Museum advised that such large increases are likely to continue with the ongoing
acquisition of specimens, either through their own collection efforts, or from the Museum's role
as a repository for external collecting activities. Application of the current recollection valuation
methodology is therefore likely to have a significant future effect on the Museum’s asset
values, and thus on the State's asset values.
The Museum's next comprehensive valuation is due in June 2013. Before that occurs, there
needs to be discussions between NSW Treasury, the Audit Office, the Museum and the
Botanic Gardens Trust (the other agency holding major biological specimens) about the
collection valuation approach.
Australian Museum Trust
The Museum
remain
s
uncertain
as to the benefit
of
valuing its
collection
This is trial version
www.adultpdf.com
27
NSW Auditor
-
General's Report
Volume Nine 2011
AUSTRALIAN MUSEUM
TRUST
The Museum remains uncertain as to the real benefit of the collection valuation process and
outcome, especially as there is no national consistency on scientific specimen collection
valuation. The CSIRO for example, does not place a value on its insect collections.
Collections Database (Repeat Issue)
Recommendation
I again recommend that the Museum complete its program of recording its collections on an
electronic database as soon as possible.
In recent years, I reported the absence of a complete electronic database impacts the
Museum’s ability to discharge its stewardship responsibilities over its collections. Museum
management has advised that it is implementing innovative database options, including the
use of rapid data capture programs. It does this with limited funding from the Australian
Government and any available internal resources.
The Museum has approximately 18.5 million items in its collection, most of which were
collected prior to the advent of electronic records. The capture of this information
electronically is therefore limited by available resources and completion of this task remains
dependent on the availability of further substantial funding.
The Museum estimates that approximately 3.9 million database records will be required to
record the 18.5 million collection items. At 30 June 2011, 1.6 million (41 per cent) of these
records had been completed. In 2010–11, the Museum added approximately 60,000 records
to its collections database, but this amount was inflated because of the pilot volunteer rapid
digitisation project. Based on existing resources, the Museum anticipates adding between
25,000 to 30,000 records per year. At this rate, it will take the Museum 77 to 99 years to
record its current collections in the electronic database.
Performance Information
The Museum provided the following information regarding its performance.
Year ended 30 June
2011
2010
2009
2008
2007
Visitor numbers (’000s)
*
326
375
322
333
318
Admission fees ($m)
2.6
3.3
2.5
1.9
1.8
Temporary exhibitions*
5
8
5
8
9
Website visits (million)*
10.4
9.4
14.0
21.0
23.3
Value of Collection ($m)
860
767
767
767
530
Source: Annual Report 2010–11 (unaudited).
Visitor numbers in 2010–11 decreased by 13.1 per cent over the previous year. The higher
than usual number of visitors in 2009–10 was partly due to the number of students
participating in onsite, educator-led learning experiences and extremely successful major
travelling exhibitions in the previous year. Admission fees were also higher in 2009–10 as the
Museum held three exhibits for which supplementary admissions fees were charged,
compared to two in the current year. The public offering in 2010-11 was also reduced because
of refurbishment and redesign works of education spaces. The statistics highlight the
importance of the Museum being able to accommodate significant temporary exhibitions.
The decline in visitor numbers also impacted revenue from admission fees, which decreased
by 20.5 per cent compared to the previous year. Admission prices in 2010–11 remained the
same as the prior year.
At its current pace
it will take the
Museum between
77 and 99
years
to record its
current collections
in an
electronic
database
This is trial version
www.adultpdf.com
28
NSW Auditor
-
General's Report
Volume Nine 2011
AUSTRALIAN MUSEUM
TRUST
Temporary exhibitions in 2010–11 with supplementary admission fees
Exhibition Name
Exhibition Start Date
Exhibition Finish Date
Visitors
Rituals of Seduction: Birds of Paradise
9 April 2011
7 August 2011
52,587
Wildlife Photographer of the Year/My Photo Studio
4 December 2010
13 March 2011
33,988
Total Attendance
86,575
Temporary exhibitions with no top-up admission fees
Exhibition Name
Exhibition Start Date
Exhibition Finish Date
Banana Kids
16 October 2010
21 November 2010
Yiloga! Tiwi Footy
15 May 2010
14 November 2010
Alive Display and Events Arena
22 May 2010
20 September 2010
Other Information
Human Resources
Last year, I made recommendations in the following areas relating to human resources:
x management of annual leave balances in excess of threshold policies
x use of contract staff.
Comment on the progress on these recommendations follows.
Annual Leave Balances
Last year, I recommended the Museum focus on reducing excess leave balances. The
Museum advises that staff leave balances in excess of 35 days are reported to the executive
monthly for action. A leave management plan is required for staff with a balance of more than
40 days leave. Staff members are actively encouraged by management to use available
leave.
The number of employees with annual leave balances in excess of 40 days decreased from
30 employees at 30 June 2010 to 29 employees at 30 June 2011. There were no employees
with a leave balance in excess of 60 days at 30 June 2011 (one in 2009–10).
Use of Contract Staff
Last year, I recommended the Museum establish a central register of all contractors and
review its use of contractors to ensure it is not excessive and represents value for money.
The Museum advises that its use of contract staff is extremely minimal and given the short-
term duration of most appointments, it does not consider the establishment of a central
register to be either efficient or cost effective.
Performance Audit
In September 2010, I released my performance audit report on ‘Knowing the Collections:
Australian Museum’, which looked at the information the Museum holds on its collections, its
inventory controls and how well it can locate the objects in its care.
The report concluded the Museum is doing much to improve access to its collections.
However, a lack of information on its collections limits its ability to fully achieve its stated
objectives. Despite efforts to digitise its information, much of the collection remains
unregistered or poorly catalogued. Much of the information is still held on paper, cards, slides
and old photographs.
The full report, including the Museum’s response, can be obtained at:
www.audit.nsw.gov.au/publications/reports/performance/2010/museum_collections/collections
_contents.htm.
This is trial version
www.adultpdf.com
29
NSW Auditor
-
General's Report
Volume Nine 2011
AUSTRALIAN MUSEUM
TRUST
Financial Information
Abridged Statement of Comprehensive Income
Year ended 30 June
2011
$’000
2010
$’000
Government contributions
30,637
27,992
Sale of goods and services
7,412
8,053
Other revenue
3,453
2,804
Total Revenue
41,502
38,849
Personal services expenses
23,393
22,819
Other operating expenses
11,486
11,866
Other expenses
4,935
5,791
Total Expenses
39,814
40,476
Surplus/(Deficit)
1,688
(1,627)
Other Comprehensive Income
92,815
Total Comprehensive Income/(Expense)
94,503
(1,627)
In 2010–11, total revenue from all sources increased by $2.7 million. Revenue from the sale
of goods and services declined slightly, mainly due to the decrease in visitor numbers.
Government contributions increased by $2.6 million to fund a range of capital works.
Abridged Statement of Financial Position
At 30 June
2011
$’000
2010
$’000
Current assets
12,487
10,574
Non-current assets
1,120,984
1,027,460
Total Assets
1,133,471
1,038,034
Current liabilities
4,982
4,072
Non-current liabilities
390
366
Total Liabilities
5,372
4,438
Net Assets
1,128,099
1,033,596
The increase in non-current assets resulted mainly from the revaluation of collection assets
mentioned earlier.
Museum Activities
The Museum is constituted under the Australian Museum Trust Act 1975. Trustees are
appointed by the Governor on the recommendation of the Minister for the Arts for a term of up
to three years.
For further information on the Museum, refer to www.australianmuseum.net.au
.
This is trial version
www.adultpdf.com
30
NSW Auditor
-
General's Report
Volume Nine 2011
LIBRARY COUNCIL
OF NEW
SOUTH WALES
Audit Opinion
The audits of the Library and its controlled entity’s financial statements for the year ended
30 June 2011 resulted in unmodified audit opinions within the Independent Auditor’s Reports.
Unless otherwise stated, the following commentary relates to the consolidated entity.
Operational Snapshot
The Library comprises the State Library of New South Wales and the State Library of New
South Wales Foundation. Its main function is to provide library and information services to the
people of New South Wales through the State’s network of public libraries and information
agencies.
The Library incurred expenses of $87.3 million in 2010–11 and made a total surplus for the
year of $4.7 million.
Performance Information
The Library provided the following information regarding its performance:
Year ended 30 June
2011 2010 2009 2008 2007
Onsite Visitor Numbers (’000s)
958
804
*
646
639
Electronic Records
Available (’000s)
2,547
2,2
41
1,921
1,692
1,621
Online Visits (‘000s)
3,143***
2,134
2,074
**
**
Collections
Total items (’000s)
5,475
5,413
5,361
5,280
5,221
Total value ($m)
2,139
2,142
1,873
1,874
1,877
Acquired this year:
dollar value ($m)
6.3
7.0
7.7
6.9
7.1
number of items (’000s)
62.0
52.0
83.0
59.0
63.6
Number of Digital Files
Created (‘000s)
31.6
36.0
21.8
n/a
n/a
* Data not available.
** New measure in 2008–09 to replace web page requests statistics.
*** Google Analytics replaced the WebTrends measurement tool in 2010–11 and therefore online visits is not
comparable with totals previously reported.
(unaudited).
In October 2008, the Library commenced its eRecords project to convert catalogue records
from manual cards to electronic records. In 2010–11, 348,646 new electronic records were
created for maps, manuscripts, pictures, heritage books and reference titles. This
achievement was 34 per cent above target.
The New South Wales Government has committed funding of $12.9 million to support
completion of the project by 2013. At 30 June 2011, approximately 80 per cent of collection
items had been electronically catalogued. Some catalogued items may cover multiple
collection items.
Library Council of New South Wales
The Library has
now recorded
about 80
per
cent
of its collection in
its electronic
catalogue
This is trial version
www.adultpdf.com
31
NSW Auditor
-
General's Report
Volume Nine 2011
LIBRARY COUNCIL
OF NEW
SOUTH WALES
Other Information
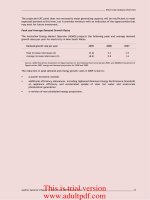
Sale of Goods and Services and Rental Revenue
The ability of the Library to generate commercial revenues is lower than the other State
cultural institutions. This is largely due to the Library’s function as a provider of library services
rather than an organisation that holds major ticketed exhibitions or events.
The chart below shows the trend in the Library’s commercially generated revenues for the last
five years.
Over the last two years, the Library has generated approximately 2.4 per cent of its total
revenue through:
x sales from the bookshop and its online collection
x rental from the operator of the cafe
x venue hire.
Whilst revenue from these sources was slightly higher in 2010–11 than the previous year, it
has declined from levels prior to 2009–10.
During 2010–11, the Library successfully increased internally generated commercial revenue,
due in part to a 34 per cent or $164,000 increase in demand for digital images and the
delivery of 3,803 digital files to external clients. While opportunities to grow revenue in some
traditional commercial areas may be quite limited, particularly given the challenges in the book
selling industry, there may be opportunities to increase revenue through the sale of digital
images, as a result of the eRecords project and the increased number of digital images
available.
Human Resources
Last year, I made recommendations to the Library regarding the management of workforce
ageing, flex leave balances and use of contract staff.
0
0.5
1
1.5
2
2.5
3
2007
2008
2009
2010
2011
$m
Year ended 30 June
Sale of Goods and Services and Rental Revenue
This is trial version
www.adultpdf.com