New South Wales Auditor-General’s Report Financial Audit Volume Nine 2011 Focusing on Education and Communities_part6 potx
Bạn đang xem bản rút gọn của tài liệu. Xem và tải ngay bản đầy đủ của tài liệu tại đây (128.16 KB, 11 trang )
54
NSW Auditor
-
General's Report
Volume Nine 2011
DEPARTMENT OF
EDUCATION AND
COMMUNITIES
Cost of Providing Government School Education
Using departmental statistics of government school enrolments and relevant service group
costs, some broad trends of cost per student for primary and secondary education over the
past four years were:
Year ended 30 Jun
e 2011 2010 2009 2008
Enrolments(a):
Primary students
436,738
432,884
431,447
430,885
Secondary students
316,858
316,129
314,290
307,260
Total
753,596
749,013
745,737
738,145
Service Group Costs(b):
Primary $m
4,671
4,517
4,250
3,904
Secondary $m
4,078
4,019
3,816
3,597
Total $m
8,749
8,536
8,066
7,501
Cost per Student:
Primary $
10,695
10,435
9,851
9,060
Secondary $
12,870
12,713
12,142
11,707
Average $
11,610
11,396
10,816
10,162
Source: DEC Statistics.
a The 2008 to 2011 figures are (unaudited) estimates provided by the Human Resource Planning Unit. The school
enrolments above differ from those published in ACARA, which are sourced from ABS, Schools Australia 2010
(Table 7) and from the Department’s Statistical Compendium
b Service group costs are net cost of services for government primary and secondary schools excluding transfer
payments. Service group costs used in the calculation of cost per student included non-cash items, leave and
superannuation liabilities assumed by the Crown Entity (audited).
Average enrolments increased by 2.1 per cent over the last four years and costs per student
increased by 14.2 per cent over the same period.
Funding of Non-Government School Education by the Department
In 2011, the New South Wales Government provided funding to 934 (926) non-government
schools. Some broad trends of funding per student were:
Year ended 30 June
2011 2010 2009 2008
Average
Enrolments(a):
Primary students
190,204
188,499
187,406
186,537
Secondary students
190,285
187,143
185,451
183,399
Total
380,489
375,642
372,857
369,936
Funding(b):
Primary $m
365
344
336
323
Secondary $m
463
438
422
408
Total $m
828
782
758
731
Funding per Student:
Primary $
1,918
1,824
1,791
1,729
Secondary $
2,436
2,339
2,276
2,224
Average $
2,177
2,080
2,033
1,975
Source: DEC Statistics (unaudited).
a Average enrolments represent those non-government enrolments that qualified and received State recurrent
funding. This does not include full fee paying overseas students.
b Funding is inclusive of per capita grants and interest rate subsidies.
The Department
provided
$828
million to
n
on-g
overnment
s
chools during
2011
In 2011, the New
South Wales
Government
provided an
average of
$2,177 per
non
-
government
school
student
This is trial version
www.adultpdf.com
55
NSW Auditor
-
General's Report
Volume Nine 2011
DEPARTMENT OF
EDUCATION AND
COMMUNITIES
Average enrolments increased by 2.9 per cent over the last four years and funding per
student increased by 10.2 per cent over the same period.
School Facilities and Building Maintenance
Total school maintenance expenditure decreased from $378 million in 2009–10 to
$261 million in 2010–11. This was primarily due to the Australian Government funded school
maintenance programs of $114 million related to National School Pride.
The Department is currently undertaking a conditional assessment of school buildings to
determine the maintenance requirements for the next two years.
Schools
For the school financial year ended 30 November 2010, I audited financial transactions at 56
primary schools, 12 high schools, one central school (K-12) and three senior schools.
I identified opportunities for schools to improve their internal controls and general compliance
with departmental guidelines, which I reported to school principals. Many of my findings were
similar to those of the previous year. The Department advises it communicates common
findings to all schools and directs them to take corrective action.
Human Resources
Annual Leave Balances
Last year, I recommended the Department continue to review the effectiveness of its policies
for managing excessive annual leave balances. During 2010–11, the number of employees
with annual leave balances over 40 days increased from 815 to 838, which represents a
liability of $13.3 million ($12.6 million).
The Department advises that the Human Resources Directorate reviews leave balances
annually. Employees with balances in excess of 40 days are advised to reduce their leave
balance or obtain approval to retain excess leave balances.
Entitlement (days) at 30 June 2011
No. of Employees
Total Days
Liability
$’000
>100
20
2,797
890
81–100
20
1,780
688
61–80
90
6,130
1,759
41–60
708
33,590
9,995
Total
838
44,297
13,332
This is trial version
www.adultpdf.com
56
NSW Auditor
-
General's Report
Volume Nine 2011
DEPARTMENT OF
EDUCATION AND
COMMUNITIES
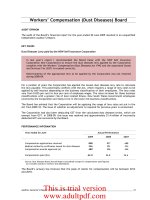
Teacher Age Profiles
I reviewed the employee age profile to identify the number of permanent teachers nearing
retirement age and actions taken to address any risks arising. I found many permanent
teachers are likely to retire over the next five to ten years increasing the risks associated with
the significant loss of knowledge and skills for the Department.
The Department has advised it has strategies in place to manage these risks.
The table below details the age profile of permanent teachers:
At March
2011 2010
Age Group
No. of Teachers
%
No. of Teachers
%
20
–24
745
1.5
842
1.7
25–29
3,941
8.1
3,879
7.9
30–34
5,182
10.6
4,984
10.2
35–39
5,835
11.9
6,084
12.4
40–44
5,873
12.0
5,501
11.2
45–49
5,611
11.5
5,919
12.1
50–54
9,826
20.1
10,647
21.7
55–59
9,055
18.5
8,762
17.8
60–64
2,307
4.7
2,029
4.1
65+
532
1.1
437
0.9
Total
48,907
100.0
49,084
100.0
Source: DEC Personnel system (unaudited).
Statistics show 44.4 per cent (44.5 per cent) of school teachers are aged 50 years or over and
the Department advises many of these employees may retire over the next six years.
To ensure an adequate supply of teachers, the Department continues to undertake
comprehensive workforce planning to develop teacher supply and demand projections for
permanent teachers over a seven year period. These projections are used to advise the
Minister, Director General, universities, and State and Australian Government bodies of changing
needs for permanent teachers in government schools, identify current and potential areas of
shortfall, and develop strategies to address these areas.
.0
5.0
10.0
15.0
20.0
25.0
20–24
25–29
30–34
35–39
40–44
45–49
50–54
55–59
60–64
65 +
%
Age Profile of Permanent Teachers Workforce
2011
2010
Forty four per
cent of New
South Wales
teachers are over
50 years of age
This is trial version
www.adultpdf.com
57
NSW Auditor
-
General's Report
Volume Nine 2011
DEPARTMENT OF
EDUCATION AND
COMMUNITIES
The workforce plan for teachers is updated at least annually and more frequently if needed. In
preparing the plan, the Department:
x monitors the demographic profile of its teaching workforce
x analyses the major supply sources of teachers
x examines factors, such as student enrolments, resignations and retirements, which affect
the demand for permanent teachers.
The Department has a number of initiatives in place to attract people to areas of potential
shortfalls such as:
x active promotion of teaching as a career
x supporting current and future teachers to gain teaching qualifications in curriculum and
specialist areas of workforce need
x teacher education scholarships and retraining programs
x an incentives scheme for rural New South Wales.
The Department advises it has a very stable workforce and the teacher separation rates are
relatively low, varying between three per cent and five per cent since 1997. Several initiatives
have contributed to the retention of experienced teachers, including competitive teacher
salaries, and comprehensive training and mentoring programs.
Use of Contract Staff
Last year, I recommended the Department:
x create and maintain a central record of all contract employees to determine, monitor and
analyse the cost of contract employees, the number of contract employees and the period
of service for all contract employees
x periodically review the roles and responsibilities of all contract employees to ensure:
reliance on contractors is not excessive
use of contract employees instead of permanent employees is appropriate
contractors do not become de facto employees by virtue of being with the Department
for an extended period of time
use of contract employees continues to represent value for money.
The Department advises it is subject to a staffing freeze, except for positions approved by the
Department of Premier and Cabinet, such as those required for major projects like the BER
and LMBR programs. Managers within the Department are required to lodge a business case
and submit it to the Review Committee for endorsement prior to obtaining approval from the
Director-General to engage new contractors or extend the engagement of existing
contractors.
In 2010–11, the Department paid $72.1 million ($76.3 million) to a total of 1,010 contractors.
There were 440 contractors engaged for periods greater than 12 months and 448 new
contractors were engaged during the year. The retention of contract employees for extended
periods may result in additional costs to the Department.
This is trial version
www.adultpdf.com
58
NSW Auditor
-
General's Report
Volume Nine 2011
DEPARTMENT OF
EDUCATION AND
COMMUNITIES
Financial Information
Abridged Statements of Comprehensive Income
Year ended 30 June
Consolidated Parent
2011
$’000
2010
$’000
2011
$’000
2010
$’000
Employee related
8,635,727
8,350,553
7,674,580
7,379,479
Operating expenses
1,970,172
2,085,718
1,598,944
1,731,616
Depreciation and amortisation
467,020
406,060
385,817
329,631
Grants and subsidies
441,050
303,213
511,589
341,260
Other expenses
17,116
11,812
17,116
11,812
Total Expenses
11,531,085
11,157,356
10,188,046
9,793,798
Total Revenue
980,361
998,609
930,357
905,260
Other gains/(losses)
(5,350)
1,743
(2,888)
6,555
Net Cost of Services
10,556,074
10,157,004
9,260,577
8,881,983
Less government contributions
11,970,316
12,262,598
10,648,511
10,907,412
Surplus
1,414,242
2,105,594
1,387,934
2,025,429
Other Comprehensive
Income
/Expense
1,855
(3,215)
60
Total Comprehensive Income
1,416,097
2,102,379
1,387,934
2,025,489
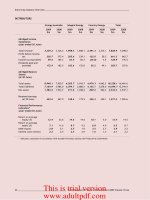
Employee related expenses represent 75.3 per cent (75.4 per cent) of total expenditure. The
$295 million increase was primarily due to a 3.8 per cent salary increase for teachers in
January 2011 and a four per cent salary increase for administrative staff effective July 2010.
Grants and subsidies increased by $170 million primarily due to the amalgamation of the
former Communities NSW and additional grant payments for the National Partnership
Agreement for Productivity Places.
The net decrease in government contributions of $259 million was due to a rise in recurrent
appropriation from the amalgamation of the former Communities NSW, a fall in capital
appropriation due to the completion of BER projects and a $90.1 million fall in employee
benefits accepted by the Crown.
Abridged Statements of Financial Position
At 30 June
Consolidated Parent
2011
$’000
2010
$’000
2011
$’000
2010
$’000
Current assets
938,131
932,085
752,463
745,144
Non-current assets
21,058,667
19,291,514
17,958,802
16,221,370
Total Assets
21,996,798
20,223,599
18,711,265
16,966,514
Current liabilities
953,489
1,013,478
724,384
784,713
Non-current liabilities
356,088
302,617
355,309
301,783
Total Liabilities
1,309,577
1,316,095
1,079,693
1,086,496
Net Assets
20,687,221
18,907,504
17,631,572
15,880,018
Non-current assets increased $1.7 billion due largely to the BER program.
Current liabilities decreased by $60.3 million due mainly to the timing of GST payments.
The increase in non-current liabilities of $53.5 million was due primarily to loans from Treasury
of $55.0 million for the Principals Priority Building Project.
This is trial version
www.adultpdf.com
59
NSW Auditor
-
General's Report
Volume Nine 2011
DEPARTMENT OF
EDUCATION AND
COMMUNITIES
Abridged Service Group Information
The Department’s consolidated net cost of services on a service group basis is detailed
below:
Year ended 30 June
Net Cost of Services Net Assets
2011
Budget
*
$’000
2011
Actual
$’000
2010
Actual
$’000
2011
Actual
$’000
2010
Actual
$’000
Children’s
services
(including all
pre
-schools)
27,070
77,085
28,540
(2,512)
(2,077)
Primary education services in
government schools
4,568,081
4,670,649
4,517,076
10,522,694
8,525,917
Secondary education services in
government schools
4,174,509
4,077,905
4,018,826
5,601,952
6,238,771
Non-government schools
25,716
13,474
12,546
(98)
(99)
TAFE NSW and community
education
1,426,507
1,348,225
1,364,729
3,115,261
3,079,135
Vocational education and
training
265,068
285,694
224,431
(4,715)
(4,266)
Sport and recreation services**
39,239
353,471
Support Aboriginal culture and
community resilience**
8,
486
1,630
Citizenship and communities**
31,612
3,316
Personnel services**
379
(189)
NSW Adult Migrant English
Service (AMES)
3,326
(9,144)
(11,748)
(5,447)
Not Attributable***
1,108,159
1,075,570
Total All Service Groups
10,486,951
10,556,074
10,157,004
20,687,221
18,907,504
* Per the 2010–11 Budget Papers – net of transfer payments.
** These service groups were transferred to the Department on 1 April 2011, hence there are no budget figures for
2011 or comparatives for 2010 and the 2011 figures relate to the three month period ending 30 June 2011.
*** Represents items that could not be reliably allocated to a ‘service group’.
Primary Education Services increased by $154 million from 2009–10 primarily due to:
x employee related expenses increasing by $243 million due to temporary staff costs and
variations in staff entitlements
x Offset by other operating expenses decreasing by $96.5 million due to the completion of
the National School Pride program in 2010.
Vocational Education Services increased by $61.3 million due to additional grant payments for
the National Partnership Agreement for Productivity Places.
Children’s Services, formerly known as Preschool Education Services, increased by
$48.5 million due to the amalgamation of the former Communities NSW in April 2011.
This is trial version
www.adultpdf.com
60
NSW Auditor
-
General's Report
Volume Nine 2011
DEPARTMENT OF
EDUCATION AND
COMMUNITIES
Department Activities
The Department coordinates the delivery of education and training services in New South
Wales from pre-school to tertiary. It is responsible for
x providing school education
x vocational education and training
x certain regulatory and service responsibilities to private schools, private providers of
education and training and universities.
From 1 April 2011, the Department includes the Office of Communities. Its responsibilities
include promoting the interests of children and advancing the wellbeing of the Aboriginal
people of New South Wales, providing more opportunities for participation in volunteering,
sport and recreation and ensuring the sacrifices of war veterans are honoured and
remembered.
Controlled Entities
New South Wales Technical and Further Education Commission (TAFE NSW)
Separate comments on TAFE NSW and its controlled entity TAFE NSW Commission Division
are included elsewhere in this report.
This is trial version
www.adultpdf.com
61
NSW Auditor
-
General's Report
Volume Nine 2011
NEW SOUTH
WALES
TECHNICAL AND FURTHER
EDUCATION COMMISSION
Audit Opinion
The audits of the New South Wales Technical and Further Education Commission (TAFE
NSW) and its controlled entity’s financial statements for the year ended 30 June 2011 resulted
in unmodified audit opinions within the Independent Auditor’s Reports.
Unless otherwise stated, the following commentary relates to the consolidated entity.
Operational Snapshot
Performance Information
Size and Scope of TAFE NSW
Year ended 30 June
2007
–20
10
Change %
Increase/
(Decrease)
2010
2009
2008
2007
Total enrolments
11.8
556,340
524,838
504,009
497,747
Annual student hours (ASH) (’000)
9.8
119,181
119,521
112,660
108,509
Net cost of services* ($’000)
2.0
1,228,779
1,221,636
1,188,845
1,204,231
ASH per enrolment
(1.8)
214
228
224
218
Net cost of services/enrolment ($)
(8.7)
2,209
2,328
2,359
2,419
Net cost of services per ASH ($)
(7.1)
10.31
10.22
10.53
11.10
Source: New South Wales Technical and Further Education Commission (unaudited).
* Net cost of services is for the parent entity for the financial year ended 30 June, whereas enrolments and student
hours are for the calendar year.
TAFE NSW
Total Expenditure in 2010–11 $1.8 billion
556,340 enrolments in 2010
130 campuses across ten Institutes
Provides outcomes for both
students and employers
STUDENTS
Over 1,300 courses ranging from
Certificate to Advanced Diploma
Courses available to those who need
training for their first job, are looking
for additional skills to re-enter the
workforce, or are changing jobs
Offers learning pathways (School to
TAFE, TAFE to University, and
University to TAFE)
EMPLOYERS
TAFE Institutes provide workplace
and customised training programs for:
Local business
Community groups
Government organisations
Large corporations
Qualifications offered are designed in
consultation with Industry
New South Wales Technical and
Further Education Commission
TAFE NSW is
Australia’s largest
vocational
education and
training provider
and is among the
largest in the
world
The average cost
per enrolment
decreased
8.7
per
cent since
2007
This is trial version
www.adultpdf.com
62
NSW Auditor
-
General's Report
Volume Nine 2011
NEW SOUTH
WALES
TECHNICAL AND FURTHER
EDUCATION COMMISSION
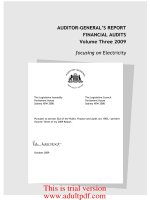
Enrolments have increased by 11.8 per cent while training hours delivered has risen
9.8 per cent since 2007. TAFE NSW advised this is due to an upward trend in higher level
qualifications, with a 26.8 per cent increase in the number of enrolments in qualifications at
Certificate III and above over the same period.
In 2010, 46.3 per cent of all enrolments were in these higher level qualifications compared to
40 per cent in 2006.
Source: New South Wales Technical and Further Education Commission (unaudited).
Higher level qualifications provide better employment outcomes for students and add skills to
the workplace. Increasing the number of people with higher level qualifications has been an
agreed goal of the State and Australian governments for several years.
TAFE NSW provided the following enrolment and graduation information relating to equity
groups:
Equity Group
Number of
Enrolments
2010
Increase/(Decrease)
in Enrolments
2006 to 2010
%
Increase/(Decrease)
in Graduates
2006 to 2010
%
Gap
Aboriginal students
35,198
51.4 41.6
(12.5)
Unemployed students
135,390
50.3
27.7
(22.6)
Language background other than
English
130,175
29.8
24.9
(4.9)
Regional/remote students
278,446
10.9
(0.1)
(11.0)
Students with a disability
54,220
4.6
(19.2)
(23.8)
Source: New South Wales Technical and Further Education Commission (unaudited).
TAFE NSW has strategic initiatives in place to improve the learning outcomes for all students.
Enrolment and graduation levels for Aboriginal and unemployed students have shown positive
increases since 2006. However, a continued focus is required on the needs of students in
regional and remote areas and those with disabilities.
35.0
40.0
45.0
50.0
55.0
60.0
65.0
2006
2007
2008
2009
2010
%
TAFE NSW Enrolments: Qualification Level
Enrolments in Certificate II or below
Enrolments in Certificate III or above
There has been a
26.8 per cent
increase in the
number of
enrolments in
higher level
qualifications
since 2006
There has been a
51.4 per
cent
increase in
Aboriginal student
enrolments from
2006
This is trial version
www.adultpdf.com
63
NSW Auditor
-
General's Report
Volume Nine 2011
NEW SOUTH
WALES
TECHNICAL AND FURTHER
EDUCATION COMMISSION
Other Information
Capital Works in Progress
For the past four years I have reported the need to better manage the review and transfer of
completed works in progress to an asset class. Last year, TAFE NSW advised a new process
was being implemented to review assets under construction which have not been transferred
to the fixed asset register at month end.
The balance of completed projects included as capital works in progress totalled $76 million at
30 June 2011 ($73.5 million at 30 June 2010) and included projects completed in prior
financial periods.
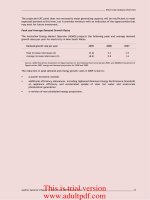
Human Resources
Workforce Ageing
Last year, I reviewed the employee age profile to identify the number of permanent teachers
nearing retirement age and actions taken to address any risks arising. I found a large number
of permanent teachers are likely to retire over the next five to ten years increasing the risk of
significant loss of knowledge and skills for TAFE NSW.
TAFE NSW advised it has strategies in place to manage this risk including knowledge transfer
strategies, phased retirements and the provision of flexible work options. To ensure an
adequate supply of teachers, TAFE NSW undertakes regular workforce planning to ensure it
has the appropriate skilled teaching workforce to meet its needs. TAFE NSW also has
initiatives in place to attract new teachers such as developing targeted recruitment
campaigns, retention of younger teachers and promoting TAFE teaching as a career.
The age profile of TAFE NSW’s permanent teachers is shown below:
Year ended 30 June
2011 2010
Age
group
No
.
of Teachers
%
No
.
of Teachers
%
25
–29 17
0.4
19
0.4
30–34
80
1.8
79
1.8
35–39
223
5.2
250
5.7
40–44
411
9.6
411
9.3
45–49
698
16.3
770
17.5
50–54
1,031
24.0
1,071
24.3
55–59
1,156
27.0
1,163
26.4
60–64
500
11.7
487
11.1
65 +
170
4.0
154
3.5
Total
4,286
100.0
4,404
100.0
Source: Workforce Profile (headcount), New South Wales Technical and Further Education Commission (unaudited).
67 per cent of
permanent TAFE
NSW teachers are
over 50 years of
age
This is trial version
www.adultpdf.com
64
NSW Auditor
-
General's Report
Volume Nine 2011
NEW SOUTH
WALES
TECHNICAL AND FURTHER
EDUCATION COMMISSION
Extent of Contract Staff
Last year, I recommended TAFE NSW:
x create and maintain a central record of all contract employees to determine, monitor and
analyse the cost of contract employees, the number of contract employees and the period
of service for all contract employees
x periodically review the roles and responsibilities of all contract employees to ensure:
reliance on contractors is not excessive
use of contract employees instead of permanent employees is appropriate
contractors do not become de facto employees by virtue of being with TAFE NSW for
an extended period of time
use of contract employees continues to represent value for money.
Managers within TAFE NSW are required to lodge a business case and obtain approval from
the managing director prior to engaging new contractors or extending the engagement of
existing contractors.
All business cases are submitted to the review committee for endorsement prior to obtaining
approval from the managing director.
.0
5.0
10.0
15.0
20.0
25.0
30.0
25–29
30–34
35–39
40–44
45–49
50–54
55–59
60–64
65 +
%
Age Profile of Permanent Teachers Workforce
2011
2010
This is trial version
www.adultpdf.com