New South Wales Auditor-General’s Report Financial Audit Volume Nine 2011 Focusing on Education and Communities_part7 potx
Bạn đang xem bản rút gọn của tài liệu. Xem và tải ngay bản đầy đủ của tài liệu tại đây (131.75 KB, 11 trang )
65
NSW Auditor
-
General's Report
Volume Nine 2011
NEW SOUTH
WALES
TECHNICAL AND FURTHER
EDUCATION COMMISSION
Financial Information
Abridged Statements of Comprehensive Income
Year ended 30 June
Consolidated Parent
2011
$’000
2010
$’000
2011
$’000
2010
$’000
Employee related
968,022
954,767
Personnel services
352,176
338,132
1,272,798
1,242,514
Other operating expenses
363,591
376,090
363,591
376,090
Depreciation and amortisation
81,183
76,409
81,183
76,409
Total Expenses
1,764,972
1,745,398
1,717,572
1,695,013
Total Revenue
480,091
471,046
480,091
471,046
Other losses
(2,464)
(4,812)
(2,464)
(4,812)
Net Cost of Services
1,287,345
1,279,164
1,239,945
1,228,779
Government contributions
1,321,805
1,355,186
1,274,405
1,304,801
Surplus
34,460
76,022
34,460
76,022
Other Comprehensive Income
27
27
Total Comprehensive Income
34,460
76,049
34,460
76,049
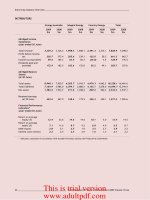
Employee related and personnel services expenses have increased by 2.1 per cent from 2010
as a result of movements in salaries of teaching and non-teaching staff.
In 2009–10, additional Australian Government contributions of $35.6 million were received for
investment in infrastructure, accounting for 85.6 per cent of the decrease in comprehensive
income in 2010–11.
Abridged Statements of Financial Position
At 30 June
Consolidated Parent
2011
$’000
2010
$’000
2011
$’000
2010
$’000
Current assets
210,656
204,870
210,656
204,870
Non-current assets
3,099,835
3,070,095
3,099,835
3,070,095
Total Assets
3,310,491
3,274,965
3,310,491
3,274,965
Current liabilities
242,317
241,196
243,096
242,030
Non-current liabilities
779
834
Total Liabilities
243,096
242,030
243,096
242,030
Net Assets
3,067,395
3,032,935
3,067,395
3,032,935
Current assets increased primarily due to a rise in cash and cash equivalents of $11.1 million.
The increase in non-current assets was largely due to additional assets under construction at
30 June 2011 recognised within Land and Buildings.
Commission Activities
TAFE NSW was constituted by the Technical and Further Education Commission Act 1990 as
a statutory body corporate.
Its principal objective is to provide relevant technical and further education services to
industry, students and other client groups.
This is trial version
www.adultpdf.com
66
NSW Auditor
-
General's Report
Volume Nine 2011
NEW SOUTH
WALES
TECHNICAL AND FURTHER
EDUCATION COMMISSION
TAFE NSW provides vocational and pre-vocational education and training services through its
ten institutes and the Open Training and Education Network (OTEN). While the institutes and
OTEN observe TAFE NSW’s policies and priorities, they develop their own education and
training profiles and manage their own operations.
Since December 1997, TAFE NSW has been a controlled entity of the Department of
Education and Communities.
TAFE NSW is subject to the control and direction of the Minister for Education.
For further information on TAFE NSW, refer to www.tafensw.edu.au
.
The four metropolitan institutes are Northern Sydney, South Western Sydney, Sydney and
Western Sydney. The six country institutes are Hunter, Illawarra, New England, North Coast,
Riverina and Western.
Controlled Entity
The following controlled entity has not been reported separately on as it is not considered
material by its size or nature of operations to the consolidated entity.
New South Wales Technical and Further Education Commission Division
The Division provides personnel services to TAFE NSW.
This is trial version
www.adultpdf.com
67
NSW Auditor
-
General's Report
Volume Nine 2011
DEPARTMENT OF
FAMILY
AND COMMUNITY SERVICES
Audit Opinion
The audits of the Department and its controlled entities’ financial statements for the year
ended 30 June 2011 resulted in unmodified audit opinions within the Independent Auditor’s
Reports.
Unless otherwise stated, the following commentary relates to the consolidated entity.
Operational Snapshot
The Department delivers services to some of the most disadvantaged individuals, families and
communities in NSW. The net cost of providing the Department's services for the year was
$4.2 billion ($4.0 billion in 2009–10). The main divisions of the Department are: Community
Services
(net cost $1.6 billion); Ageing, Disability and Home Care (ADHC) ($2.4 billion); and
Juvenile Justice ($134.0 million).
Key Issues
Transfer of functions to and from the Department of Family and Community
Services
Effective 1 April 2011, the Department of Human Services changed its name to the
Department of Family and Community Services (the Department) as a result of the Public
Sector Employment and Management (Departments) Order 184/2011. In addition the
following transfers took place:
x the group of staff comprising the Juvenile Justice Division as well as the Guardianship
Tribunal were transferred to the Department of Attorney General and Justice
x the group of staff principally involved in the provision of disaster welfare assistance was
added to the Ministry for Police and Emergency Services
x Aboriginal Affairs NSW was transferred to the Department of Education and Communities
x The Office for Women’s Policy was removed from the Department of Premier and Cabinet
and added to the Department.
Special Commission of Inquiry into Child Protection Services (the Wood
Commission)
Recommendation
I recommend the Department addresses the Ombudsman’s recommendations.
The Wood Commission Report into child protection services in New South Wales was
released in November 2008, and contained 111 recommendations. ‘Keep Them Safe: A
shared approach to child wellbeing (2009–2014)’ (KTS) was the former government’s
response to the inquiry, and outlined more than 100 different strategies and actions to be
implemented by a range of human service and justice agencies.
Department of Family and Community
Services
This is trial version
www.adultpdf.com
68
NSW Auditor
-
General's Report
Volume Nine 2011
DEPARTMENT OF
FAMILY
AND COMMUNITY SERVICES
Earlier this year, the NSW Ombudsman examined whether Community Services’ capacity to
adequately respond to children assessed as being at risk of significant harm has improved, as
a result of changes introduced to the child protection system through KTS. In August 2011,
the Ombudsman in his Special Report to Parliament recommended that within six months the
Department should:
x develop an action plan for publicly reporting on its responses to risk of significant harm
reports
x provide public advice on its proposals for ongoing and meaningful reporting of:
the productivity and/or efficiency outcomes that are achieved
the numbers of filled positions against the agency’s staffing establishment
its ability to successfully retain staff
x provide public advice on whether it intends to adopt an intelligence driven child protection
system
x provide public advice on whether it intends to develop a reporting tool that can rapidly
generate consolidated child protection history reports
x together with the Department of Premier and Cabinet (DPC) and other human service and
justice agencies make public the actions proposed in relation to the key challenges
outlined in the report
x in relation to the need to review ‘where we are at’ in delivering on the Wood inquiry’s
vision, DPC should within two months make public its proposal for conducting this review.
Community Services advises that, at 30 June 2011, for those Wood Commission
recommendations for which it is the lead agency:
x 44 of the 70 recommendations have been implemented and two are almost complete. Of
those completed, all but three were completed within timeframe
x four of the 21 immediate recommendations have commenced, one is almost complete
and three have been completed
x of the 35 short-term recommendations, 25 have been completed or are almost complete
and the others have commenced
x work has commenced on most of the long-term recommendations.
Community Services advises delays in commencing recommendations are generally due to
competing priorities and limited staff and/or fiscal resources.
Whilst Community Services plays a major role in implementing KTS, the DPC oversees the
KTS action plan and works with relevant agencies to ensure it is implemented. The status of
all recommendations is monitored by the KTS Senior Officers Group led by DPC, which
reports regularly to the Justice and Human Services Chief Executive Officers Group. The DPC
KTS Implementation Unit monitors compliance with all Wood Commission recommendations
via monthly reports from Community Services and other lead agencies.
This is trial version
www.adultpdf.com
69
NSW Auditor
-
General's Report
Volume Nine 2011
DEPARTMENT OF
FAMILY
AND COMMUNITY SERVICES
Out-of-Home Care Accreditation
In 2003, Community Services received interim accreditation for the provision of Out-of-Home
Care (OOHC) services until June 2013. Community Services is currently participating in the
Children’s Guardian’s Quality Improvement Program, which requires it to meet OOHC
standards by June 2013 to achieve full accreditation. Community Services advises that it has
provided the Children’s Guardian with indirect evidence for all standards and is participating in
a program of case file audits and onsite assessments to enable Children’s Guardian staff to
assess direct evidence. Work is underway with the Children’s Guardian to develop an onsite
assessment program for 2012.
To help it achieve accreditation, Community Services advises it is:
x implementing a case planning framework, procedure and template
x clarifying the roles and responsibilities of client service and casework managers
x consolidating operational procedures and casework requirements
x revising client file procedures and streamlining recording of paper and electronic files
x reviewing, and where necessary revising, procedures relating to the assessment,
authorisation, training, support and review of relative and kinship carers
x participating in an annual program agreed with the Children’s Guardian, which included
case file audits and onsite assessments in 2011
x having its accreditation readiness audited to identify gaps in the current work program and
identify what might be done to address the gaps.
Caseworker Workload
Last year, I recommended the Department make concerted efforts to fill vacant Community
Services caseworker positions. The average number of vacant caseworker positions
decreased from 497 in 2009–10 to 166 in 2010–11.
The Department advises that in 2010–11 an aggressive advertising campaign focusing on
caseworker attraction resulted in 3,337 applications for positions, including 298 Aboriginal
positions. From these, 512 permanent and temporary offers of employment were accepted, of
which 41 were in rural and remote locations of far western New South Wales, and 45 were in
Aboriginal caseworker positions.
Evidence suggests, however, that this strategy has had no impact on the caseworker to child
ratio in OOHC. It remains at one to 29, more than double the KTS recommendation of one
caseworker to 12 children and young persons. The Department advises:
x a caseload benchmark study completed in 2010 determined that Community Services’
caseworker resources would need to increase by 40 per cent to achieve an accreditable
standard of casework practice. An increase in resources of this magnitude is unlikely and
significant improvement in the caseworker to child ratio is therefore also unlikely until
more OOHC cases are transferred to the Non-Government Organisation (NGO) sector
x a Ministerial Advisory Group, comprising government and non-government
representatives, aims to agree a transition plan by the end of 2011. Additional funding of
$8.0 million has been allocated in 2011–12 to allow the transition process to commence
from January 2012
x other initiatives are underway to curb the entry of children in OOHC, such as reframing
early intervention programs and family support and restoration pilots.
Out-of-Home Care Placement Reviews
Placement reviews for children in OOHC are not always performed at appropriate intervals to
meet statutory requirements. Section 150 of the Children and Young Persons (Care and
Protection) Act 1998 requires placement of a child or young person to be reviewed at least
every 12 months.
Ongoing out of
home care service
delivery
is at
significant risk if
Community
Services cannot
maintain
its
accreditation
The Out
–of-
Home
Care caseworker
to clients’ ratio
remains
significantly more
than desired
benchmark
More Out
-of-
Home Care cases
need to transfer to
non
-
government
organisations to
achieve quality
casework and to
meet statutory
requirements
This is trial version
www.adultpdf.com
70
NSW Auditor
-
General's Report
Volume Nine 2011
DEPARTMENT OF
FAMILY
AND COMMUNITY SERVICES
Last year, I recommended the Department adhere to statutory requirements by ensuring
Community Services placement reviews for children and young persons in OOHC are
performed as required. In response the Department advises that timely reviews for all OOHC
cases, including unallocated cases, will not be resolved until more OOHC cases are
transferred to the NGO sector.
Grants Acquittals
Last year, I recommended the acquittal process for Community Services’ grants, which are
made to service providers, be re-examined and strengthened. In response Community
Services has approved a project proposal to examine:
x acquittal obligations and procedures for service providers
x learning and development activities for Community Services staff in the areas of financial
management and acquittal procedures
x availability and take up of training for service providers on financial management
x the need for specialist audit resources to support funding staff in their monitoring and
oversight role.
The project proposal requires the results of this review be reported to Community Services’
Audit and Risk Committee. I will continue to monitor progress of these intended actions.
Major IT Projects
Last year, I recommended the Department implement formal project governance structures
and project management procedures for all Community Services’ major IT projects. I also
recommended it conduct benefit realisation reviews when major IT projects are implemented.
In response, the Department advises Community Services has been using a structured
project methodology for several years and is currently developing a project management
framework for IT projects based on best practice.
Performance Information
Statutory Child Protection
The table below provides statistics relating to child protection.
Year ended 30 June
2011
2010
2009
2008
2007
Total child protection reports/child
concern reports
215,272
256,088
309,676
303,121
286,033
Rate per 1,000 children and young
people 0
–
17 years who were subject of
a report referred for further assessment
37.3
55.4
71.1
65.7
65.1
Number of reports referred for further
assessment
98,845
163,200
226,946
209,015
201,208
Volume of Helpline calls entered
151,213
174,597
188,580
170,818
148,658
Volume of Helpline calls answered
120,931
151,303
166,228
152,037
132,433
Average waiting time (minutes)
3:49
2:58
2:51
2:56
2:59
Source: Department of Family and Community Services (unaudited).
The continued decrease in the first three statistics above reflects the full year’s impact of
legislative changes effective from 24 January 2010. The main change included raising the
reporting threshold from ‘risk of harm’ to the ‘risk of significant harm’.
The average
waiting
time on
the children and
young persons’
Helpline
increased by
almost one
minute from 2:58
to 3:49 minutes in
2010
–11
This is trial version
www.adultpdf.com
71
NSW Auditor
-
General's Report
Volume Nine 2011
DEPARTMENT OF
FAMILY
AND COMMUNITY SERVICES
The volume of Helpline calls entered has decreased by 19.8 per cent since 2008–09, but the
average waiting time per call has increased by almost one minute – from just under three
minutes to three minutes and 49 seconds in 2011. This is the first time since 2007 that the
average waiting time has exceeded the Helpline’s target of three minutes. The Department
advises that since the threshold for reporting a matter to Helpline was raised to ‘risk of
significant harm’, the number of reports requiring a ‘less than 24 hour’ response has
increased. Prior to this, the Helpline received just over 5,000 ‘less than 24 hour’ reports per
quarter. This number has increased to over 6,000 reports per quarter more recently, impacting
the Helpline's ability to manage call spikes.
Real Recurrent Expenditure on Child Protection Services
The ‘Productivity Commission Report on Government Services 2011’ shows expenditure
varies greatly between the States and Territories on child protection services ‘per notification’,
‘investigation’ and ‘substantiation’. These terms are defined below:
x a notification is contact with an authorised department by persons or other bodies making
allegations of child abuse, neglect, or harm to a child
x an investigation is looking into child abuse and neglect that involves identifying harm or
risk of harm to the child, determining an outcome and assessing protective needs
x a substantiation concludes there is reasonable cause to believe a child has been, is being
or is likely to be abused, neglected or otherwise harmed.
The Department advises that care needs to be taken when interpreting the data. Because no
two jurisdictions use the same expenditure criteria, the data cannot be reliably compared
across jurisdictions due to differences in legislation, policy and practice. New South Wales
adopted a new methodology in 2009–10 and has the widest definition of the term ‘notification’
which captures a broader range of child protection issues than in most other states.
Between 2008–09 and 2009–10, New South Wales’ expenditure on child protection services
increased per notification, investigation and substantiation by more than 75 per cent.
The data below compares New South Wales’ expenditure on child protection services in
2009–10 with other jurisdictions:
x at $2,291 per notification, New South Wales was lower than the national average of
$3,605. Queensland had the highest expenditure at $10,555 per notification, whilst the
Australian Capital Territory had the lowest at $1,004
x at $3,256 per investigation, New South Wales was the lowest of all states and Western
Australia had the highest expenditure of $13,587
x at $13,657 per substantiation, New South Wales was again the lowest of all states and
Western Australian again had the highest expenditure of $37,142.
The Department advises that:
x due to New South Wales’ wider definition of ‘notification’ it has a higher rate of
notifications, making real expenditure appear lower than in most other States
x the increase in expenditure per notification investigated and substantiated is due to a drop
in notifications investigated and substantiated.
This is trial version
www.adultpdf.com
72
NSW Auditor
-
General's Report
Volume Nine 2011
DEPARTMENT OF
FAMILY
AND COMMUNITY SERVICES
Children Aged 0–17 Years in Protection Notifications, Finalised Investigations and
Substantiations
Indigenous children continue to be over-represented in the child protection system.
Year ended 30 June
NSW
National
Average
NSW
National
Average
NSW
National
Average
2010*
2010*
2009**
2009**
2008
***
2008
***
Children
Aged 0–17 Years in Notifications (Rates per 1,000 Children) (a)
Indigenous (a)
218.3
140.2
260.9
152.2
256.2
143.8
Non-indigenous
40.8
27.1
63.7
37.8
59.1
36.5
All children
54.2
36.8
72.2
43.1
67.0
41.3
Children Aged 0–17 Years in Finalised Investigations as a Proportion of Children in
Notifications (
b)
Indigenous %
73.5
61.8
71.1
61.8
70.0
61.8
Non-indigenous %
59.4
49.7
53.5
46.9
52.1
45.7
All children %
57.4
47.9
56.3
49.3
54.9
48.2
Children Aged 0–17 Years in Substantiations as a Proportion of Children in Finalised
Investigations
(b)
Indigenous %
32.8
40.7
30.7
39.2
29.6
39.7
Non-indigenous %
24.8
34.1
20.5
30.4
21.9
33.0
All children %
25.8
34.9
22.5
32.2
23.5
34.3
Sources:
* Productivity Commission Report on Government Services 2011.
** Productivity Commission Report on Government Services 2010.
*** Productivity Commission Report on Government Services 2009.
a Data on the number of notifications by Indigenous status should be interpreted with care. These data are
collected very early in the child protection process and often before the agency has full knowledge of the child's
family circumstances. As a result of this lack of full knowledge and the other inherent difficulties in identifying
Indigenous status, these data are not considered to have a high level of reliability.
b Prior to 2009–10, rates of children in notifications, investigations and substantiations were calculated as the
number of children aged 0–16 years in each category (including children whose ages were not stated) divided by
the estimated population of children aged 0–16 years at 31 December, multiplied by 1000. For Indigenous
children, the June projections for two years were averaged to obtain a population figure for December of the
relevant year. For 2009–10, rates of children in notifications, investigations and substantiations are calculated as
the number of children aged 0–17 years in each category (including children whose ages were not stated) divided
by the estimated population of children aged 0–17 years at 31 December, multiplied by 1000.
(unaudited).
Over the past three years, the gap in the number of indigenous children in notifications per
1,000 children aged 0–17 in New South Wales has decreased when compared to the national
average. In 2008, the gap was 112.4 compared to 78.1 in 2010. The gap in the proportion of
indigenous children subject to substantiation also dropped over the same period.
In 2010, the proportion of indigenous children subject to finalised investigations in New South
Wales was 11.7 per cent higher than the national average, an increase from 8.2 per cent in
2008.
Indigenous
children continue
to be over-
represented in
the child
protection system
This is trial version
www.adultpdf.com
73
NSW Auditor
-
General's Report
Volume Nine 2011
DEPARTMENT OF
FAMILY
AND COMMUNITY SERVICES
Supported Accommodation
This program provides accommodation to people with a disability to help them live in suitable
accommodation and participate in the community. Services are provided directly by ADHC or
through NGOs it funds.
The table below provides statistics for the past five years relating to clients in supported
accommodation places.
Year ended 30 June
2011
2010
2009
2008
2007
Number of supported accommodation
places
9,540
9,283
8,766
7,560
7,496
Number of supported accommodation
places provided by
ADHC
2,733
2,666
2,711
2,642
2,671
Number of supported accommodation
places provided by
NGOs
6,807
6,617
6,055
4,918
4,825
Total Expenditure Incurred on
Supported
A
ccommodation ($’000)
1,090,122
1,105,550
1,006,356
938,096
921,182
Source: Department of Family and Community Services (unaudited).
The total number of supported accommodation places increased by 257 in 2010–11. This
includes an increase of 190 places provided by NGOs and 67 places provided by ADHC.
Ongoing Community Support
This program provides a range of services to older people and people with a disability,
including community services, respite skills development and day programs, and a wide range
of personal assistance services.
The following table shows information for the past three years relating to Ongoing Community
Support services.
Year ended 30 June
2011 2010 2009
Number of Home and Community Care (HACC)
services
1,739
1,818
1,767
Number of disability services
4,841
4,552
4,295
Number of people accessing disability and HACC
services
323,000
297,000
280,000
Number of people receiving respite services
65,000
61,000
51,100
Number of people receiving personal assistance
203,000
188,000
191,000
Total Expenses Incurred on Ongoing Community
Support ($’000)
978,618
872,417
817,052
Source: Department of Family and Community Services (unaudited).
Between 2009 and 2011, the number of people accessing disability and HACC services
increased by 15.4 per cent. ADHC advises the increase reflects growth in funding due to an
ageing population in HACC services and prior unmet needs.
The number of people receiving respite services rose by 27.2 per cent between 2009 and
2011. ADHC advises the increase reflects growth in disability respite funding and the
reclassification of the HACC assistance type ‘Social Support’ and associated outputs to the
‘Respite’ service group in 2010.
For the three years 2009 to 2011, the number of funded disability services increased by
12.7 per cent. ADHC advises the increase reflects the number of individualised funding
arrangements that existed in the year.
People accessing
disability and
home and
community care
services
increased by
nine
per
cent to
323,000 in 2011
This is trial version
www.adultpdf.com
74
NSW Auditor
-
General's Report
Volume Nine 2011
DEPARTMENT
OF FAMILY
AND COMMUNITY SERVICES
Total expenses incurred on Ongoing Community Support rose by 19.8 per cent for the three
years 2009 to 2011. The increase was mainly due to growth and indexation of $93.0 million
for HACC State Plan, and $25.5 million expense for the Stronger Together initiatives.
ADHC advises that under the National Health and Hospitals Network Agreement there will be
a split of responsibilities for aged care and disability programs at age 65 (age 50 for
Indigenous Australians), with the Australian Government to assume full responsibility for aged
care services under the HACC Program from 1 July 2012.
Other Information
Repeat Management Letter Issues
Last year, I recommended the Department address, as a priority, repeat management letter
issues. Although there has been some improvement, some areas remain where the
Department may still be exposed to business risks. These areas relate to excessive annual
leave balances, salary overpayments and review of computer vendor master file records.
Human Resources
I have reviewed actions taken by the Department to address recommendations I made last
year relating to human resource issues.
Excessive Annual Leave Balances
Managing excessive annual leave balances remains a challenge for the Department. While
total staff numbers with annual leave balances exceeding 40 days has fallen by 172, a
significant number of staff still have excessive leave balances.
Annual Leave Entitlement (Days)
At 30
June
Shift Workers Administrative Staff
2011 2010 2011 2010
41
–60 713 657 320 553
61–90
227
197
41
70
91–120
37
32
11
8
120+
10
11
4
7
Total
987
897
376
638
Source: Department of Family and Community Services (unaudited).
Excess leave balances can adversely affect an organisation. The associated financial liability
generally increases over time as salaries increase and staff may be adversely affected
through possible workplace health and safety issues.
The Department advises it actively manages excess annual leave balances through:
x system notifications to managers and employees when annual leave balances reach
30 days and 40 days
x monthly reporting to business areas on staff with excess leave including automated
reminders to staff and their managers
x system changes to assist managers and staff to monitor leave balances more effectively
including notification letters for all non human resources system users and part-time staff.
This is trial version
www.adultpdf.com
75
NSW Auditor
-
General's Report
Volume Nine 2011
DEPARTMENT OF
FAMILY
AND COMMUNITY SERVICES
Flex Time Balances
Last year, I reported the Department did not know the extent of flex time being accrued and
forfeited by employees, as it did not record this information centrally. Records were
decentralised and manually maintained by each business unit. I recommended the
Department develop mechanisms to centrally review flex time records to ensure excessive
flex time was not being accrued and forfeited by employees.
In response, the Department advises that currently leave and attendance hours are recorded
on spreadsheets and maintained locally across the Department. It is the responsibility of
managers to monitor leave and attendance, to ensure excessive flex time is not being accrued
and forfeited by staff. Within ADHC, 69 per cent of staff are rostered staff and do not receive
flex time, significantly lowering the risk of excessive flex time being accrued and forfeited.
The Department also advises that centralised time and attendance recording is being
considered as part of its Enterprise Resource Management Program. This would enable flex
time records to be monitored centrally as well as standardise flex time policy arrangements
across the different divisions.
Employment of Contract Employees
Last year, I reported the Department’s practices for managing contractors were not consistent
across its divisions. I recommended the Department periodically review the roles and
responsibilities of all contract employees to help ensure reliance on contractors is not
excessive; use of contract employees instead of permanent employees is appropriate;
contractors do not become de facto employees by virtue of being with the Department for an
extended period of time; and use of contract employees continues to represent value for
money.
In response, the Department advises:
x the use of contractors is monitored through the level of expenditure by business area
x contractors in non-frontline areas are subject to the public sector recruitment freeze
x Chief Executives approve business cases for the recruitment or extension of contractors
in non-frontline areas.
The Department also advises its current Enterprise Resource Management program will
introduce an online system to manage the Department’s contractors by mid-2012. This will
improve visibility of contract durations, end dates and volumes.
This is trial version
www.adultpdf.com