New South Wales Auditor-General’s Report Financial Audit Volume Nine 2011 Focusing on Education and Communities_part8 potx
Bạn đang xem bản rút gọn của tài liệu. Xem và tải ngay bản đầy đủ của tài liệu tại đây (126.67 KB, 11 trang )
76
NSW Auditor
-
General's Report
Volume Nine 2011
DEPARTMENT OF
FAMILY
AND COMMUNITY SERVICES
Vacant Shift Worker Positions
The Department has a range of differing personnel employee requirements. Within the ADHC
division there are two main categories of shift workers, namely nurses who care for clients
with complex health care needs, and disability support workers who provide clients with
personal development and community integration. They both also help develop and
implement individual support plans.
At 30 June
2011 2010 2009
Nurses
Disability
Support
Workers**
Nurses
Residential
Support
Workers**
Nurses
Residential
Support
Workers**
Number of Full Time
Equivalent (FTE) shift worker
positions available*
1,487
2,450
1,420
2,355
1,365
2,373
Number of FTE shift worker
positions vacant
239
246
225
306
286
394
Proportion of FTE positions
vacant to FTE
positions
available (%)
16.1
10.0
15.8
13.0
21.0
16.6
Source: Department of Family and Community Services (unaudited).
* ADHC advised that the use of ‘available’ positions to determine vacancies for residential support workers includes positions maintained to
allow for workforce flexibility, not all of which will be filled. The precise mix of permanent, casual and agency staff used to deliver services
at any one time will vary according to operational need, as well as vacancies and staff absences. They also advised this applies to group
homes (see below under ‘Vacant Permanent Staff Positions’).
** Disability Support Workers were known as Residential Support Workers prior to the implementation of the Community Living Award in
October 2010.
Since 2009, the number of vacant shift worker positions relative to positions available has
decreased by 4.9 per cent for nurses and 6.6 per cent for disability support workers. ADHC
advises the decrease in vacancies reflects ongoing recruitment action.
Vacant Permanent Staff Positions
In 2011, within the ADHC division, the number of unfilled positions within Community Support
Teams (CSTs) and group homes improved significantly. At 30 June 2011, no vacant positions
existed within the CSTs and, since 2009, the number of vacant positions within group homes
relative to positions available decreased by 5.5 per cent.
ADHC advises the level of vacancies in CSTs in 2009 reflected an increase in the number of
positions following increased funding under Stronger Together. These vacancies were for
specialist roles that have taken some time to fill.
At 30 June
2011 2010 2009
Community
Support
Teams
Group
Homes
Community
Support
Teams
Group
Homes
Community
Support
Teams
Group
Homes
Number of FTE positions
available
968
2,440
853
2,305
825
2,311
Number of FTE positions
vacant
249
16
259
77
362
Proportion of vacant FTE
positions to FTE positions
available (%)
10.2
1.9
11.2
9.3
15.7
Source: Department of Family and Community Services (unaudited).
This is trial version
www.adultpdf.com
77
NSW Auditor
-
General's Report
Volume Nine 2011
DEPARTMENT OF
FAMILY
AND COMMUNITY SERVICES
Financial Information
Abridged Consolidated Statement of Comprehensive Income
Year ended 30 June
Consolidated Parent
2011
$’000
2010
$’000
2011
$’000
2010
$’000
Employee related
1,674,210
1,609,415
1,508,449
1,450,740
Grants and subsidies
2,424,136
2,258,577
2,608,380
2,437,846
Other expenses
475,221
482,177
422,112
432,675
Operating Expenses
4,573,567
4,350,169
4,538,941
4,321,261
Operating Revenue
429,298
426,476
391,215
378,155
Other losses
10,848
60,849
11,248
58,114
Net Cost of Services
4,155,117
3,984,542
4,158,974
4,001,220
Government contributions
4,244,297
4,096,133
4,244,297
4,096,133
Surplus
89,180
111,591
85,323
94,913
Other Comprehensive Income/(Expense)
Superannuation actuarial gains/(losses)
2,294
(32,571)
2,375
(29,323)
Other losses
(89)
(89)
Total Other Comprehensive
Income/(E
xpense)
2,205
(32,571)
2,286
(29,323)
Total Comprehensive Income
91,385
79,020
87,609
65,590
The decrease in other losses is due to a revaluation decrement in ADHC’s land and buildings
of $55.2 million ($57.0 million in 2009–10), offset by a revaluation increment of $45.8 million
for Juvenile Justice’s land and buildings.
Based on actuarial assessment, the Department has reported a $2.3 million gain in the
defined benefit superannuation scheme compared to a $32.6 million loss in 2009–10.
Abridged Consolidated Statement of Financial Position
Year ended 30 June
Consolidated Parent
2011
$’000
2010
$’000
2011
$’000
2010
$’000
Current assets
409,876
368,989
344,371
305,546
Non-current assets
824,847
1,099,943
795,284
1,072,579
Total Assets
1,234,723
1,468,932
1,139,655
1,378,125
Current liabilities
333,854
349,707
298,688
315,803
Non-current liabilities
62,860
61,425
51,697
49,485
Total Liabilities
396,714
411,132
350,385
365,288
Net Assets
838,009
1,057,800
789,270
1,012,837
The increase in current assets was mainly due to the rise in cash and cash equivalents. This
was due predominately to the receipt of an insurance hindsight adjustment of $36.6 million
received in 2010–11.
The significant decrease in non-current assets was primarily due to the transfer of Juvenile
Justice Division’s property, plant and equipment with a value of $288 million.
This is trial version
www.adultpdf.com
78
NSW Auditor
-
General's Report
Volume Nine 2011
DEPARTMENT OF
FAMILY
AND COMMUNITY SERVICES
Abridged Service Group Information
The Department’s consolidated net cost of services by service group is detailed below.
Year ended 30 June
Net Cost of Services Net Assets
2011
Budget**
$’000
2011
Actual
$’000
2010
Actual
$’000
2011
Actual
$’000
2010
Actual
$’000
ADHC
Supported accommodation
1,079,159
1,045,407
1,054,863
560,084
554,810
Ongoing community support
1,012,006
969,483
858,261
102,276
148,567
Short-term interventions
329,565
387,330
296,540
91,489
25,993
Community Services
Out-of-home care
678,044
700,032
641,362
(3,792)
2,533
Statutory child protection
405,395
386,488
401,202
9,588
22,441
Other
575,605
523,697
504,981
30,867
34,764
Juvenile Justice
*****
134,125
173,406
*****
244,137
Home Care Services of New South
Wales
****
(3,880)
(20,294)
40,601
36,726
Other*
***
12,435
74,221
6,896
(12,171)
Total All Service Groups
4,079,774
4,155,117
3,984,542
838,009
1,057,800
* Include the following divisions: John William Memorial Charitable Trust, Aboriginal Affairs (from July 2010 to
March 2011), Office of Women (from April to June 2011) and the group of staff for Aboriginal Housing Office,
Housing NSW and NSWbusinesslink.
** Per the New South Wales 2009–10 Budget Papers.
*** Budget paper not prepared for all components of the Department.
**** Home Care Services of NSW is a statutory body and does not prepare financial statements comparing results to
budget.
***** Juvenile Justice was transferred out of the Department on 1 April 2011.
Department Activities
The Department provides human and social services directly and in partnership with
non-government organisations in order to improve the outcomes for vulnerable client groups
in New South Wales. The Department also provides employee related support services to a
number of other government agencies including the Aboriginal Housing Office, NSW
Businesslink Pty Ltd, and the NSW Land and Housing Corporation.
The Department’s responsibilities and services include :
x providing the best possible outcomes for older people, people with a disability and their
families and carers including early intervention, therapy, respite, supported
accommodation, case management and post school options enhancing child safety,
permanency and wellbeing
x providing accommodation and housing assistance to eligible households
x dealing with young offenders who have committed, or are alleged to have committed,
offences and are between the ages 10 and 18
x promoting outcomes for women by developing policy and working with other agencies and
non-government organisations
x promoting positive ageing and a culture that supports older people
x providing crisis support
x providing social housing and supporting Aboriginal communities.
For further information on the Department, refer to www.facs.nsw.gov.au.
This is trial version
www.adultpdf.com
79
NSW Auditor
-
General's Report
Volume Nine 2011
DEPARTMENT OF
FAMILY
AND COMMUNITY SERVICES
Controlled Entities
Home Care Service of New South Wales
Separate comment on Home Care Service of New South Wales and its controlled entity Home
Care Service Division are included elsewhere in this report.
The following controlled entity has not been reported on separately as it is not considered
material by its size or the nature of its operations to the consolidated entity.
Entity Name
Website
John Williams Memorial Charitable Trust
*
* This entity does not have a website.
This is trial version
www.adultpdf.com
80
NSW Auditor
-
General's Report
Volume Nine 2011
HOME CARE
SERVICE OF
NEW SOUTH WALES
Audit Opinion
The audits of Home Care Service of New South Wales (Home Care) and its controlled entity’s
financial statements for the year ended 30 June 2011 resulted in unmodified audit opinions
within the Independent Auditor’s Reports.
Unless otherwise stated, the following commentary relates to the consolidated entity.
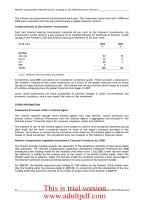
Operational Snapshot
Home Care is a statutory authority and a controlled entity of the Department of Family and
Community Services. It provides housekeeping, personal care and a range of ancillary
services for individuals and families within their own homes. These services cost $224 million
in 2010–11 ($214 million in 2009–10) and were funded by grants and contributions of
$190 million ($185 million) and other sources of revenue including fees for services provided.
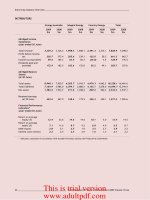
Performance Information
Home Care met most of its performance targets in 2010–11, as detailed in the table below.
Year ended 30 June
Target
Actual
2011
2011
2010
2009
2008
2007
Total number of
assessments*
15,000
15,175
12,987
15,703
20,760
17,693
Total hours of service
provided (’000s)
3,895
3,910
3,853
4,048
3,903
3,872
Total number of clients
serviced (’000s)
52
52
52
50
55
54
Average hours per client per
annum
75
75
74
81
71
71
Direct average staffing (FTE)
3,000
2,968
2,939
3,038
2,972
2,937
Source: Home Care (unaudited).
* An assessment involves ascertaining a client’s eligibility based on: program guidelines, the client’s support
needs, and developing a care plan.
In 2010–11, actual assessments undertaken by Home Care increased by 16.8 per cent
compared to 2009–10. Home Care advises that the variation in the number of assessments
each year is driven by a range of factors including changes in number of service hours
delivered, the number of clients exiting service and changes in client’s conditions which
require reassessment of their service needs.
Home Care also advises the increase in hours of service provided in 2010–11 was due to a
correction of the under-delivery of hours in 2009–10 and the result of efficiency gains.
Other Information
Human Resources
Home Care does not have any employees. It receives personnel services from its controlled
entity, the Home Care Service Division, but managing the staff is the responsibility of Home
Care.
This year, I reviewed the actions taken by Home Care to address recommendations I made
last year relating to human resource issues.
Home Care Service of New South
Wales
This is trial version
www.adultpdf.com
81
NSW Auditor
-
General's Report
Volume Nine 2011
HOME CARE
SERVICE OF
NEW SOUTH WALES
Flex Time Balances
Last year, I reported Home Care did not know the extent of flex time being accrued and
forfeited by employees, as it did not record this information centrally. Records were
decentralised and manually maintained by each business unit. I recommended Home Care
develop mechanisms to centrally review flex time records to ensure excessive flex time was
not being accrued and forfeited by employees.
Home Care advises that 88.1 per cent of staff are rostered staff who do not receive flex time.
This significantly lowers the risk of excessive flex time being accrued and forfeited. Flex leave
accrual and forfeiture for eligible staff is managed in accordance with the Crown Employees
(Home Care Service of NSW – Administrative Staff) Award.
Ageing of Staff
Last year, I recommended Home Care develop and implement effective policies to address
and manage its ageing workforce.
Home Care advises that an analysis of age and other staff demographic data is provided to
senior managers annually. Management is developing a Mature Workforce Strategy to
address risks associated with a mature workforce, such as succession planning, staff
development and occupational health and safety.
Excessive Annual Leave Balances
Managing excessive annual leave balances remains a challenge for Home Care. At
30 June 2011, 123 staff (81 staff at 30 June 2010) or 4.1 per cent (2.1 per cent) of all staff had
annual leave balances in excess of 40 days.
Home Care advises measures are now in place to improve management of excess annual
leave including:
x monthly reporting to business areas
x regular monitoring and reporting of data on excess leave to the executive
x automated reminders to all staff with high leave balances
x automated reminders advising appropriate managers of the need to develop leave plans
and obtain staff acknowledgement.
Excess leave balances can adversely affect an organisation. The associated financial liability
generally increases over time as salaries increase and staff may be adversely affected
through possible workplace health and safety issues.
Vacant Permanent Staff FTE Positions
Year
ended 30 June Shift Workers Administration Staff
2011 2010 2011 2010
Average number of vacant FTE positions
242
329
56
61
Average number of available FTE positions
2,389
2,359
594
598
Source: Home Care (unaudited).
Improvements have been made in filling vacant shift workers positions in 2010-11. For shift
workers, 10.2 per cent (13.9 per cent) of available FTE positions were vacant, and for
administrative staff, 9.4 per cent (10.2 per cent) were vacant.
This is trial version
www.adultpdf.com
82
NSW Auditor
-
General's Report
Volume Nine 2011
HOME CARE
SERVICE OF
NEW SOUTH WALES
Financial Information
Abridged Statements of Comprehensive Income
Year ended 30 June
Consolidated Parent
2011
$’000
2010
$’000
2011
$’000
2010
$’000
Government grants and contributions
189,825
185,124
189,825
185,124
Other revenue
37,324
48,113
34,165
33,299
Operating Revenue
227,149
233,237
223,990
218,423
Employee related
165,760
158,675
Personnel services
162,733
147,223
Other expenses
57,891
54,972
57,891
54,972
Operating Expenses
223,651
213,647
220,624
202,195
Other gains
381
704
432
818
Surplus
3,879
20,294
3,798
17,046
Other Comprehensive Income
Superannuation actuarial losses
(81)
(3,248)
Increase in revaluation reserve
77
77
Total Other Comprehensive
Income/(Expense)
(4)
(3,248)
77
Total Comprehensive Income
3,875
17,046
3,875
17,046
The decrease in other revenue was due to a reduced workers’ compensation insurance
hindsight premium adjustment of $11.6 million. In 2009–10, the adjustment was $14.8 million
and $3.2 million in 2010–11.
Due to market improvements, Home Care reported a $0.08 million loss in the defined benefit
superannuation scheme in 2010–11, compared to a $3.2 million loss in 2009–10.
Abridged Statements of Financial Position
At 30 June
Consolidated Parent
2011
$’000
2010
$’000
2011
$’000
2010
$’000
Current assets
62,440
60,868
61,990
60,470
Non-current assets
24,420
22,061
24,420
22,061
Total Assets
86,860
82,929
86,410
82,531
Current liabilities
35,096
34,261
34,646
33,863
Non-current liabilities
11,163
11,942
11,163
11,942
Total Liabilities
46,259
46,203
45,809
45,805
Net Assets
40,601
36,726
40,601
36,726
Total assets increased primarily due to an increase in investments and additions to plant and
equipment.
This is trial version
www.adultpdf.com
83
NSW Auditor
-
General's Report
Volume Nine 2011
HOME CARE
SERVICE OF
NEW SOUTH WALES
Home Care Activities
The Home Care Service Act 1988 established Home Care as a Statutory Authority. Home
Care provides housekeeping, personal care and a range of ancillary services for individuals
and families within their own homes. Its operations are conducted through state wide
branches and service outlets.
For further information on Home Care, refer to www.facs.nsw.gov.au
.
Controlled Entity
The following controlled entity has not been reported on separately as it is not considered
material by its size or the nature of its operations to the consolidated entity.
Entity Name
Home Care Service
Division
*
* This entity does not have a website.
This is trial version
www.adultpdf.com
84
NSW Auditor
-
General's Report
Volume Nine 2011
NSW BUSINESSLINK
PTY LTD
Audit Opinion
The audit of NSW Businesslink Pty Ltd’s (the Company) financial statements for the year
ended 30 June 2011 resulted in an unmodified audit opinion within the Independent Auditor’s
Report.
Operational Snapshot
The Company received fees of $193 million in 2010–11 for providing shared corporate
services to the Department of Family and Community Services and other agencies and made
a surplus of $19.4 million.
Other Information
Repeat Management Letter Issues
Last year, I recommended management address, as a priority, the verification of financial
delegations.
In response, the Company advises it has implemented a checking process, which it has
incorporated into its annual training program to ensure all staff are aware of their
responsibilities.
Human Resources
The Company does not have any employees. It receives personnel services from
NSW businesslink, a division within the Department of Family and Community Services.
Management of NSW businesslink staff is, however, the responsibility of the Company. This
year I reviewed actions taken by the Company to address recommendations I made last year
relating to human resource issues.
Employment of Contract Employees
Last year, I recommended the Company periodically review the roles and responsibilities of all
contract employees to ensure: reliance on contractors is not excessive; use of contract
employees instead of permanent employees is appropriate; contractors do not become de
facto employees by virtue of being with the Company for an extended period of time; use of
contract employees continues to represent value for money; and it does not contravene
established policies, tax legislation and industrial relation matters relating to employment
arrangements.
In response, the Company advises that:
x many projects are temporary in nature typically requiring short-term contractors to
undertake the work. As soon as projects are finished the contractors are released. This
reduces ongoing costs to both the Company and its clients as it avoids the need of having
full-time employees
x over the last 12 months the number of high cost contractors has fallen
x objectives have been set around reducing the duration of contractor engagements
x active monitoring of contractors, review of the optimum permanent workforce levels and
other initiatives have seen the number of contractors fall by 103 since 30 June 2008.
At 30 June 2011, the Company engaged 242 (262 at 30 June 2010) contractors. Twenty-nine
(34) have been engaged for more than five years and another 59 (53) have been engaged for
more than three years.
Flex Time Balances
Last year, I reported the Company did not know the extent of flex time being accrued and
forfeited by staff, as it did not monitor, at the Company level, the effectiveness of local
management of flex time. I recommended the Company develop mechanisms to centrally
review flex time records to ensure excessive flex time was not being accrued and forfeited by
staff.
NSW Businesslink Pty Ltd
This is trial version
www.adultpdf.com
85
NSW Auditor
-
General's Report
Volume Nine 2011
NSW BUSINESSLINK
PTY LTD
In response the Company advises that:
x a census conducted of the flex time records of all staff on flexible working hours shows
flex time hours are being forfeited. Strategies and processes have been developed to
reduce the incidence of forfeited hours
x as part of the Flexible Working Hours Agreement, managers are required to review
accumulated flex time hours and discuss strategies to ensure hours are not forfeited with
employees
x a project is being planned to allow managers to view employee flex sheets at any time.
Currently, they are only reviewed when submitted to managers at the end of each four
weekly period
x the feasibility of having electronic flex sheets within the human resources system is being
considered to provide system generated reports showing forfeited hours.
Ageing of Staff
Thirty five per cent of the Company’s employees are over 50 years of age and 18.7 per cent
are over 55.
Last year, I recommended the Company implement effective policies to address and manage
its ageing workforce. In response, the Company advises it has:
x programs to develop new staff, including graduate and cadet/traineeship programs
x implemented a mentoring program to develop staff and transfer skills from more mature
staff to newer employees
x adopted flexible work practices to help retain mature age employees and allow more time
for skills transfer
x developed processes to mitigate the risk of the loss of staff with critical expertise.
Financial Information
Abridged Statement of Comprehensive Income
Year ended 30 June
2011
$’000
2010
$’000
Fees for services
193,199
188,574
Other
13,068
1,103
Total Revenue
206,267
189,677
Personnel services
64,297
61,133
Contractors
63,190
65,679
Information technology
19,787
26,487
Depreciation and amortisation
16,600
15,244
Telecommunication
11,104
11,144
Other expenses
11,934
11,652
Total Expenditure
186,912
191,339
Surplus/(Deficit)
19,355
(1,662)
Other Comprehensive Income
Total Other Comprehensive Income
Total Comprehensive Income/(Expense)
19,355
(1,662)
The increase in other revenue was mainly due to a capital grant of $11.4 million for various
projects the Company was managing on behalf of one of its clients.
Information technology expenditure reduced primarily due to a fall in software licence
expenses of $6.8 million.
This is trial version
www.adultpdf.com
86
NSW Auditor
-
General's Report
Volume Nine 2011
NSW BUSINESSLINK
PTY LTD
Abridged Statement of Financial Position
At 30 June
2011
$’000
2010
$’000
Current assets
45,349
36,785
Non-current assets
68,756
50,495
Total Assets
114,105
87,280
Current liabilities
93,046
85,664
Non-current liabilities
718
630
Total Liabilities
93,764
86,294
Net Assets
20,341
986
Current assets increased largely due to an increase in cash holdings of $9.5 million.
The increase in non-current assets was due primarily to computer equipment purchases of
$8.4 million, and computer software of $7.9 million.
Current liabilities include trade and other payables of $80.3 million ($72.8 million). The
increase was attributable to a rise in accruals of $4 1 million, unearned project income of
$3.4 million and an increase in payables to NSW businesslink of $4.8 million.
Company Activities
NSW Businesslink Pty Ltd is a State Government owned company established under the
Corporations Act 2001. It is the shared corporate service provider for administrative services,
such as human resources, property and records management, information technology
services and other financial services for the Department of Family and Community Services
and other agencies. It supports these agencies in their service delivery by providing better and
more efficient services through economies of scale, productivity gains and process
improvements.
NSW Businesslink Pty Ltd shareholders are the Treasurer, the Minister for Family and
Community Services, the Minister for Ageing and Disability Services and the Minister for
Finance and Services.
For more information on NSW Businesslink Pty Ltd, refer to www.businesslink.nsw.gov.au.
This is trial version
www.adultpdf.com