A review of the chemical and physical mechanisms of the storage stability of fast pyrolysis bio oils
Bạn đang xem bản rút gọn của tài liệu. Xem và tải ngay bản đầy đủ của tài liệu tại đây (814.77 KB, 59 trang )
January 2000 • NREL/SR-570-27613
J.P. Diebold
Thermalchemie, Inc.
Lakewood, Colorado
A Review of the Chemical and
Physical Mechanisms of the
Storage Stability of Fast
Pyrolysis Bio-Oils
National Renewable Energy Laboratory
1617 Cole Boulevard
Golden, Colorado 80401-3393
NREL is a U.S. Department of Energy Laboratory
Operated by Midwest Research Institute •
••
• Battelle •
••
• Bechtel
Contract No. DE-AC36-99-GO10337
January 2000 • NREL/SR-570-27613
A Review of the Chemical and
Physical Mechanisms of the
Storage Stability of Fast
Pyrolysis Bio-Oils
J.P. Diebold
Thermalchemie, Inc.
Lakewood, Colorado
NREL Technical Monitor: Stefan Czernik
Prepared under Purchase Order Number 165134
National Renewable Energy Laboratory
1617 Cole Boulevard
Golden, Colorado 80401-3393
NREL is a U.S. Department of Energy Laboratory
Operated by Midwest Research Institute •
••
• Battelle •
••
• Bechtel
Contract No. DE-AC36-99-GO10337
NOTICE
This report was prepared as an account of work sponsored by an agency of the United States
government. Neither the United States government nor any agency thereof, nor any of their employees,
makes any warranty, express or implied, or assumes any legal liability or responsibility for the accuracy,
completeness, or usefulness of any information, apparatus, product, or process disclosed, or represents
that its use would not infringe privately owned rights. Reference herein to any specific commercial
product, process, or service by trade name, trademark, manufacturer, or otherwise does not necessarily
constitute or imply its endorsement, recommendation, or favoring by the United States government or any
agency thereof. The views and opinions of authors expressed herein do not necessarily state or reflect
those of the United States government or any agency thereof.
Available electronically at />Available for a processing fee to U.S. Department of Energy
and its contractors, in paper, from:
U.S. Department of Energy
Office of Scientific and Technical Information
P.O. Box 62
Oak Ridge, TN 37831-0062
phone: 865.576.8401
fax: 865.576.5728
email:
Available for sale to the public, in paper, from:
U.S. Department of Commerce
National Technical Information Service
5285 Port Royal Road
Springfield, VA 22161
phone: 800.553.6847
fax: 703.605.6900
email:
online ordering: />Printed on paper containing at least 50% wastepaper, including 20% postconsumer waste
ii
PREFACE
This literature review was suggested by the Pyrolysis Network (PyNe) and the National Renewable
Energy Laboratory (NREL), as a necessary means to collect and compare the known chemistry and
physical mechanisms of the storage instability of bio-oils. Because of the chemical similarities between
bio-oils derived by fast pyrolysis with wood distillates and liquid smoke used for flavors, the author
expanded the review to include these pyrolysis-derived condensates.
ACKNOWLEDGMENTS
The financial support to perform this review was provided equally by PyNe (managed by Prof. A.V.
Bridgwater, Director of the Energy Research Group, Department of Chemical Engineering and Applied
Chemistry, Aston University, Birmingham, UK) and by the Biomass Power Program (managed by Mr.
Kevin Craig) at NREL, Golden, CO of the U.S. Department of Energy with purchase order 165134 of
June 3, 1999. This support is gratefully acknowledged.
The encouragement of Dr. Stefan Czernik of NREL, Mr. Jan Piskorz of Resource Transforms
International, Dr. Dietrich Meier of the Institute of Wood Chemistry, and Ms. Anja Oasmaa of the
Technical Research Centre (VTT) of Finland is also gratefully acknowledged.
iii
Contents
Page
Preface ii
Acknowledgments ii
Abstract 1
1.0 Introduction 1
1.1 Storage Stability Problem 1
1.2 Combustion Problems Caused by Aging or Excessive Heat 5
2.0 Composition of Bio-Oils 5
2.1 Organics in Bio-Oil 6
2.2 Inorganics in Bio-Oil 6
3.0 Probable Chemical Mechanisms of Storage Instability 11
3.1 Reactions of Organic Acids 12
3.1.1 Esterification 12
3.1.2 Transesterification 15
3.2 Reactions of Aldehydes 15
3.2.1 Homopolymerization 15
3.2.2 Hydration 16
3.2.3 Hemiacetal Formation 16
3.2.4 Acetalization 17
3.2.5 Transacetalization 20
3.2.6 Phenol/Aldehyde Reactions and Resin 20
3.2.7 Polymerization of Furan Derivatives 21
3.2.8 Dimerization of Organic Nitrogen Compounds 21
3.3 Sulfur-Containing Compounds 22
3.4 Unsaturated Organic Reactions 22
3.4.1 Alcohol Addition 22
3.4.2 Olefinic Condensatio 22
3.5 Oxidation 22
3.6 Gas-Forming Reactions 23
3.6.1 Carbon Dioxide 23
3.6.2 Hydrogen 24
3.7 Insights to Be Gained from the Chemical Mechanisms of Aging 24
4.0 Observed Chemical Reactions in Wood Distillates, Wood Smoke, and
Bio-Oils 26
4.1 Wood Distillates 26
4.2 Wood Smoke 27
4.3 Bio-Oils 27
4.3.1 Aging 27
4.3.2 Esterification and Acetalization 28
4.3.3 Hydrogenation 29
4.3.4 Polymerization with Formaldehyde 30
4.3.5 Air Oxidation 30
iv
4.3.6 Effect of Entrained Char 30
4.3.7 Off-Gassing during Storage 31
5.0 Methods to Slow Aging in Bio-Oils 32
5.1 Solvent Addition to Reduce Viscosity and Aging Rates 32
5.2 Mild Hydrogenation 34
5.3 Limiting Access to Air and Antioxidants 35
6.0 Physical Mechanisms of Phase Instability 35
6.1 Co-Solvency of Bio-Oil Components 35
6.2 Changes in Mutual Solubility with Aging 38
6.3 Micelles, Suspensions, and Emulsions 38
6.4 Off-Gassing during Aging 39
7.0 Comparisons of the Storage Instability Mechanisms of Bio-Oils and
Petroleum Oils 40
8.0 Summary 41
9.0 Conclusions and Recommendations 42
10.0 References 43
Figures
Figure 1. Aging of Bio-Oils at 35ºC to 37ºC 2
Figure 2. Effect of Measurement Temperature on Apparent Aging
of Poplar Hot-Gas Filtered Bio-Oil 2
Figure 3. Rate of Viscosity Increase with Temperature during Storage of Bio-Oils 4
Figure 4. Viscosity and Molecular Weight after Aging of a Bio-Oil Made from Oak 4
Figure 5. Hydrolysis Rate of Ethyl Acetate and pH 14
Figure 6. Calculated Equilibrium Composition of Pseudo Bio-Oil with Water
Content at Start of Storage 25
Figure 7. Calculated Equilibrium Composition of Pseudo Bio-Oil with Added
Methanol 26
Figure 8. Noncatalytic Esterification in Whole Smoke Condensate at 25ºC 28
Tables
Table 1. Compounds Identified in Bio-Oils and Similar Pyrolysis Products 7-8
Table 2. Inorganic Compositions of the Chars and Bio-Oils Made from Various
Biomass Feeds at NREL with Char Removal by Cyclones or Filtration 10
Table 3. Normal Boiling Points of Probable Alcohols, Acids, and Esters
in Bio-Oils, Liquid Phase, and Vapor Phase Equilibrium Constants
for Ester Formation from Alcohol and Organic Acids at 25ºC 13
Table 4. Equilibrium Constants for Liquid Acetal Formation (at 25ºC) and Normal
Boiling Point of Resulting Acetals 19
v
Table 5. Effect of Adding Solvents on Aging Rates 33
Table 6. Hansen Solubility Parameters for Solvents in Bio-Oil of Potential
Interest to Bio-Oil Producers 37
Table 7. Hansen Solubility Parameters for Polymers Possibly Relevant
to Bio-Oils 38
1
A REVIEW OF
THE CHEMICAL AND PHYSICAL MECHANISMS
OF THE
STORAGE STABILITY OF FAST PYROLYSIS BIO-OILS
ABSTRACT
Understanding the fundamental chemical and physical aging mechanisms is necessary to learn how to
produce a bio-oil that is more stable during shipping and storage. This review provides a basis for this
understanding and identifies possible future research paths to produce bio-oils with better storage
stability. Included are 108 references.
The literature contains insights into the chemical and physical mechanisms that affect the relative storage
stability of bio-oil. Many chemical reactions that are normally thought to require catalysis, proceed quite
nicely without them (or with catalysts indigenous to the bio-oil) during the long reaction times available
in storage. The literature was searched for information about the equilibrium constants and reaction rates
of selected aging mechanisms, to determine whether they apply to storage times. The chemical reactions
reported to occur in pyrolytic liquids made from biomass are presented. As the bio-oil composition
changes during aging, the mutual solubility of the components changes to make phase separation more
likely. With these insights into the aging mechanisms, the use of additives to improve storage stability is
examined. Comparisons are then made to the storage stability of petroleum fuels. The review is
summarized, conclusions are drawn, and recommendations are made for future research to improve the
storage stability of bio-oils.
1.0 INTRODUCTION
1.1 Storage Stability Problem
Pyrolysis of biomass under conditions of rapid heating and short reactor residence times can produce a
low-viscosity, single-phase pyrolysis liquid (bio-oil) in yields reportedly higher than 70%. Most projected
uses of bio-oil require that it retain these initial physical properties during storage, shipment, and use.
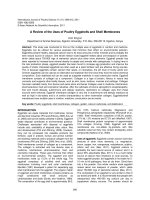
Unfortunately, some bio-oils rapidly become more viscous during storage. Figure 1 shows this increase
for three bio-oils made from three hardwoods using different pyrolysis conditions, after aging 3 months at
35ºC to 37ºC. These three bio-oils exhibit very different initial viscosities and rates of viscosity increase.
Figure 2 shows the effect of temperature on viscosity for three samples of a bio-oil made from poplar that
had been aged at 90ºC for 0, 8, and 20.5 hours. Aging effectively shifts the viscosity curve to the right on
the temperature axis, resulting in higher viscosities. The effect of aging on viscosity is greater at lower
measurement temperatures (Diebold and Czernik 1997). In this example, the change in viscosity appears
to be about twice as high, if measured at 40ºC rather than 50ºC. At the higher measurement temperature
of 70ºC, the effects of aging amount to an increase of only a few centipoise (mPas). The measurement
temperature is usually chosen to compare to petroleum fuel oil specifications (e.g., 40ºC in the United
States, 40ºC and 50ºC have been used in Finland).
2
Figure 1. Aging of Bio-Oils at 35°C to 37°C (cP = mPas)
0
50
100
150
200
250
300
0 20406080100
Time
,
da
y
s
Viscosit
y,
cP
Czernik et al. (1994) meas. @ 40°C
Oasmaa and Sipilä (1996) meas. @ 50°C
Diebold and Czernik (1997) meas. @ 40°C
Figure 2. Effect of Measurement Temperature on Apparent Aging of Poplar
Hot-Gas Filtered Bio-Oil (Diebold and Czernik 1997)
0
50
100
150
200
250
300
350
20 30 40 50 60 70
Temperature of Viscosity Measurement, °C
Viscosity, cP
20.5 h at 90°C
8 h at 90°C
0 h at 90°C
3
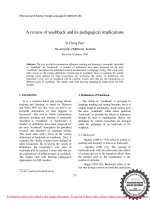
The aging effects occur much faster at higher temperatures. Figure 3 shows that the viscosity increase rate
of the hardwood bio-oils (shown in Figure 1) and for a softwood bio-oil varied more than four orders of
magnitude, from 0.009 cP/day at –20ºC to more than 300 cP/day at 90ºC. This is approximately a
doubling of the viscosity increase rate for each 7.3ºC increase in storage temperature. The aging rate of
softwood bio-oil is about the same as for hardwood bio-oils at 20ºC, with some possible differences at
lower storage temperatures. However, the viscosity change during aging is very small (below 20ºC),
making low-temperature aging rates subject to measurement errors.
Because the viscosity change rates may be represented as Arrhenius exponential functions of the inverse
of absolute temperature, chemical reactions appear to be involved. Figure 3 shows that the bio-oils must
be cooled quickly after being produced and then stored at low temperatures to maintain their low
viscosity. The pyrolysis oils referred to in Figure 3 initially contained 10 to 21 wt % water.
A loss of volatiles will increase the viscosity of bio-oil, so the bio-oils shown in Figures 1-4 were
carefully aged in sealed containers to prevent such losses. Using gel permeation chromatography with
ultraviolet detection of the aromatic compounds, the weight-average molecular weights of the aromatic
compounds in aged bio-oils made from oak were determined (Czernik et al. 1994). Figure 4 shows that
molecular weight correlated very well with viscosity during aging, in this case with a linear-regression R
2
value of 0.96, for all aging data at 37ºC, 60ºC, and 90ºC treated as one data set. (The regression R
2
values
are slightly improved if the data set is divided into three sets, one for each aging temperature.)
Figure 4 strongly implies that if a pyrolysis process more thoroughly cracks the bio-oil to lower molecular
weights, the initial viscosity is desirably lower. Thus, partially pyrolyzed particles and droplets must not
be entrained prematurely from the reactor system, because if they are soluble in the bio-oil, they will
cause the molecular weight and viscosity to increase.
During aging, chemical reactions, which apparently increase the average molecular weight, take place in
bio-oil. Based on the good correlation for the aging data treated as one data set, relatively similar
chemical reactions appear to occur over this temperature range. This is the basis for conducting
accelerated aging research at elevated temperatures and then applying the results to predict storage of bio-
oils at lower temperatures. The advantage of accelerated aging tests is the short time required to
demonstrate the aging properties of a particular bio-oil.
Bio-oil is not a product of thermodynamic equilibrium during pyrolysis, but is produced with short
reactor times and rapid cooling or quenching from the pyrolysis temperatures. This produces a condensate
that is also not at thermodynamic equilibrium at storage temperatures. Bio-oil contains a large number of
oxygenated organic compounds with a wide range of molecular weights, typically in small percentages.
During storage, the chemical composition of the bio-oil changes toward thermodynamic equilibrium
under storage conditions, resulting in changes in the viscosity, molecular weight, and co-solubility of its
many compounds.
In addition to simple viscosity increases, the single-phase bio-oil can separate into various tarry, sludgy,
waxy, and thin aqueous phases during aging. Tarry sludges and waxes still in suspension have caused
rapid plugging of fuel filters. They can form during storage in previously filtered bio-oils and in aqueous
phases. Bio-oils seem to be more unstable during storage than are petroleum-derived fuel oils, although
there appear to be many similarities in their mechanisms.
4
Figure 3. Rate of Viscosity Increase with Temperature
during Storage of Bio-Oils
Temp., °C
30
0
10204050
6070
80
90
-20
-10
0.001
0.01
0.1
1
10
100
1000
2.7 2.8 2.9 3 3.1 3.2 3.3 3.4 3.5 3.6 3.7 3.8 3.9 4
1000/Temperature, 1/K
Rate of Viscosity Increase, cP/day
Hardwood-Czernik et al. (1994)
Hardwood-Oasmaa and Sipilä (1996)
Hardwood-Diebold and Czernik (1997)
Softwood-Oasmaa et al. (1999)
Figure 4. Viscosity and Molecular Weight after Aging of a Bio-Oil Made
from Oak (data from Czernik et al. 1994)
(Molecular weight by GPC with UV detector)
m.w. = 1.7878µ + 278.29
(R
2
= 0.96)
0
100
200
300
400
500
600
700
800
900
1000
100 150 200 250 300 350 400
Viscosity Measured at 40°C, cP
Weight Ave. Mol. Weight, Da
37°C
60°C
90°C
5
1.2 Combustion Problems Caused By Aging or Excessive Heat
Common practice is to preheat fuel oils before combustion to lower their viscosity for better atomization.
With diesel engines, the fuel is pumped through a preheater to the injector, where only a small fraction of
the fuel is injected into the engine. The remainder of the hot fuel is normally recirculated back to the
pump. This was problematical with preheating bio-oils before they were injected into a diesel engine;
particulates grew from smaller than 10 µm to larger than 40 µm in this recirculation loop. Although filters
were used to remove these particulates from the recycled fuel, reliable operation was achieved only after
the recirculation loop was removed and the excess hot bio-oil was dumped to a waste container (Shihadeh
1998). This particle growth is thought to be due to polymerization reactions occurring in the heated bio-
oil, although physical agglomeration of micelles would also explain this phenomenon.
After preheating bio-oil to 90ºC before atomization into a furnace, the 0.8-mm diameter holes in the fuel
injector were plugged with deposits (Rossi 1994). Deposits were formed in the hot injectors, if they were
not rinsed out with alcohol before the furnace (Gust 1997a; Huffman and Freel 1997) or the diesel engine
(Casanova 1994) was shut down. Sludge deposits in the bottom of the fuel tank and in the fuel lines were
flushed out with methanol (Leech and Webster 1999). The need for this alcohol rinse was cited as an
impediment to the use of bio-oil in small combustion systems (Gust 1997a).
Although the solubility of bio-oil in diesel fuel is relatively slight, operating the combustion system for a
short time with diesel fuel after shutting off the bio-oil flow precluded the formation of tarry deposits in
the injector nozzles (Andrews et al. 1997), but was not always effective (Gust 1997b). Although these
deposits were often blamed on a loss of volatile components from the bio-oil during cooldown,
polymerization probably occurred as well.
2.0 COMPOSITION OF BIO-OILS
The composition of bio-oils results form a complex interrelationship of:
• The biomass species used as feedstock (organic and inorganic compositions, including dirt and
moisture).
• Organic nitrogen or protein content of the feedstock.
• The heat transfer rate and final char temperature during pyrolysis.
• The extent of vapor dilution in the reactor.
• The time and temperature history of the vapors in the reactor.
• The time and temperature history of the vapors in the heated transfer lines from the pyrolysis reactor
through the char removal equipment to the quench zone.
• Whether the vapors pass through accumulated char (i.e., in hot-gas char filtration between
backflushing operations).
• The efficiency of the char recovery system to separate the char from the bio-oil vapors before
condensation.
• The efficiency of the condensation equipment to recover the volatile components from the non-
condensable gas stream, e.g., water and low molecular weight esters, ethers, acetals, alcohols, and
aldehydes.
• Whether the condensates have been filtered to remove suspended char fines.
• The water content of the bio-oil.
• The extent of contamination of the bio-oil during storage by corrosion or leaching of the containers.
• Exposure to air during storage.
• The length of storage time.
• The storage temperature.
6
A thorough discussion of the effects of the reactor variables is outside the scope of this review. They have
already been treated in considerable detail (e.g., Diebold and Bridgwater 1997). The other variables are
discussed in this review.
2.1 Organics in Bio-Oil
Because fast pyrolysis involves only the partial decomposition of biomass, the chemical composition of
the resulting bio-oil is feedstock dependent. Biomass feedstocks rich in proteins would be expected to
have high organic nitrogen contents. For example, bark, alfalfa, or grass cut for hay would be expected to
produce bio-oils with higher nitrogen contents than would materials having low protein contents, e.g.,
straw or debarked wood. The presence of nitrogen compounds in bio-oils will adversely affect the
nitrogen oxide (NO
x
) content of the combustion products and the aging properties.
Other influences of the feedstock species are found in the lignin, from which the phenolics in bio-oils are
primarily derived. A wood distillate made from hardwoods contained 55% phenolics with methoxy
groups attached at the number 2 and 6 positions of the phenolic molecule, i.e., syringols, and only 16%
guaiacols with a methoxy at the number 2 position (Carraza et al. 1994). Lignins from softwood tend to
have one or no methoxy group attached to the number 2 position of the phenolic molecule (Lewis and
Lansky 1989). Bark tends to contain highly reactive tannins, as well as a high protein content.
As a consequence of the many variables in the pyrolysis of biomass and the storage of bio-oils, the
reported compositions of bio-oil vary considerably. More than 400 organic compounds are reportedly in
pyrolysis liquids or wood smoke. The wood smoke literature has a lot of detail on minor components that
can affect the perceived flavors (Maga 1987). The literature on the composition of fast pyrolysis oils was
summarized by Milne et al. (1997). Tables 1a and 1b summarize these compilations, which show the
similarities in the qualitative compositions of these pyrolysis-derived condensates (Diebold 1997). This
implies similar chemical reactions in wood distillates, wood smoke, and bio-oil.
Of particular interest is the wide range reported for the composition of each organic component of bio-oil.
For many compounds, this range exceeds a factor of 10:1. Bio-oil is apparently a poorly defined mixture
of acids, alcohols, aldehydes, esters, ketones, sugars, phenols, guaiacols, syringols, furans, and multi-
functional compounds, such as hydroxyacetic acid, hydroxyacetaldehyde, hyroxyacetone, and 3-hydroxy-
3-methoxy benzaldehyde. The organic acids cause bio-oil to be acidic, with a pH of about 2.3 to 3.0.
2.2 Inorganics in Bio-Oil
The inorganic or mineral content of biomass is found in many forms: in aqueous solution in association
with various counter ions; bound to organic acids; as deposits; or related to various enzymatic
compounds. The counter ions in solution include carbonates, oxalates, phosphates, silicates, chlorides,
and sulfates (French and Milne 1994). The char and inorganic contents of bio-oil are important to its
aging characteristics, as they appear to catalyze polymerization reactions during storage, leading to
viscosity increases and growth in the apparent diameter of the suspended char (Agblevor et al. 1994,
1995).
The following discussion shows that some of these minerals are potential catalysts for reactions that are
important in aging, e.g., chlorides of calcium, lithium, iron, magnesium, manganese, and zinc that
catalyze acetal-forming reactions.
7
Table 1a. Compounds Identified in Bio-Oils (Milne et al. 1997) and Similar Pyrolysis Products (Diebold 1997)
Wood Smoke Bio-Oils Wood Smoke Bio-Oils Wood Smoke Bio-Oils
Compound Distillate Flavors wt% Compound Distillate Flavors wt% Compound Distillate Flavors wt%
Acids Alcohols Aldehydes
Formic (methanoic) f,g,h,k,s,v GI,m,t 0.3-9.1 Methanol f,g,h,k,s,v m,t 0.4-2.4 Formaldehyde , ,h, , , m,t 0.1-3.3
Acetic (ethanoic) f,g,h,k,s,v GI,m,t 0.5-12 Ethanol ,g, , , ,v m,t 0.6-1.4 Acetaldehyde f,g,h,k,s,v GI,m,t 0.1-8.5
Propanoic f,g,h,k,s,v GI,m 0.1-1.8 2-Propene-1-ol f, ,h,k,s, m,t 2-Propenal (acrolein) m 0.6-0.9
Hydroxyacetic f, , , ,s,v M 0.1-0.9 Isobutanol f, ,h,k, ,v m 2-Butenal , , , , ,v m trace
2-Butenic(crotonic) f,g,h,k,s,v M 3-Methyl-1-butanol , , , ,s, 2-Methyl-2-butenal GI,m 0.1-0.5
Butanoic f,g,h,k,s,v T 0.1-0.5 Ethylene glycol m 0.7-2.0 Pentanal f, ,h, , ,v m 0.5
Pentanoic (valeric) f, ,h,k,s,v GI,m,t 0.1-0.8 Ethanedial 0.9-4.6
2-Me butenoic f, ,h,k,s M
Ketones
4-Oxypentanioc , , ,s,v GI,m 0.1-0.4 Acetone f, ,h,k,s,v m,t 2.8
Phenols
4-Hydroxypentanoic , , , , ,v 2-Butenone d Phenol f, ,h, ,s,v G,GI,m,t 0.1-3.8
Hexanoic (caproic) f, ,h, ,s, M 0.1-0.3 2-Butanone (MEK) f,g,h,k,s,v m 0.3-0.9 2-Methyl phenol f, ,h, ,s,v G,GI,m,t 0.1-0.6
Benzoic m,t 0.2-0.3 2,3 Butandione , , , , ,v 3-Methyl phenol f, ,h, ,s,v G,GI,m,t 0.1-0.4
Heptanoic M 0.3 Cyclo pentanone f, ,h, ,s,v m,t 4-Methyl phenol f, ,h, , ,v, G,GI,m,t 0.1-0.5
2-Pentanone f, , , , ,v m 2,3 Dimethyl phenol , , , ,s,v G,GI,m,t 0.1-0.5
Esters
3-Pentanone ,h, , , m 2,4 Dimethyl phenol f, ,h, ,s,v G,GI,m,t 0.1-0.3
Methyl formate f, ,h, ,s, m,t 0.1-0.9 2-Cyclopentenone , , , , ,v GI,m 2,5 Dimethyl phenol , , , ,s,v G,GI,m,t 0.2-0.4
Methyl acetate f, ,h,k,s,v m,t 2,3 Pentenedione , , , , ,v m,t 0.2-0.4 2,6 Dimethyl phenol , , , ,s,v G,GI,m,t 0.1-0.4
Methyl propionate f, ,h, , ,v M 3Me2cyclopenten2ol1one f, , , , , m 0.1-0.6 3,5 Dimethyl phenol f, ,h, ,s,v m,t
Butyrolactone ,g, , ,s,v m,t 0.1-0.9 Me-cyclopentanone f, ,h, ,s,v m 2-Ethylphenol f, , , , , G,GI,m,t 0.1-1.3
Methyl Crotonate M 2-Hexanone m 2,4,6 TriMe phenol m 0.3
Methyl n-butyrate f, ,h, , , m,t Cyclo hexanone m trace 1,2 DiOH benzene f, ,h,k,s,v G,GI,m,t 0.1-0.7
Valerolactone f, ,h,k,s,v 0.2 Methylcyclohexanone f, , , , 1,3 DiOH benzene m 0.1-0.3
Angelicalactone M 0.1-1.2 2-Et-cyclopentanone t 0.2 -0.3 1,4 DiOH benzene 0.1-1.9
Methyl valerate f, ,h, , GI,m,t Dimethylcyclopentanone m 0.3 4-Methoxy catechol G,GI,m,t 0.6
Trimethylcyclopentenone GI 0.1-0.5 1,2,3 Tri-OH-benzene , ,h, ,s, t 0.6
Trimethylcyclopentanone m 0.2-0.4
f Fraps (1901) d Doerr et al. (1966)
g Goos and Reiter (1946) G Guillén et al. (1995)
h Hawley (1923) GI Guillén and Ibaragoitia (1996)
k Klar (1925) m Maga (1987 and 1988)
s Stamm and Harris (1953) t Tóth and Potthast (1984)
v Vergnet and Villeneuve (1988)
8
Table 1b. Compounds Identified in Bio-Oils (Milne et al. 1997) and Similar Pyrolysis Products (Diebold 1997)
Wood Smoke Bio-Oils Wood Smoke Bio-Oils Wood Smoke Bio-Oils
Compound Distillate Flavors wt% Compound Distillate Flavors wt% Compound Distillate Flavors wt%
Guaiacols Furans Alkenes
2-Methoxy phenol f,g,h, ,s,v G,GI,m,t 0.1-1.1 Furan , , , , ,v M,t 0.1-0.3 2-Methyl propene
4-Methyl guaiacol , , , , ,v G,GI,m,t 0.1-1.9 2-Methyl furan f, ,h, , , , m.t 0.1-0.2 Dimethylcyclopentene 0.7
Ethyl guaiacol f,g,h, , ,v G,GI,m,t 0.1-0.6 2-Furanone GI 0.1-1.1 Alpha-pinene , , , ,s,
Eugenol , , , , ,v GI,m,t 0.1-2.3 Furfural f, ,h,k,s,v G,GI,m,t 0.1-1.1 Dipentene , , , ,s,
Isoeugenol GI,m,t 0.1-7.2 3-Methyl-2(3h)furanone G,GI 0.1
4-Propylguaiacol f, ,h, , ,v G,GI,m,t 0.1-0.4 Furfural alcohol , , , ,s,v GI,m,t 0.1-5.2
Aromatics
Acetoguiacone 0.8 Furoic acid , ,h,k,s, m 0.4 Benzene , , ,k, , ,v m
Propioguiacone 0.8 Methyl furoate ,g, , , ,v m,t Toluene f, ,h,k,s,v G,m
5-Methylfurfural f, ,h,k,s,v G,m,t 0.1-0.6 Xylenes f, ,h,k,s
Syringols
5-OH-methyl-2-furfural , , , , ,s, m 0.3-2.2 Naphthalene , , , ,s,v t
2,6-DiOMe phenol f,g,h, , ,v G,GI,m,t 0.7-4.8 Dimethyl furan f, ,h, , , , m Phenanthrene t
Methyl syringol f, ,h, , ,v G,GI,m,t 0.1-0.3 Fluoranthene t
4-Ethyl syringol , , , , ,v G,GI,m,t 0.2
Misc. Oxygenates
Chrysene , , ,k, , t
Propyl syringol f, ,h, , ,v G,GI,m,t 0.1-1.5 Hydroxyacetaldehyde m,t 0.9-13
Syringaldehyde , , , , ,v G,GI,m,t 0.1-1.5 Acetol (hydroxyacetone) , , , ,s,v m,t 0.7-7.4
Nitrogen Compounds
4-Propenylsyringol , , , , ,v G,GI,m.t 0.1-0.3 Methylal f, , ,k,s, m Ammonia , ,h,k,s,
4-OH-3,5-diOMe phenyl ethanone G, GI 0.1-0.3 Dimethyl acetal , ,h,k,s, m Methyl amine f, ,h,k,s, m
Acetal 0.1-0.2 Pyridine , ,h, ,s, m
Sugars
Acetyloxy-2-propanone m 0.8 Methyl pyridine , ,h, ,s,
Levoglucosan , , , ,s, 0.4-1.4 2-OH-3-Me-2-cyclopentene-1-
one
m 0.1-0.5
Glucose 0.4-1.3 Methyl cyclopentenolone m 0.1-1.9
Fructose 0.7-2.9 1-Acetyloxy-2-propanone G,GI 0.1
D-xylose 0.1-1.4 2-Methyl-3-hydroxy-2-pyrone 0.2-0.4
D-Arabinose 0.1 2-Methoxy-4-methylanisole 0.1-0.4
Cellobiosan 0.6-3.2 4-OH-3-methoxybenzaldehyde G,GI,m 0.1-1.1
1,6 Anhydroglucofuranose 3.1 Maltol ,g, , ,s, G,GI,m,t
f Fraps (1901) G Guillén et al. (1995)
g Goos and Reiter (1946) GI Guillén and Ibaragoitia (1996)
h Hawley (1923) m Maga (1987 and 1988)
k Klar (1925) t Tóth and Potthast (1984)
s Stamm and Harris (1953)
v Vergnet and Villeneuve (1988)
9
The inorganic content of biomass forms ash during combustion, which can have a negative
impact on its combustion applications (Miles et al. 1996), but this report is primarily concerned
with the inorganic constituents in bio-oil.
Fortunately, the minerals in biomass remain largely in the condensed phase during fast pyrolysis,
which concentrates the minerals in the char. During the production of bio-oil, char is entrained
with organic vapors and separated from the vapors using equipment with varying efficiencies.
Cyclonic separation is the easiest way to remove char, but even the best cyclones begin to lose
their efficiency with char particles smaller than about 10 µm in diameter. Hot-gas filtration
removes smaller char particles more efficiently, but a small amount of char fines passes through
these filters as well. Filtration after the bio-oil has condensed can also remove char fines, but
results in a high-ash sludge as a by-product and does not remove nano-sized char particles or
minerals already solubilized by the acidic solution of bio-oil.
Table 2 shows representative inorganic elemental analyses made of wood and grass, char filtered
from condensed bio-oil, and bio-oils made with char separated by cyclones or by hot-gas
filtration. A comparison of the inorganic content of the bio-oil and the char recovered by filtration
from the condensed bio-oil verifies that the inorganics were concentrated in the char. However,
filtering the bio-oil (after dilution with methanol through a 2.5-µm filter after condensation)
removed only 20% to 50% of the total inorganic content of the oil. This implies that the
remaining inorganic elements are in suspended char particles smaller than 2.5 µm in diameter, or
they are in solution. Adding water to separate the bio-oil into aqueous and tar phases resulted in a
disproportion of the inorganics, but not in a clean separation. In fact, the potassium content of the
aqueous phase was higher than for the tar phase (Elliott 1994).
Filtering liquid bio-oil derived from switchgrass through a series of five progressively finer filters
showed that most of the calcium and about half the potassium were present in suspended char or
sludge particles larger than 10 µm. However, the remaining potassium was not removed with 0.7-
µm filters (Agblevor et al. 1994). Similarly, the calcium level was reduced only from 540 ppm to
311 ppm using 0.1-µm filters to filter an oak bio-oil. The potassium level was reduced even less,
from 440 ppm to 402 ppm (Oasmaa et al. 1997). A significant amount of the inorganic material
was either associated with particles smaller than 0.1 µm, or was dissolved by the acidic bio-oil
and in solution.
Table 2 also shows the much lower inorganic content of bio-oil produced by filtering the hot
vapors before condensation, compared to removing char with cyclones. The best job of hot-gas
filtering to date at the National Renewable Energy Laboratory (NREL) resulted in less than
2 ppm alkali and 2 ppm alkaline earth metals (Scahill et al. 1997). To obtain very low levels of
inorganics, the char particles apparently must be removed before the pyrolysis vapors are
condensed.
At these low sodium levels, significant sodium contamination can be leached from common
laboratory glassware by the acidic bio-oil, as the sodium ion appears to be mobile in the sodium
borosilicate glass. The sodium content increased steadily from 8 ppm to 17 ppm as the bio-oil
from switchgrass was filtered through progressively finer filters; the potassium and calcium
contents decreased to constant values below 10 µm (Agblevor et al. 1994). This anomalous
increase in sodium content with increased processing could be explained by the leaching of
sodium from laboratory glassware. In addition, the alkali contamination from dust in
10
Table 2. Inorganic Compositions of the Chars and Bio-Oils Made from Various Biomass Feeds at NREL
with Char Removal by Cyclones or Filtration
Reference Elliott 1994 Agblevor et al. 1994 Diebold et al. 1996 Scahill et al. 1997
Feedstock Oak Southern Pine Switchgrass Hybrid Poplar
Material Bio-Oil +2-µm
Char in
Bio-Oil
Bio-Oil +2-µm
Char in
Bio-Oil
Feed +10-µm
Char in
Bio-Oil
Bio-Oil
-0.7µm
Feed Bio-Oil
(Run 175)
Bio-Oil
(Run M2-10)
Char Removal
Method
Cyclones Cyclones
+ Oil Filtr.
Cyclones Cyclones+
Oil Filtr.
Cyclones
+ Oil Filtr.
Cyclones
+ Oil Filtr.
Hot-Gas
Filter
Hot-Gas
Filter
Char, % 0.74 0.13
Ash, % 0.09 0.03 4.92 15.3 <0.05 0.77 0.01 0.007
Calcium, ppm 160 4580 160 8100 2400 7100 2.2 1550 2.2 1
Silicon 112 93 3452 1.4
Potassium 55 1300 10 667 8500 8500 175 1200 2.7 1
Iron 86 47 1772
Aluminum 55 41 2.6 0.3
Sodium 2 60 <0.1 372 31 690 17 27 7.2 0.9
Sulfur <60 <50 349
Phosphorus <50 <50 550 3600 0.6
Magnesium <55 <45 903 0.7
Nickel <22 <20 288
Chromium <17 <17 524
Zinc 28 14 258
Lithium 25 7 110
Titanium 17 5 130 <0.2
Manganese 15 6 353 0.063 0.04
Copper 39
Barium <3 <2 170
Vanadium 0.002 <0.01
Chlorine 6800 10600 1600 7.9 11
equiv. Cl per
equiv. K+Na+Ca
0.57 0.50 8.5 0.3 2
11
the air and residual alkali contents of purified water can be significant at these low levels. These
considerations require special reagents and handling of the samples in clean, inert containers.
Other inorganic contaminants in acidic bio-oil appear to be from processing or storage equipment
made of iron or galvanized steel, or from the attrition of heat-transfer sands. For example,
extraneous contamination levels of 2270 ppm iron, 1950 ppm zinc, and 80 ppm lead were
reported by Elliott (1986) to be in an early SERI (NREL) bio-oil, which had been produced using
a galvanized scrubbing tower for condensate recovery. (This scrubber was taken out of service
shortly after the analyses were made.) The silicon level in a bio-oil made in an entrained sand
reactor was 330 ppm (Oasmaa et al. 1997), compared to 112 ppm for a bio-oil made in an
entrained flow reactor without sand (Elliott 1994).
Very few analyses have been performed on pyrolysis bio-oil and char for chlorine. Table 2 shows
that the chlorine content of the hot-gas-filtered hardwood bio-oils varied considerably, from 0.3
to 2 equivalents of chlorine per equivalent of potassium, sodium, and calcium (Diebold et al.
1996; Scahill et al. 1997). The chlorine content of switchgrass oils did not change significantly
during filtration of the bio-oil and was in the range of 1200 ppm to 1600 ppm; the metal ion
content decreased (Agblevor et al. 1994). The equivalents of chlorine per equivalent of alkali or
alkaline earth metals increased from 3.4 to 8.5 during this filtration. This suggests that the
residual inorganics may be present as chlorides and that much of the chlorine may be in solution.
Chloride ions in solution will have an adverse effect on corrosion of many metals, including
stainless steels such as SS304.
Compared to coal and many crude oils, biomass has a low sulfur content. Table 2 reveals that the
small amount of sulfur in the biomass feed becomes concentrated in the char, rather than in the
bio-oil.
3.0 PROBABLE CHEMICAL MECHANISMS OF STORAGE INSTABILITY
A discussion of all possible reactions taking place in a mixture of as many as 400 organic
compounds is beyond the scope of any review. However, reviewing several of the generic
chemical reactions thought to play an important part in the aging reactions of bio-oil is
instructive. According to organic chemistry textbooks, many require catalysis, but during the long
times available in storage, additional catalysis may not be needed or the catalysts may already be
present in the bio-oil. Referring to the original literature is often necessary to find information on
reactions that take place too slowly to generate commercial interest. Industry already controls
some of these chemical reactions during the commercial shipping and storage of chemicals,
which could be relevant to the aging of bio-oil.
Most important reactions that occur within bio-oil probably involve:
• Organic acids with alcohols to form esters and water.
• Organic acids with olefins to form esters.
• Aldehydes and water to form hydrates.
• Aldehydes and alcohols to form hemiacetals, or acetals and water.
• Aldehydes to form oligomers and resins.
• Aldehydes and phenolics to form resins and water.
• Aldehydes and proteins to form oligomers.
• Organic sulfur to form oligomers.
• Unsaturated compounds to form polyolefins.
12
•
Air oxidation to form more acids and reactive peroxides that catalyze the polymerization of
unsaturated compounds.
Reactions 1 through 5 can form products in thermodynamic equilibrium with the reactants, which
means that a change in temperature or relative amounts of water and other reactive compounds
will upset the equilibrium and initiate compositional changes. Reactions 4 through 10 can form
resins or polyolefins and may be irreversible under likely bio-oil storage conditions.
3.1 Reactions of Organic Acids
3.1.1 Esterification
The reaction of alcohols with organic acids forms esters and water:
O O
ROH + R’C R’C + H
2
O
OH OR
where R and R’ are alkyl groups. Esters are well known for their aromas. In wines and liquors,
these reversible ester-forming reactions can take place over the course of several years. They are
catalyzed by acids, which are of interest in bio-oil with its naturally low pH of 2.3 to 3.0.
Table 3 shows the volatility expressed as the normal boiling point for esters and solvents likely to
be present in bio-oils. Esters are relatively volatile compounds. For comparison, the boiling point
of acetone at 56.5ºC lies between that of ethyl formate and methyl acetate. The boiling point of
methyl formate at 32ºC is similar to that of diethyl ether. The vapor pressure at 0ºC of methyl
formate is 27 kPa (200 mm Hg) and that of methyl acetate is 8.8 kPa (66 mm Hg). If methyl
formate were present in the pyrolysis products, its volatility would prevent it from being
recovered from the pyrolysis gases in most condensation trains.
The formation of esters from organic acids and alcohols is thermodynamically favored (i.e., an
equilibrium constant greater than 1). Table 3 also shows that the equilibrium constants reported
for the liquid phase vary from 4 to 5.2 for the lower molecular weight esters from primary
alcohols and about half that for those from secondary alcohols. The heat of esterification is
relatively low, so the equilibrium constants are nearly independent of temperature (Simons 1983).
With equal initial molar concentrations of the alcohol and the acid, an equilibrium constant of 2
corresponds to a conversion of 59 mol % of the reactants; an equilibrium constant of 4
corresponds to a conversion of 67 mol %.
The vapor-phase equilibrium constants are quite different from the liquid-phase equilibrium
constants. Using values for the standard free energy at 25ºC from the literature (DIPPR 1998) for
the reactants and the products in the gas phase for the esterification reactions, the free energy for
esterification in the gas phase was calculated. The thermodynamic equilibrium constants were
then calculated from:
ln K
e
= -∆F / RT
Values for these calculated vapor-phase equilibrium constants are given in Table 3. The
equilibrium constant of 367 for ethyl acetate in the vapor state corresponds to a conversion of
95% of the reactants. The calculated equilibrium constant for the formation of ethyl acetate from
ethanol and acetic acid in the vapor phase is nearly two orders of magnitude higher than for the
same reaction in the liquid phase.
13
Table 3. Normal Boiling Points of Probable Alcohols, Acids, and Esters in Bio-Oils, Liquid
Phase (Simons 1983), and Vapor Phase Equilibrium Constants for Ester Formation from
Alcohol and Organic Acids at 25ºC (calculated from Gibbs free energy in DIPPR 1998)
Thermodynamic Equilibrium Constant
Compound nbp, ºC Liquid Vapor
Methyl formate 32.0 60
Ethyl formate 54.3 174
Methyl acetate 57.8 5.2 243
Methanol 64.7
Ethyl acetate 77.1 4 367
Ethyl alcohol 78.4
Methyl propionate 79.8 68
Iso-propanol 82.5
Iso-propyl acetate 88.4 2.4 400
Propanol 97.8
Ethyl propionate 99.1 213
Formic acid 100.6
Propyl acetate 101.6 4.1 200
Acetic acid 118.1
Propyl propionate 122.5 31
Propionic acid 141.1
Esterification studies by Berthelot and Péan de Saint-Gilles during the 1800s used sealed tubes
with various relative vapor headspaces. They found that the equilibrium shifted to higher ester
yields with more headspace. During the 1920s, vapor-phase esterification reactions were re-
examined. Three equilibrium mixtures of acetic acid, ethanol, water, and ethyl acetate (in the
absence of known catalysts) were refluxed for about 1 hour. Reactions occurred during the vapor
phase at temperatures as low as 53ºC to form about the same vapor composition from the three
initially very different equilibrium compositions. The vapor composition shifted to more heavily
favor ester formation. Equilibrium constants higher than 400 were calculated, taking into account
the dimerization of acetic acid during the vapor phase (Edgar and Schuyler 1924).
The temperature and liquid residence time used by Edgar and Schuyler (1924) are commonly
encountered during the scrubbing of hot fast-pyrolysis vapors and gases downstream of the
pyrolysis reactor with recirculated condensates. Under these conditions, this suggests the
probable formation and subsequent loss of the volatile esters in the noncondensable gases. These
losses could cause problems with a lack of mass closure in fast pyrolysis systems using this type
of scrubbing, because the off-gases are not usually analyzed for esters or other oxygenated
volatiles. These volatile losses would increase with the use of large amounts of carrier gases for
fluidization or entrainment in the pyrolysis reactor. Larger amounts of carrier gases reduce the
partial pressure of the volatiles, requiring a lower temperature for their condensation.
With no added catalysts, the reaction of acetic acid in an excess of methanol in the liquid phase
appears to be a second-order reaction with respect to acetic acid. At 70ºC, a mixture of 1 N acetic
acid in purified methanol was 50% complete after about 27 hours. Sodium acetate or ammonium
acetate buffers reduced the reaction rate; after 27 hours the reaction was only 10% complete at
70ºC. With methanol and acetic acid at 0.125 N to 1.0 N in anisol as the solvent, the esterification
14
rate appeared to be proportional to the concentration of methanol times the concentration of acetic
acid raised to the 1.5 power (Rolfe and Hinshelwood 1934).
At 25ºC with no added catalysts, the bimolecular reaction rates of acetic acid and methanol were
extrapolated to be twice those of acetic acid and benzyl alcohol; 88 times faster than for methyl
alcohol and benzoic acid; and 173 times faster than for benzyl alcohol and benzoic acid. This
reflects the slower reaction rate of the larger molecules (Hinshelwood and Legard 1935).
With 0.005 N hydrochloric acid (HCl) (182 ppm or a pH of 2.3) as the catalyst at 30ºC, the
esterification of a stoichiometric mixture of methyl alcohol with formic acid was 50% complete
in about 3 minutes. The reaction rate of the mixture then slowed considerably and approached
equilibrium after about 40 minutes. The catalyzed reaction rate for methanol with formic acid was
14 times higher than with acetic acid; 18 times higher than with propionic acid, and 28 times
higher than with butyric and higher acids (Smith 1939).
Experimentally the rate of ester hydrolysis is a function of pH. Figure 5 shows that the hydrolysis
rate of ethyl acetate varied continuously over five orders of magnitude, when the pH was changed
from –0.9 to 3.7 (Euranto 1969). The esterification rate (forward reaction) can be calculated from
the hydrolysis rate (reverse reaction) multiplied by the thermodynamic equilibrium constant.
Figure 5. Hydrolysis Rate of Ethyl Acetate and pH
(Euranto 1969)
1.E-08
1.E-07
1.E-06
1.E-05
1.E-04
1.E-03
1.E-02
-101234
pH = -log [H+]
Relative Kinetic Rate
15
Organic acids react with olefins to form iso-esters, but do not form water as a by-product. This
reaction is normally catalyzed with a strong acid, e.g., sulfuric or zeolites (Sato 1984), to achieve
reaction rates of commercial interest. However, without added catalysts, olefins (except ethylene)
react slowly with dilute acetic acid at elevated temperatures to form iso-esters. Thus, the reaction
of propene with acetic acid yields isopropyl acetate. Hydrolysis of the iso-ester causes the iso-
alcohol to form (Suida 1931).
Relatively anhydrous formic acid under reflux conditions without added catalysts reacted with
unsaturated, long-chain fatty acids to form the expected iso-ester. These iso-esters were then
hydrolyzed to form the iso-alcohol (Knight et al. 1954).
3.1.2 Transesterification
The transesterification reaction is the exchange of alcohol and acid groups in a mixture of two or
more esters:
O O O O
RC + R’’C RC + R’’C
OR’ OR’’’ OR’’’ OR’
This reaction is catalyzed similarly to esterification. In a mixture of esters, transesterification is
thought to occur. Because esterification is reversible, acids and alcohols can also be reacted with
esters to form new esters, acids, and alcohols.
3.2 Reactions of Aldehydes
3.2.1 Homopolymerization
Aldehydes can react with each other to form polyacetal oligomers and polymers:
O H
nRC + H2O H(-CO-)
n
OH
H R
The poly(oxymethylene) polymer has limited solubility in water. Methanol in aqueous
formaldehyde solution decreases the value of n, which is used advantageously to stabilize
formaldehyde commercially. The methanol content of commercial formaldehyde solutions is
usually 6% to 15%, although contents of 1% or less are available. These solutions develop
measurable amounts of methylal during prolonged aging. Ethanol, propanol, isopropanol, glycols,
and glycerol are used to stabilize formaldehyde solutions (Walker 1953).
Additives to stabilize formaldehyde solutions include hydroxypropyl methyl cellulose, methyl
and ethyl cellulose, and isophthalobisguanamine at levels as high as 100 ppm. Conversely, if the
formaldehyde polymer is stabilized with the proper end groups (e.g., esterification of the
hydroxyl end group with acetic anhydride), it can be a useful polymer such as DuPont’s Delrin.
Without special polymerization techniques, the value of n is limited to about 100 (Gerberich et al.
1980).
The addition reaction of aldehydes to form hydroxy aldehyde dimers is known as the aldol
reaction, which proceeds nicely under basic conditions and very slowly under acidic conditions
(Cason 1956). Formaldehyde condenses to form hydroxyacetaldehyde, glyceraldehyde,
dihydroxy acetone, ketotetrose, and various aldotetroses in the presence of a small amount of
16
organic acid and the oxides, hydroxides, carbonates, and organic salts of lead, magnesium, zinc,
and the alkaline earth metals. Formaldehyde was dissolved in an essentially anhydrous solvent
and acidified with the equivalent of 0.08 to 0.19 wt % of acetic acid (after the catalyst was
neutralized). Organic acids useful to catalyze this reaction were said to be formic, acetic,
propionic, glycolic, benzoic, oxalic, etc. Solvents used included methanol, ethanol, dioxan, n-
butanol, and ethylene glycol. Yields of syrups or precipitates were 55% to 93% of the
formaldehyde charged, after heating to 100ºC to 138ºC for 20 to 100 minutes. No examples were
given for an aqueous reaction medium or for an uncatalyzed reaction. Also, no quantitative
analyses were given for the products (Lorand 1942).
Furfural forms a resinous tar under acidic conditions at rates proportional to the concentration of
the acid times that of furfural. Temperatures studied were 50ºC to 300ºC. Acids used included
HCl at 1800 ppm (Williams and Dunlop 1948).
3.2.2 Hydration
Aldehydes or ketones mixed with water react to form hydrates, also referred to as glycols:
O OH
RCR’ + H
2
O RCR’
OH
where R and R’ are hydrogen or alkyl groups. The rate of formation of aldehyde hydrates was
said to be quite rapid (Adkins and Broderick 1928a). The reaction of formaldehyde in an excess
of water had a half-life of only 70 ms at 22ºC. The ratio of the hydrate to formaldehyde was 2200
at 22ºC (Sutton and Downes 1972).
The equilibrium constants (molar basis) for water and aldehyde reacting to form the hydrate are
41 for formaldehyde, 0.018 for acetaldehyde, and 0.000025
for acetone (Carey 1996). For a bio-
oil containing 25 wt % water and 3 wt % formaldehyde in equilibrium, 99.9 mol % of the
formaldehyde would be in the hydrate form. For a similar bio-oil with 3 wt % acetaldehyde,
24 wt % of the acetaldehyde would be in the hydrate form. Only a trace of the hydrate of acetone
(0.04% of the acetone weight) would be present as the hydrate in a bio-oil with 3 wt % acetone
and 25 wt % water.
3.2.3 Hemiacetal Formation
When an alcohol is mixed with an aldehyde, a significant amount of heat is liberated and the
hemiacetal is formed by the following reaction:
O OR
ROH + R’C R’C H
H OH
This reaction takes place relatively quickly and without catalysis. Hemiacetals were studied that
were made from ethyl alcohol and acetaldehyde; isopropyl alcohol and acetaldehyde; ethyl
alcohol and benzaldehyde; and ethyl alcohol and methoxy benzaldehyde. Refractive index and
density measurements were used to confirm the rapid formation of hemiacetals. In cases where
the refractive index of the hemiacetal varied considerably from idealized mixtures of the
reactants, equilibrium compositions apparently favored the hemiacetals (Adkins and Broderick
1928a, 1928b).
17
In the absence of catalyst, phenol reacts with formaldehyde to form the phenyl hemiformal,
although to a much lesser degree than the methyl hemiformal. Formaldehyde reacts in the
absence of catalysts with the hydroxyl groups of sugars, starches, and cellulose to form loosely
bound hemiformals (Walker 1953).
Commercially available formaldehyde is mixed with water and methanol to chemically stabilize
it. In aqueous solutions, the amount of free, monomeric formaldehyde is less than 100 pp. This
forms “…a complex equilibrium mixture of methylene glycol (CH
2
(OH)
2
), poly(oxymethylene
glycols) and hemiformals of these glycols.” The water and methanol stabilize the formaldehyde
and prevent the formation of polyformaldehyde resins (Gerberich et al. 1980).
3.2.4 Acetalization
Aldehydes and alcohols react to form acetals as shown by the following reaction:
O OR
2ROH + R’C R’C H + H
2
O
H OR
A modification to this acetal formation is with a diol such as ethylene glycol (HOCH
2
CH
2
OH), in
which one mole rather than two moles of glycol react with the aldehyde to form a cyclic diether
(Street and Adkins 1928).
O O CH
2
HOCH
2
CH
2
OH + R’C R’C H + H
2
O
H O CH
2
In the presence of acid catalysts, stable formals are formed by the reaction of aldehydes and the
hydroxyl groups of sugars, starches, and cellulose. Cellulose reacted with formaldeyde and an
acid catalyst creates a crosslinked polymer that resists swelling in water and dyes. Cotton cloth
treated with formaldehyde and an acid catalyst will hold creases better and is less likely to shrink
(Walker 1953).
In the vapor phase at 25ºC, the equilibrium constant for the formation of 1,1 dimethoxy methane
(methylal) is 3402 and for 1,1 diethoxy ethane (acetal) is 36, based on aldehyde and alcohol
reactants and the Gibbs free energy of formation (DIPPR 1998). Without catalysts high
temperature vapor phase reactions of methanol with saturated aldehydes through heptaldehyde
and of formaldehyde with saturated primary or secondary alcohols are very rapid. These reactions
were explored in a plug flow reactor at stoichiometric ratios of alcohols to aldehydes, temperature
histories of 1.3 to 6 seconds at 350ºC or 1.4 to 2.5 seconds at 460ºC. The reported yields of
acetals were 15 wt % to 69 wt %, based on the weight of starting materials. There was apparently
very little, if any, cracking of the materials to noncondensable gases under these reaction
conditions. The mass balances of just the liquids closed more than 98%, except when nitrogen
carrier gas was used, resulting in a 93% mass balance (Frevel and Hedelund 1954). The actual
average temperature of the reactants may have been lower than stated, as no details were given on
how and where it was measured.
Conditions the vapor phase formation of acetals are very close to those used to produce bio-oil.
This implies that freshly made bio-oil should contain a large amount of acetals, especially with a
long residence time at just below the pyrolysis temperature, e.g., in cyclonic separators, hot-gas
filters, or in the free-board volume above a fluidized bed. Because the normal boiling temperature
18
of methylal is only 42ºC and its vapor pressure at 0ºC is 17.2 kPa (129 mm Hg), most of the
volatile methylal formed will probably not be collected in a typical condensation system.
Catalysts for acetal formation at lower temperatures condensed phase reactions include many
salts potentially present in biomass as ash, e.g., chloride salts of aluminum, calcium, iron (ferric),
lithium, magnesium, manganese, and zinc; copper sulfate, sodium bisulfite; and monosodium
phosphate. Successful acetalization catalysts also form alcoholates. Noncatalytic salts for this
reaction include carbonates and chlorides of sodium and potassium; calcium and sodium sulfates;
and calcium and sodium acetates (Adams and Adkins 1925; Adkins and Nissen 1922). Catalysts
for formal formation include formates of iron, zinc, and aluminum (Walker 1953).
Calcium chloride was an effective acetal catalyst at concentrations as low as 0.2 wt %, although
higher concentrations were more effective. Part of its function was to remove water from the
reaction mixture to achieve a higher conversion, but other dehydration salts, e.g., sodium chloride
or zinc chloride, reduced its catalytic effect (Adams and Adkins 1925).
Trace amounts of strong mineral acids also catalyze the acetalization reaction, e.g., HCl,
phosphoric acid, and nitric acid. In the presence of 5 mg HCl per mole of aldehyde (114 ppm),
the times required to achieve equilibrium at 25ºC with alcohols were 1 to 2 hours with furfural
and unsaturated aldehydes; and 2 days for saturated aldehydes (Minné and Adkins 1933). The
formation rate of acetal increased with the acid concentration; the reactions were complete within
an hour or so with HCl at concentrations as low as 900 ppm or within 5 to 10 minutes with
9000 ppm HCl (Adams and Adkins 1925).
Later studies showed that with only 13 ppm HCl as catalyst, the acetal formation with
acetaldehyde was 50% complete after 50 minutes with methanol, 60 minutes for ethanol and iso-
propanol, and 120 to 180 minutes for butanol (Adkins and Broderick 1928b). With only 3 ppm
HCl, a mixture of ethanol and furfural achieved about 75% of the equilibrium amount of acetal
within 1 day. Nonequilibrium mixtures of furfural acetal, water, and ethanol with only 0.5 ppm
HCl formed essentially equilibrium compositions after an unspecified time (Adkins et al. 1931).
Assuming 100% ionization of dilute HCl, 3 ppm HCl and 0.5 ppm HCl correspond to a pH of 4.0
and 4.9, respectively. Clearly, only trace amounts of HCl are necessary to catalyze the formation
of acetals.
Strong organic acids such as oxalic acid (pK
a
= 1.3) and tartaric acid (pK
a
= 3.0) also catalyze
acetalization, but acetic acid (pK
a
= 4.7) does not catalyze this reaction (Adams and Adkins
1925). Oxalic and tartaric acids are not among the acids listed by Maga (1987) or by Milne et al.
(1997), but 2-hydroxy benzoic acid, which has a pK
a
equal to that of tartaric acid, was listed by
Maga (1987). So some of the stronger organic acids in bio-oil, along with chloride ions in
solution and some chloride salts, may catalyze acetal reactions.
Table 4 shows that the structure of the alcohol and the aldehyde affect the equilibrium constant
(K
e
) of acetal formation. In general, the acetals from primary alcohols and saturated primary
aldehydes are favored. Primary alcohols have K
e
s about 10 times higher than secondary alcohols.
Secondary alcohols have K
e
s about 10 times higher than tertiary alcohols. Likewise, if the
aldehyde group was attached to a primary carbon (n-butanal), the K
e
was about 100 times higher
than if the aldehyde group was attached to a secondary carbon (iso-butanal). Using the reaction of
ethanol with aldehydes containing four carbon atoms as an example, saturated aldehydes had a K
e
about 100 times higher than unsaturated aldehydes and 30 times higher than cyclic unsaturated
aldehydes (furfural) (Minné and Adkins 1933). With a mixture of various alcohols and aldehydes,
the number of possible acetals is quite high, as different alcohols could react with the same
aldehyde.