Biofuel''''s Engineering Process Technology Part 11 pptx
Bạn đang xem bản rút gọn của tài liệu. Xem và tải ngay bản đầy đủ của tài liệu tại đây (3.06 MB, 40 trang )
Pyrolysis Oil Stabilisation by Catalytic Hydrotreatment
391
Pyrolyis oil Ru 1h Ru 2h Ru 4h Ru 6h
0
20
40
60
80
100
Yield (%-wt.)
Acids and esters
Water
DCM (in)solubles
Carbohydrates
Aldehydes, Ketones and lignin monomers
Hydrocarbons
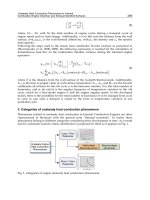
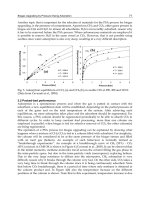
Fig. 4. Composition of fast pyrolysis oil and hydrotreated product oils (Ru/C, 350 °C, 200
bar) at various reaction times using solvent-solvent extraction
It shows the amounts of the various fractions (carbohydrates, aldehydes/ketones/lignin
monomers, hydrocarbons, acids and esters) as a function of the reaction time. A fast decline
in the carbohydrate fraction versus time is visible. Almost complete conversion to other
components within 6 h reaction time is observed, an indication of the high reactivity of this
fraction.
3.2.2 Experimental studies with Ru/C in continuous set-ups
Recently, in depth catalytic hydrotreatment experiments with the Ru/C catalyst in a
continuous packed bed set-up were reported (Venderbosch et al., 2010). The results of this
study will be provided in detail in the following as it provides detailed insights in the effect
of process conditions on product yields, product properties and the various reactions taking
place on a molecular level. Some experiments were carried out in the absence of catalysts to
probe thermal reactions.
The catalytic hydrotreatment reactions were carried out in a set-up consisting of 4 packed
bed reactors in series. The temperature in each reactor may be varied independently,
allowing experiments at different temperature profiles over the length of the reactor. Typical
pressures were between 150 and 300 bar, temperatures between 150 and 400 °C and WHSV’s
between 2-10 kg/kg.cat.h. In the following, the thermal reactions will be discussed, followed
by catalytic hydrotreatment reactions at different temperature levels.
3.2.2.1 Thermal reactions
To study the thermal, non-catalytic reaction in detail, pyrolysis oil was pumped through the
reactor (without catalyst) at pressures of up to 300 bar and temperatures of maximum 350
o
C
for residence times in the order of tenths of second – minutes. Typically under these
conditions, a single-phase pyrolysis oil is converted into a viscous organic liquid, an
aqueous phase and a gas phase. The carbon content of the viscous phase is about 60 wt.%
(starting with 40 wt.% in the original oil), and the oxygen content about 32 wt.%. Additional
water is produced, up to 30 % compared to the water initially present in the pyrolysis oil.
The water is distributed over the two layers, but most of it ends up in the aqueous phase.
Energetically, 80% of the thermal energy in the pyrolysis oil is transferred to the viscous
product, less than 20% and 1 % is retained by the water phase and gas phase, respectively.
The gas phase in such experiments consists of CO and CO
2
in a ratios varying from 1:10 to
Biofuel's Engineering Process Technology
392
1:3 (depending on temperature, pressure, residence time), and in yields of almost 4 wt.% of
the pyrolysis feed.
Although it is unknown at a molecular level which reactions actually take place, at least two
parallel pathways can be distinguished, viz. a reaction causing the formation of gas (here
referred to as decarboxylation / decarbonylation, yielding CO and/or CO
2
), and the other
causing dehydration (likely by condensation (polymerisation) reactions). Possible sources of
these gases are the organic acids in the oil. For all aqueous (and organic) samples produced
the pH, however, is almost similar to the pyrolysis oil feed. This indicates that either the
acids are not converted or the acids are converted and simultaneously produced as well. A
detailed acid analysis of the products is not available, and the precise events taking place
and mechanism however remain unclear. It seems that dilution of the pyrolysis oils with
‘inert’ solvents suppresses the re-polymerisation. Additionally, the gas yield becomes
independent of the temperature and the residence time after a certain threshold in the
residence time, while the amount of water produced is increasing. This indicates that the
reaction mechanism for the formation of gas is different than the polymerisation reactions.
Phase separation of the oil at these conditions may have a number of causes, e.g. an overall
increase in the water content due to the formation of water by condensation reactions. It is
known (but not fully explained yet) that above a certain water content pyrolysis oils phase
separate into an aqueous phase and a rather nonpolar phase. Repolymerisation of some
molecules / fractions in the oil is also a plausible reason, as it renders the products less
soluble in water, for example caused by transformation of the polar sugar constituents
behaving as bridging agents in the dissolution of hydrophilic lignin material (Diebold 2002).
3.2.2.2 Catalytic hydrotreatment reactions
The catalytic hydrotreatment reactions were carried out at three process severity levels, a
mild hydrogenation at either 175 or 225
o
C, a mild hydrodeoxygenation (HDO) at 225 – 275
o
C and a deep hydrodeoxygenation. For the latter, samples from the mild HDO were first
allowed to phase separate completely, after which the organic fraction (containing about 3
wt.% water) was treated at temperatures ranging from 350
o
C in the first two reactor
segments, to 400
o
C in the last two.
3.2.2.3 Visual appearances of liquid phase after reaction
The catalytic hydrotreatment reaction at 175
o
C resulted in a single phase oil with a visual
appearance close to that of the original feed. Thus, at this temperature, phase separation
does not occur. This may be related to the limited production of water at this temperature.
The product has a considerable sweeter smell/odor than the original pyrolysis oil. The mild
hydrogenation at 225
o
C gives two liquid phases, an organic and a water rich phase. The
water phase has a higher density than the aqueous phase. A similar situation was observed
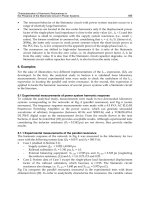
for experiments at higher process severities (mild HDO), see Figure 5 for details. The second
stage HDO product oil has even a lower density than the aqueous phase.
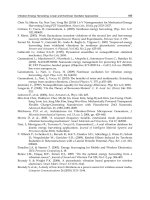
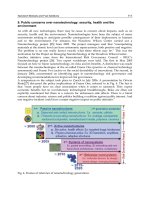
The organic product yields for the various process severities are given in Figure 6. Here, the
severity is expressed in terms of hydrogen consumption, and high severity is associated
with high hydrogen consumption. The yield is a clear function of the temperature. A drop in
the yield to about 40% is observed at about 200
o
C due to the occurrence of phase separation
and transfer of part of the carbon and oxygen to the aqueous phase. A further slight
reduction in yield is observed at higher severities, presumably due to gasification reactions
and further net transfer of components from the organic to aqueous phase.
Pyrolysis Oil Stabilisation by Catalytic Hydrotreatment
393
Fig. 5. Pictures of pyrolysis oil (left), mild HDO (middle) and 2
nd
stage HDO (right) products
Oxygen contents of the product oils are a function of the process severity, see Figure 6 for
details. Phase separation between 175 and 225
o
C results in a dramatic drop in the oxygen
content. This is due to the loss of water and the transfer of very polar highly oxygenated
components to the aqueous phase. At the highest severity, the oxygen content is about 15%,
compared to about 40% for the original pyrolysis oil.
The hydrogen consumption ranges between 65 and 250 Nm
3
/t pyrolysis oil. Higher process
severities lead to higher hydrogen uptakes (Figure 6).
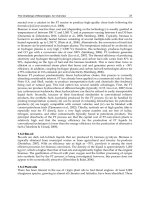
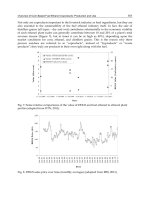
A useful representation to assess the changes in the elemental composition of the product
oils at various process severities is a van Krevelen diagram. Here, the ratio between O/C
and H/C of the products are plotted together in a single diagram. In Figure 7, a typical plot
is provided for selected literature data on pyrolysis oil hydroprocessing (Elliott, 2007;
Venderbosch et al., 2010) and our results with Ru/C at different severities. Presented here
are data points from e.g.:
- wood and pyrolysis oil, and for the four cases referred to in this paper (HPTT,
hydroprocessing at 175 and 225
o
C, Mild HDO and 2
nd
stage HDO);
- A selection of data points derived from literature studies (Baldauf et al. 2007; Churin et
al., 1988; Conti, 1997; Diebold, 2002; Kaiser 1997; Samolada et al., 1998). Some of these
data are derived from various oils from a variety of resources and processed in different
reactors, different catalysts and at different conditions.
The plot also contains curves to represent the changes taking place in elemental composition
during hydroprocessing, a theoretical curve for the dehydration of pyrolysis oil, and trend
lines for the thermal (HPTT) route and hydroprocessing routes based upon the experimental
data points.
Based on our work on the Ru/C catalysts and supported by the literature points in Figure 7,
several reaction pathways can be distinguished:
a. Essentially repolymerisation of the pyrolysis oil (no catalyst, no hydrogen, ‘HPTT’);
b. Merely hydrogenation of the pyrolysis oil at mild conditions (up to 250
o
C, with catalyst
and hydrogen, referred to as mild hydrogenation),
c. Dehydration of the oil at temperatures near 250-275
o
C, and
d. Hydroprocessing of pyrolysis oil at temperatures up to 400
o
C
Biofuel's Engineering Process Technology
394
Upon thermal treatment, the principal reactions are rejection of oxygen as water. Some CO
2
and CO is released as well, which shifts the trend line to slightly higher H/C ratios (but
decarboxylation / decarbonylation is limited to approx. 10 wt.% of the feed). A high
conversion (i.e. at high temperatures and residence times) eventually leads to a hydrogen-
depleted solid material (and probably similar to conventional carbonisation processes,
charcoal).
0.0
25.0
50.0
75.0
100.0
0 100 200 300
Hydrogen consumption (Nm
3
/t)
Elemental composition (dry, wt.%)
0%
20%
40%
60%
80%
100%
120%
Yield (wt.% of oil)
C H O Yield organics
Fig. 6. The elemental composition of the organic oil product (dry basis) versus the hydrogen
consumption for pyrolysis oil, mild hydrogenation, mild HDO and 2
nd
stages HDO
0.0
0.1
0.2
0.3
0.4
0.5
0.6
0.0 0.5 1.0 1.5 2.0
H/C (-)
O/C (-)
Baldauf and Balfanz
(1997)
Churin et. al. (1988)
Conti et al. (1997)
Samolada et al.
(1998)
Elliott (2007)
Kaiser (1997)
Bio-oil (dry)
+H
2
Hydroprocessing 175
o
C
Mild HDO
2nd stage oil
Hydroprocessing 225
o
C
Hydrotreating
-H
2
O
wood
HPTT
Fig. 7. The Van Krevelen plot for oils derived from the thermal pathway (HPTT), mild
hydrogenation, mild HDO and 2
nd
stages HDO, including relevant literature data points
Pyrolysis Oil Stabilisation by Catalytic Hydrotreatment
395
To obtain a liquid product with a higher H/C ratio, additional hydrogen is thus required. This
path is shown in Figure 7 and includes the mild hydroprocessing step, at around 175
o
C (no
phase separation) and 225
o
C (phase separation), followed by further hydrodeoxygenation
(and hydrocracking).
3.2.3 Product oil fractionation; insights in molecular changes
The various organic products were subjected to a standardized liquid-liquid fractionation
protocol (Oasmaa, 2003, Figure 1) to gain insights on the severity of the hydrotreatment
process on product composition. The results are compiled in Figure 8 and show major
changes in composition upon reaction. The pyrolysis oil feed mainly consist of ether
solubles, ether insolubles and water. The components in these fractions originate from the
cellulose and hemi-cellulose fraction in the biomass feed and particularly the ether insoluble
fraction is rich in carbohydrates. The amounts of DCM solubles and insolubles, from the
lignin fraction of the biomass feed, are by far lower and are about 20% in total.
0
25
50
75
10 0
Bio-oil HPTT
tota l
S tabilize d
175 oC
22 5oC
stabilized
10 hr-1
Mild HDO
to tal
mild HDO
organ ic
HDO 2nd
stage
Yield Total (%)
Ether-solubles
Ether Insolubles
Water
DCM Solubles +
extractives
DCM Insolubles
Fig. 8. Comparison of the fractionation results for various process severities
3.2.3.1 Thermal reactions
When comparing the composition of the pyrolysis oil feed with the product from the
thermal route, it is clear that the ether insolubles are converted to DCM-solubles and –
insolubles, and additional water. A similar change occurs in wood oils, stored for several
months or years, where water insoluble products are produced at the expense of the sugar
fraction (Oasmaa&Kuoppala, 2003). At higher temperatures and residence times, especially
this sugar fraction is responsible for charring, likely through the formation of first DCM
solubles and subsequently DCM insolubles (‘char’). Solids production upon heating
aqueous solution of C-6 sugars (e.g. D-glucose, D-mannose) to temperatures up to 400
o
C is
well known. Thermal decomposition, either catalytic (mostly by acids) or non-catalytic,
leads to solid products referred to as humins (Girisuta et al., 2006; Watanabe et al., 2005a;
Watanabe et al., 2005b). The proposed reaction pathway consists of C-6 sugar conversion to
Biofuel's Engineering Process Technology
396
5-hydroxymethyl furfural (HMF) and subsequently levulinic acid (LA) and formic acid (FA).
Both reactions also accompanied by solids (humin) formation (Scheme 1).
Solids formation is highly undesirable and limits the yields of the two promising biobased
chemicals LA and HMF. Despite large research efforts, it has so far not been possible to
avoid solids/humin formation when performing the reactions in aqueous media.
Scheme 1. Decomposition reactions of D-glucose at elevated temperatures.
Higher temperatures and the presence of acid catalysts (homogeneous and heterogeneous)
increase the rate of D-glucose decomposition (Girisuta et al., 2006). Such reactions may also
occur in the fast pyrolysis oil matrix. The oil is acidic in nature due to the presence of
organic acids and these will catalyse the depolymerisation of oligmeric sugars to D-glucose
and other C-6 sugars followed by the reaction to solids and hydroxymethylfurfural and
levulinic acid/formic acid.
Knezevic et al. (2009) studied the thermal decomposition of D-glucose in hot compressed
water under conditions of relevance for the catalytic hydrotreatment of pyrolysis oil (240-
374 °C). It was shown that D-glucose decomposes mainly to char and some gaseous
components (primarily CO
2
), while only a limited number of components remained in the
water phase (for example formaldehyde). At these conditions, the reactions are very fast and
decomposition to char takes place on the time scale of seconds to minutes.
3.2.3.2 Catalytic hydrotreatment reactions
The composition of the product from a mild hydrogenation at 175
o
C (see Figure 8) differs
considerably from that of the original pyrolysis oil. The amount of water increased slightly
(from 25 up to about 30 wt.%), which appears insufficient for phase separation. In addition,
the ether solubles (aldehydes, ketones, acids, etc) are converted, but in smaller amounts
compared to HPTT. The ether insoluble (sugar fraction) is reduced considerably from 35
down to 24 wt.%, while the water insoluble fraction is increased accordingly.
Simultaneously, the increase of the DCM insoluble fraction is about 8%, while the DCM
soluble fraction increases with only 3 wt.%.
Similar to HPTT, we assume that the sugar fraction in the oils is (partially) converted to
more water insolubles and some additional water. However, the actual components formed
during mild hydrotreatment are different in nature than the HPTT oils and particularly the
amount of DCM insolubles is higher.
Pyrolysis Oil Stabilisation by Catalytic Hydrotreatment
397
The results of the fractionation of the product oil derived from an experiment 225
o
C (mild
hydrogenation) are provided in Figure 8. Phase separation occurs and as such the amount of
product oil is reduced considerably. As a result, the amounts of water, ether solubles and
ether insolubles in the organic phases are lowered and imply that components have been
transferred to the water phase. Figure 8 also shows the result for the mild HDO reaction.
Compared with the oil samples obtained at lower temperatures, the DCM insoluble fraction
is now almost completely converted to DCM soluble components, evidence that some
hydrocracking reaction have taken place here as well. In the 2
nd
stage hydroprocessing the
amount of ether solubles increases, at the expense of DCM solubles and the extractives.
3.3 Product characteristics
In all hydrogenation experiments except those at temperatures below 200
o
C, the product
obtained consisted of two liquid phases, viz. an aqueous phase and brown-red organic
phase. For all of them, relevant (basic) characteristics were determined, viz. elemental
composition (vide supra, Figure 7), water content and average molecular weight.
Additionally, to get some insights in the coking tendency, the samples were analyzed using
thermogravimetric analysis (TGA). Here, the residual weight of the sample, heated under
N
2
up to about 900
o
C, was taken as a measure of coking. A high residue indicates a high
tendency for coking and thus a low thermal stability at elevated temperature. The residue
after a TGA measurement is a strong function of the process severity, see Figure 9 for
details.
0
200
400
600
800
1000
1200
1015202530354045
oxygen content (wt%)
severity of process
M
w
(g/mol)
0
5
10
15
20
25
30
residue (wt%)
residue
M
w
Py-Oil
(1) (2) (3)
Fig. 9. Mass average molecular weight and TGA residue of products from (1) stabilisation,
(2) mild hydrotreating, and (3) 2-stage hydrotreating.
At low process severities, the TGA residue increases and the highest value (22%) is observed
at intermediate severities. A further increase in severity leads to a strong reduction in the
TGA residue. Thus, it may be concluded that intermediate severities lead to product oils
with a high TGA residue and consequently have a higher tendency for coking and may be
less suitable as a refinery feedstock.
Biofuel's Engineering Process Technology
398
The organic products were analyzed using gel permeation chromatography (GPC) to
determine the average molecular weights and the results are given in Figure 9. The
molecular weight of the product oils increases compared to the pyrolysis oil feed at low
severity hydrotreatment reactions. Apparently, polymerisation occurs and this has also been
observed when heating up pyrolysis oil to 275°C in the absence of catalysts (HPTT process)
(Rep et al., 2006)
.
A further increase in the severity (higher temperatures, shorter WHSV’s)
leads to a reduction of the molecular weight and a value of less than 300 is observed at the
highest severities.
Of particular interest is the relation between the molecular weight of the products and the
TGA residue. Products with a higher Mw also lead to higher TGA residues and this may be
rationalized by assuming that the higher molecular weight fragments in the products are
precursors for coke formation.
4. Proposed reaction pathways and implications
4.1 Reaction pathways
A schematic and simplified representation of relevant reactions assumed on basis of this
work is presented in Figure 10. In the initial phase of the hydrotreatment process, catalytic
hydrogenation and thermal, non-catalytic repolymerisation occur in a parallel mode.
Pyrolysis oils
High Molecular Fragments
Stable Fragments
soluble in water
Char
Apolair fragments
Insoluble in water
> 1.0
+
Aqueous phase
Apolair fragments
Insoluble in water
< 1.0
+
Aqueous phase
H
2
, catalyst
175 - 250
o
C, 200 bar
min
No catalyst -hydrogen
> 175 , min
H
2
, catalyst
> 250
o
C, 200 bar
H
2
, catalyst
> 250
o
C, 200 bar
min hour
H
2
, catalyst
> 250
o
C, 350 bar
hour
HPTT
Hydrotreating
HydrocrackingHydrodeoxygenation
Charring
Re-polymerization
Stabilization
No catalyst and/or hydrogen
> 175 - 250
o
C, min
?
Fig. 10. Proposed pathways for the catalytic hydrotreatment of pyrolysis oils
Repolymerisation leads to the formation of soluble higher molecular weight fragments
which upon further condensation reactions give char. This route is as such not preferred and
the rate of the polymerisation reactions should be reduced as much as possible. The
preferred pathway involves hydrogenation of the thermally labile components in the
pyrolysis oil feed to stable molecules that are not prone to polymerisation. Subsequent
reactions (hydrogenations and hydrocracking) on a time scale of hours lead to products with
reduced oxygen contents and ultimately to higher H/C ratio’s (Figure 7). The observed
molecular weight of the organic phase as a function of the process severity (Figure 9) implies
that upon the use of Ru/C as the catalyst, the repolymerisation step cannot be avoided, and
a slight increase in molecular weight is observed at low process severities. However, higher
severities lead to a reduction in the average molecular weight, an indication that soluble
higher molecular weight fragments may also be (partly) depolymerised by the action of
hydrogen and a catalyst.
Pyrolysis Oil Stabilisation by Catalytic Hydrotreatment
399
As stated earlier, pyrolysis oil contains large amounts of oligo- and monomeric sugars,
arising from the cellulose and hemi-cellulose fraction of the lignocellulosic biomass feed. As
such, it is of interest to compare the reaction pathways provided in Figure 10 for pyrolysis
oil with that of typical hydrogenation and thermal reactions occurring for carbohydrates at
various process severities.
Thermal decomposition of various monomeric sugars in aqueous media has been studies in
detail and is known to lead to oligomerisation to soluble and subsequently to insoluble
humins (Girisuta et al., 2006). As an example, Knezevic et al. (2009) studied the thermal
decomposition of D-glucose in hot compressed water at elevated temperatures (240-374 °C),
giving solids (char, humins) and some gaseous components (primarily CO
2
). At these
conditions, the reactions are very fast and decomposition to char takes place on the time
scale of seconds to minutes.
Catalytic hydrotreatment of carbohydrates using heterogeneous catalysts has been reported
extensively in the literature. The main focus is on the hydrogenation of D-glucose to D-
sorbitol, a well-known chemical with use in the pharmaceutical and the food industry
(Kusserow et al., 2003). Catalytic hydrotreatment of D-glucose over Ni, Ru based and Pd
based heterogeneous catalysts at 80 °C, 80 bar yields D-sorbitol in high yields (Crezee et al.,
2003; Makkee et al., 1985) (Scheme 2). The hydrogenation reactions at these low temperature
levels may be considered as the stabilisation step in fast pyrolysis oil upgrading.
Scheme 2. Catalytic hydrogenation of D-glucose to D-sorbitol
In the presence of hydrogen and a catalyst, D-sorbitol is not inert at elevated temperatures
(above 180 °C) and may be converted to a variety of products. For instance, Huber et al.
(2004) showed that D-sorbitol can be converted to n-hexane in high yield using Pd and Pt
catalyst on SiO
2
or Al
2
O
3
(225-265 °C and 26-58 bar). Over Ru/SiO
2
, hydrogenolysis of D-
sorbitol at 180-240 °C and 80-125 bar hydrogen pressure yields mainly glycerol and 1,2-
propanediol (Sohounloue et al., 1982) (Scheme 3). This implies that C-C bond cleavage
occurs readily, leading to the formation of lower molecular weight products.
Biofuel's Engineering Process Technology
400
These reactions are likely also occurring upon the catalytic hydrotreatment of fast pyrolysis
and may explain the formation of more apolar lower molecular weight products at higher
process severities.
Thus, it may be concluded that the typical reaction pathways for pyrolysis oils at typical low
severity hydrotreatment conditions mimic those of low molecular weight sugars viz.
repolymerisation reactions to solids (humins) and hydrogenation/C-C bond cleavage
reactions to for instance polyols and finally to hydrocarbons. This strengthens our initial
hypothesis that pyrolysis oil should be regarded as a carbohydrate rich “syrup” and not a
conventional fossil derived hydrocarbon liquid.
Scheme 3. Hydrogenolysis of D-sorbitol to glycerol and 1,2-propanediol.
4.2 Process implications
The proposed reaction pathway for catalytic hydrotreatment of pyrolysis oil (Figure 10)
implies that the rate of the hydrogenation route should be much higher than the rate of the
repolymerisation route to obtain good quality upgraded pyrolysis oil (low molecular
weight, low viscosity, low coking tendency). An obvious solution is the development of
highly active hydrogenation catalysts. These studies will be reported in the next paragraph
of this paper. However, a smart selection of process conditions and reactor configurations
may also be considered, particularly to enhance the rate of the
hydrogenation/hydrodeoxygenation pathway compared to the repolymerisation pathway.
In this respect, it is highly relevant to gain some qualitative insights in the factors that
determine the rate of the individual pathways (hydrogenation versus repolymerisation).
A schematic plot is presented in Figure 11, where an envisaged reaction rate (arbitrary
values, in mole reactant/min) is presented versus the actual reaction temperature. The lines
drawn are taken in case (i) gas-to-liquid mass transfer determines the overall reaction rate
(ii) the catalytic hydrotreatment reactions dominate, and (iii) polymerisation reactions
prevail. Figure 11 is derived on basis of simplified kinetics for the glucose hydrogenation –
polymerisation reactions, but a detailed outline of all assumptions made is beyond the scope
of the presentation here. For this reason the exact values on the x- and y-axes are omitted.
The following relations are taken into account to derive Figure 11:
The conversion rate due to the hydroprocessing reactions R
H
(mol/m
3
r
.s) can be
simplified as a product of the intrinsic kinetic rate expression k
R
and the surface area
Pyrolysis Oil Stabilisation by Catalytic Hydrotreatment
401
available per reactor volume. Being a catalytic reaction, the influence of temperature
can be rather high.
The overall gas-to-solid mass transfer rate of hydrogen depends on reactor geometry
and operating variables. In case of stirred tank reactors (including batch-wise operated
autoclaves), the actual stirring rate is important, while in packed bed the catalyst
particle wetness is relevant. In both, the concentration of hydrogen (thus hydrogen
pressure) is important, together with catalyst particle size, and, to a limited extent,
temperature.
The rate of polymerisation, R
p
, will depend largely on the temperature, and, being a
reaction with order in reactant(s) > 1 (and probably up to 2 or 3), on the concentration of
the reactant.
0
0.25
0.5
350 450 550 650
Temperature (K)
max. conversion rate (mol/min)
GtL mass transfer (Reactor, T, c
H2
)
Repolymerisation
Hydrogenation
I. Hydrogenation
II. Hydrogenation limited
by mass transfer + polymerisation
III. Hydrogenation
limited by mass
transfer +
severe polymerization
R
H
=k
r
a
p
k
r
•6/d
p
f(T, c
H2
)
R
P
=k
p
f(T, c
oil
)
R
H
=k
r
a
p
k
r
•6/d
p
f(T, c
H2
)
R
P
=k
p
f(T, c
oil
)
T
M
T
P
Fig. 11. Schematic indication of the conversion rates in case of mass transfer, hydrogenation
and polymerisation reactions as a function of temperature. The blue solid line would be the
net effective conversion rate.
A number of options may be envisaged to promote the hydrogenation pathway:
Increase the hydroprocessing reaction rate, for instance by a higher catalyst intake or by
an increase in the effective hydrogen concentration in the liquid (pressure, application
of a solvent with a high hydrogen solubility).
Reducing the polymerisation reaction, a.o. by performing the initial stabilisation step at
a low temperature (< 100°C) and reduction of the concentration of the reactants (a.o. by
dilution).
Biofuel's Engineering Process Technology
402
Increase the overall gas-to-liquid mass transfer rate in case the reaction is performed in
the gas-liquid mass transfer limited regime. This may be possible by increasing the
mass transfer surface area in the reactor, higher mass transfer coefficient and / or
increasing the concentration difference between the gas and the liquid.
5. Improved catalyst formulations for the catalytic hydrotreatment of fast
pyrolysis oil
The development of highly active metal catalysts is of prime importance to reduce the
tendency for repolymerisation during catalytic hydrotreatment. All data presented in this
chapter so far are based on a Ru/C catalyst. Ru, however, is an expensive noble metal and
there is an incentive to identify not only more active but also cheaper catalysts for the
hydrotreatment reaction. A possibility is the use of cheaper bimetallic metal catalysts based
on Ni. Ni is known to have high hydrogenation activity for a variety of organic functional
groups and particularly for reactive ketones and aldehydes, and as such is a potential active
metal for hydrotreatment reactions. However, monometallic Ni catalysts (on silicon oxide,
γ- or δ-alumina, or other supports) at the typical temperature and pressures applied here are
not suitable to be used as a hydrogenation catalyst. There are basically two reasons: 1) Ni
requires high reduction temperature (typically 700
o
C) for complete reduction, and 2) Ni
catalysts are known to deactivate rapidly at elevated conditions by char deposition
(“coking”). The carbon deposition can block the nickel surface, or the pore mouths, and,
eventually leading to a strong reduction in the reaction rates. These two drawbacks
regarding the use of Ni were solved a.o. by using another element (metal or non-metal), also
designated as a promoter. One of these proprietary catalysts was studied in detail and will
be referred to in the following as catalyst D.
Figure 12 shows the liquid phase after a hydrotreatment over Cat D versus the severity of
the process, showing the original oil (left) and an oil derived at the most severe conditions
tested here on the right. Interestingly, the product oils obtained over cat D are much more
transparent than those derived from the Ru/C catalyst.
Fig. 12. Visual appearance of the liquid phase after hydrotreatment over catalyst D
Pyrolysis Oil Stabilisation by Catalytic Hydrotreatment
403
A van Krevelen plot gives valuable insights in the difference in performance between
catalyst D and Ru/C (Figure 13). A similar pattern for both is observed as a function of
severity but the curve for Cat D is shifted to higher H/C values. Thus, at a similar oxygen
content, the H/C ratio is higher for catalyst D. This is indicative for a higher hydrogenation
rate for cat D and is known to be favorable regarding product properties.
Repolymerisation reactions appear to occur to a limited extent when using cat D instead of
Ru/C. This is evident when comparing the average molecular weight of the final products
(Figure 14a), as determined by GPC, for both Cat D and Ru/C. For Ru/C the average
molecular weight shows a significant increase from 400 up to 1000 Da at low severities, but a
constant value over the oxygen content interval of 400-450 Da for catalyst D is observed.
TGA residues of the product oils using cat D (Figure 14b) show carbon residues of around
5%. Surprisingly, and not expected on basis of test carried out using other catalysts, already
at less severe operating conditions, a significant reduction in the TGA residues is achieved.
Thus, products with a higher H/C ratio and a lower carbon residue were obtained with cat
D indicating that the rate of the hydrogenation/hydrodeoxygenation reactions over
catalysts D are higher than for Ru/C.
Fig. 13. Van Krevelen plot for oils derived over catalyst Ru/C (circles) and over catalyst D
(stripes). Lines are trendlines.
An important product property for the upgraded oils is the viscosity. In Figure 15, the
viscosity profile of the product oils versus the oxygen content is compared for conventional
catalysts (Ru/C and NiMo, CoMo) and catalyst D. Clearly, the viscosity in the mid range of
oxygen contents is much lower for cat D. Further testing at the extreme of low oxygen
content will be required to grab the full picture but it is clear that cat D gives upgraded
products with a lower viscosity than for conventional catalysts. The lower viscosity is likely
the result of a lower average molecular weight of the products, as shown earlier and the
result of higher hydrogenation/hydrodeoxygenation rates for Cat D compared to Ru/C.
Biofuel's Engineering Process Technology
404
On the basis of the product properties of the upgraded oils obtained with cat D, we can
conclude that repolymerisation is not occurring to a considerable extent. As a result, product
oils with a lower molecular weight and a concomitant lower viscosity, lower TGA residue is
obtained. Thus, the reaction pathway for catalyst D may be simplified considerably, see
Figure 16 for details.
Fig. 14. TGA residue (wt%) for catalyst Ru/C and the catalyst D (top); average molecular
weight of final product (bottom)
Pyrolysis Oil Stabilisation by Catalytic Hydrotreatment
405
Fig. 15. Viscosity of the oil versus the oxygen content for conventional catalysts and for
Cat D.
Pyrolysis oils
Stable
Fragments
soluble in water
nonpolair fragments
Insoluble in water
> 1.0 +
Aqueous phase
nonpolair fragments
Insoluble in water
< 1.0
+ Aqueous phase
H
2
, catalyst
>250
o
C, 200 bar
min hour
H
2
, catalyst
>250
o
C, 350 bar
hour
HPTT
Hydrotreating
HydrocrackingHydrodeoxygenation
H
2
, catalyst
175 - 250
o
C, 200 bar
min
Stabilization
Fig. 16. Proposed pathways for the mild hydrotreating of pyrolysis oils over catalyst D.
6. Application potential of upgraded oils and critical product properties
The research described here is principally meant to produce pyrolysis oil derived products
with the potential to be co-fed in crude oil refineries. It is of interest to discuss some of the
relevant product properties that likely are crucial for this application. An important product
property of the product oil is its tendency to produce coke upon heating, for example
determined by the ‘Conradson Carbon Residue’ (CCR) or residue upon an
thermographimetric analysis (‘TGA residue’, vide supra) (Furimsky, 2000)
.
In general,
pyrolysis-oils show CCR values around 20 to 30% (Samolada, 1998) and this limits its direct
use as a co-feed. The TGA residues for upgraded oils obtained with Ru/C and cat D as
presented in this paper, show values between 3 and 22 wt% (see Figure 14) and are tunable
by process severity (temperature, residence/batch time). It should be realized that low TG
residue values are accessible for hydrotreated products which still contain considerable
amounts of bound oxygen (> 10 wt%). Thus, stable oils may be prepared despite relatively
high bound oxygen contents. From a processing point of view this is also advantageous as it
Biofuel's Engineering Process Technology
406
limits the hydrogen usage for the catalytic hydrotreatment process, a major variable cost
contributor.
Recently investigations have been reported on the co-processing of hydrotreated pyrolysis
oils obtained with a Ru/C catalyst (oxygen contents > 5 wt%) in a lab scale simulated FCC
unit (MAT) (de Miguel Mercader et al., 2010). The hydrotreated products were successfully
dissolved and processed in Long Residue (20 wt% upgraded oil). The yields of FCC gasoline
(44–46 wt.%) and Light Cycle Oil (23–25 wt.%) were close to the base feed and an excessive
increase of undesired coke and dry gas was not observed. Experiments with undiluted
upgraded oils were less successful and dry gas and coke yield were significantly higher than
in case of co-feeding. This clearly demonstrates that co-processing is necessary to obtain
good product yields. This study also shows that, in contrast to initial thoughts, it is likely
not necessary to aim for an upgraded oil with an oxygen content lower than 1 wt%.
Further MAT testing with product oils derived from catalyst D is in progress and will allow
the establishment of detailed process-product relations for co-feeding purposes. The
upgraded oils prepared with cat D have a much higher thermal stability than the original
pyrolysis oil, as evident from the TGA residues (Figure 14). Preliminary investigations have
shown that this allows distillation of the oil in various fractions without the formation of
excessive amounts of char. Further detailed studies are in progress and will be reported in
due course.
7. Conclusions
The upgrading of pyrolysis oil by catalytic hydrotreatment reactions using heterogeneous
catalysts was studied in detail using a Ru/C catalyst. The investigations provided valuable
insights in the chemical transformations occurring during catalytic hydrotreatment and
include both thermal and hydrogenation/hydrodeoxygenation pathways. The
repolymerisation pathway in which the oils are further condensed to soluble oligomers and
eventually to char components competes with a catalytic hydrogenation reaction. In case H
2
is present with a proper catalyst, these soluble oligomers may be depolymerised to
stabilized components that can be further upgraded. In this respect, the pyrolysis oils show
reactivity typically observed for carbohydrates, which is rationalised by considering the
high amounts of oligo- and monomeric sugars in the oil. New, highly active Ni-based
catalysts have been developed, which show much better performance than conventional
ones and provide products with improved properties.
Experimental work is foreseen to elucidate the reaction pathways occurring during catalytic
hydrotreatment in more detail and to develop efficient processes to obtain a stabilized oil
with the desired product properties at the lowest manufacturing costs. These include:
- Determination of the effects of reactor configuration on the reaction rates (including
mass transfer issues) and subsequent reactor selection;
- Determination of relevant physical properties (e.g hydrogen solubility);
- Optimisation of the hydroprocessing conditions and particularly the required hydrogen
levels
- Determination of product-process relations. The effective hydroprocessing severity
required for further co-refining must be defined;
- The source and availability for hydrogen: perhaps even syngas is applicable;
- Effects of reaction exothermicity need to be determined.
Pyrolysis Oil Stabilisation by Catalytic Hydrotreatment
407
8. Acknowledgement
The authors would like to acknowledge the EU for partial funding of the work through the
6th Framework Program (Contract Number: 518312). We also would like to thank the
partners of BIOCOUP project, and especially D. Assink (BTG), A. Ardiyanti and J.
Wildschut (RuG, The Netherlands) for performing (part of) the experiments and mutual
interpretation of results, VTT (Finland) and particularly A. Oasmaa for the fractionation
analysis and V. Yakovlev and S.A. Khromova of the Boreskov Institute for Catalysis (Russia)
for catalyst preparation and stimulating discussions. Furthermore, financial support from
SenterNovem (in CORAF, project no. EOSLT04018, and NEO-project, no. 0268-02-03-03-
0001) is gratefully acknowledged.
9. References
Ardiyanti, A.R., Venderbosch, R.H., Heeres, H.J., (2009) Process-product studies on
pyrolysis oil upgrading by hydrotreatment with Ru/C catalysts, Proceedings of the
2009 AIChE Spring National Meeting, Tampa.
Baldauf W., Balfanz U., Upgrading of fast pyrolysis liquids at Veba Oel AG, in: Biomass
gasification & pyrolysis: state of the art and future prospects, Kaltschmidt M. and
Bridgwater A.V, pp. 392-397, ISBN 1-872691-71-4.
Churin E., Maggi R., Grange P., Delmon B., (1988) Characterization and upgrading of a
bio-oil produced by pyrolysis of biomass, in: Research in Thermochemical biomass
conversion, Bridgwater A.V., Kuester J.L., pp. 896-909, Elsevier Science
Publishers.
Conti L., (1997) Improvement of the flash pyrolysis process and pilot plant for bio-oils
upgrading, Final Report Contract AIR 1-CT92-0216.
Crezee, E., Hoffer, B.W., Berger, R.J., Makkee, M., Kapteijn, F., Moulijn, J.A. (2003). Three-
phase hydrogenation of D-glucose over a carbon supported Ruthenium catalyst-
mass transfer and kinetics. Appl. Catal. A-Gen., 251(1), pp. 1-17.
Diebold, J.P., (2002) A review of the chemical and physical mechanisms of the storage
stability of fast pyrolysis biooils. In: Fast Pyrolysis of Biomass: A Handbook, Vol. 2.,
Bridgwater, A.V., CPL Press, Newbury, UK.
Dimitrijevic R., Lutz, W., Ritzmann, A. (2006) Hydrothermal stability of zeolites:
Determination of extra-framework species of H-Y faujasite-type steamed zeolite,
Journal of Physics and Chemistry of Solids, 67, pp. 1741-1748.
Elliott D.C., (2007), Historical developments in hydroprocessing bio-oils, Energy and Fuels,
21, pp. 1792-1815.
Elliott D.C., Hart T.R., Neuenschwander G.G., Rotness L.J., Zacher A.H., (2009) Catalytic
hydroprocessing of Biomass fast Pyrolysis Bio-Oil to produce hydrocarbon
Products, Environmental Progress & Sustainable Energy, 28(3), pp. 441-449.
Ferrari, M., Delmon, B., Grange, P., (2002) Influence of the impregnation order of
molybdenum and cobalt in carbon-supported catalysts for hydrodeoxygenation
reactions, Carbon, 40, pp. 497-511.
Furimsky, E., (2000) Catalytic hydrodeoxygenation, Applied Catalysis A: General 199, pp. 147-
190.
Biofuel's Engineering Process Technology
408
Girisuta, B., Janssen, L.P.B.M., Heeres, H.J. (2006). A kinetic study on the decomposition of
5-hydroxymethylfurfural into levulinic acid. Green. Chem., 8(8), pp. 701-709.
Gutierrez, A., Kaila, R.K., Honkela, M.L., Slioor, R., Krause, A.O.I., (2009)
Hydrodeoxygenation of guaiacol on noble metal catalysts, Catal. Today, 147, pp.
239-246.
Horne P., Williams P.T., (1996) Reaction of oxygenated biomass pyrolysis compounds over a
ZSM-5 catalyst, Renewable Energy, 2, pp. 131-144.
Huber, G.W., Cortright, R.D., Dumesic, J.A. (2004). Renewable alkanes by aqueous-phase
reforming of biomass-derived oxygenates. Angew. Chem., 43, pp. 1549-1551.
Kaiser M., (1997), Upgrading of fast pyrolysis liquids by DMT, in: Biomass gasification &
pyrolysis: state of the art and future prospects, Kaltschmidt M., and Bridgwater A.V.,
pp. 399-406, ISBN 1-872691-71-4.
Knezevic, D., van Swaaij, W. P. M., and Kersten, S. R. A. (2009). Hydrothermal conversion of
biomass: I, Glucose conversion in hot compressed water. Ind. Eng. Chem. Res.,
48(10], pp. 4731-4743.
Kusserow, B., Schimpf, S., Claus, P. (2003). Hydrogenation of glucose to sorbitol over nickel
and ruthenium catalysts. Adv. Synth. Catal., 345, pp. 289-299.
Lee, C.L., Ollis, D.F. (1984) Interactions between Catalytic Hydrodeoxygenation of
Benzofuran and Hydrodesulfurization of Dibenzothiophene, Journal of Catalysis
87, pp. 332-338.
Mahfud, F.H., Bussemaker, S., Kooi, B., ten Brink G., Heeres, H.J., (2007a), The application of
water soluble Ruthenium catalysts for the hydrogenation of the dichloromethane
soluble fraction of fast pyrolysis oil and related model compounds in a two phase
aqueous-organic system. J. Mol. Cat. A. 277, pp. 127-136.
Mahfud, F.H., Ghijsen, F., Heeres, H.J., (2007b) Hydrogenation of fast pyrolysis oil and
model compounds in L-L biphasic systems using homogeneous ruthenium
catalysts, J. Mol. Cat. A., 264, pp. 227-236.
Maity, S.K., Rana, M.S., Srinivas, B.N., Bej, S.K., Murali Dhar, G., Prasada Rao, T.S.R., (2000),
Characterisation and evaluation of ZrO2 supported hydrotreating catalysts, Journal
of Molecular Catalysis A: Chemical, 153, pp. 121-127.
Makkee, M., Kieboom, A.P.G., Van Bekkum, H. (1985). Hydrogenation of D-fructose and D-
glucose mixtures. Carbohydr. Res., 138(2), pp. 225-236.
Mercader, F.M., Groeneveld, M.J., Kersten, S.R.A., Way, N.W.J., Schaverien, J.C,
Hogendoorn,J.A., (2010) Production of advanced biofuels: Co-processing of
upgraded pyrolysis oil in standard refinery units, Applied Catalysis B: Environmental,
96, pp. 57-66.
Miguel Mercader F., Hogendoorn J.A., Venderbosch R.H., Kersten S.R.A., Groeneveld M.J.,
(2010) Pyrolysis oil upgrading by high pressure thermal treatment, Fuel, 89, pp.
2829-2837.
Oasmaa A., Kuoppala E., Solantausta Y., (2003), Fast pyrolysis of forestry residue: 2.
Physicochemical composition of product liquid. Energy & Fuels, 17(2), pp. 433.
Oasmaa A., Kuoppala E. (2003) Fast pyrolysis of forestry residue. 3. Storage stability of
liquid fuel, Energy & Fuels, 17(4), pp. 1075-1084.
Pyrolysis Oil Stabilisation by Catalytic Hydrotreatment
409
Oasmaa A., (2003) Fuel Oil Quality Properties of Wood-Based Pyrolysis Liquids, thesis
University of Jyväskylä, Finland.
Rep M., Venderbosch R.H., Assink D., Tromp W., Kersten S.R.A., Prins W., Van Swaaij
W.P.M., (2006) De-oxygenation of bio-oils, in Science in thermal and chemical biomass
conversion, Bridgwater A.V and Boocock D.G.B., pp. 1526-1535, CLP Press.
Samolada M.C., Baldauf W., Vasalos I.A., (1998) Production of a bio-gasoline by upgrading
biomass flash pyrolysis liquids via hydrogen processing and catalytic cracking.
Fuel, 77(14), pp., 1667-75.
Satterfield, C.N., Yang, S.H., (1983), Some Effects of Sulfiding a NiMo Catalyst on its
Activity for Hydrodenitrogenation of Quinoline, Journal of Catalysis, 81, pp. 335-
346.
Senol, O.I., Viljava, T.R., Krause, A.O.I, (2005) Hydrodeoxygenation of methyl esters on
sulfided NiMo/Al
2
O
3
and CoMo/Al
2
O
3
catalysts, Catalysis Today, 100, pp. 331-
335.
Sohounloue, D.K., Montassier, C., Barbier, (1982). Hydrogenolysis of sorbitol. React. Kinet.
Catal. Lett., 22, pp. 391-397.
Venderbosch R.H., Prins W.,( 2010), Fast Pyrolysis Technologies, Biofuels Bioproducts and
Biorefining, 4 (2), pp. 178 – 208.
Venderbosch, R.H., Ardiyanti, A.R., Wildschut, J., Oasmaa, A., Heeres, H.J. (2010)
Stabilization of biomass derived pyrolysis oils, Journal of Chemical Technology &
Biotechnology, 85, pp. 674-686.
Vispute, T.P.; Zhang, H.Y.; Sanna, A.; Xiao, R.; Huber, G.W.; (2010) Renewable Chemical
Commodity Feedstocks from Integrated Catalytic Processing of Pyrolysis Oils,
Science 330 (6008), pp. 1222-1227.
Watanabe, M., Aizawa, Y., Iida, T., Aida, T.M., Levy, C., Sue, K, Inomata, H. (2005a).
Glucose reactions with acid and base catalysts in hot compressed water at 473 K.
Carbohydr. Res., 340(12), pp. 1925-1930.
Watanabe, M., Aizawa, Y., Iida, T., Levy, C., Aida, T.M., Inomata, H. (2005b). Glucose
reactions within the heating period and the effect of heating rate on the reactions in
hot compressed water. Carbohydr. Res., 340(12), pp. 1931-1939.
Wildschut J., Arentz J., Rasrendra C.B., Venderbosch R.H., Heeres H.J., (2009a) Catalytic
Hydrotreatment of Fast Pyrolysis oil: Model studies on Reaction Pathways for the
Carbohydrate Fraction, Environmental Progress & Sustainable Energy, 28(3), pp. 450-
460.
Wildschut, J., Mahfud, F.H., Venderbosch, R.H., Heeres, H.J., (2009b) Hydrotreatment of
Fast Pyrolysis Oil Using Heterogeneous Noble-Metal Catalysts, Industrial &
Engineering Chemistry Research 48, pp. 10324-10334.
Wildschut, J., Melián-Cabrera, I., Heeres, H.J., (2010a) Catalyst studies on the
hydrotreatment of fast pyrolysis oil, Applied Catalysis B: Environmental, 99, pp. 298-
306.
Wildschut, J., Iqbal, M., Mahfud, F.H., Melian Cabrera, I., Venderbosch, R.H., Heeres, H.J.,
(2010b) Insights in the hydrotreatment of fast pyrolysis oil using a Ru on C
catalyst., Energy and Environmental Science, 3, pp. 962-970
Biofuel's Engineering Process Technology
410
Xu, Y., Wang, T., Ma, L., Zhang, Q., Liang W., (2010), Upgrading of the liquid fuel from fast
pyrolysis of biomass over MoNi/γ-Al2O3 catalysts, Applied Energy, 87, pp. 2886-
2891.
18
Biomass Feedstock Pre-Processing
– Part 1: Pre-Treatment
Lope Tabil
1
, Phani Adapa
1
and Mahdi Kashaninejad
2
1
Department of Chemical and Biological Engineering, University of Saskatchewan
2
Department of Food Science & Technology, Gorgan University of Agricultural
Sciences and Natural Resources Gorgan
1
Canada
2
Iran
1. Introduction
1.1 Sources of biomass
The two main sources of biomass for energy generation are purpose-grown energy crops
and waste materials (Larkin et al., 2004). Energy crops, such as Miscanthus and short
rotation woody crops (coppice), are cultivated mainly for energy purposes and are
associated with the food vs. fuels debate, which is concerned with whether land should be
used for fuel rather than food production. The use of residues from agriculture, such as
barley, canola, oat and wheat straw, for energy generation circumvents the food vs. fuel
dilemma and adds value to existing crops (Chico-Santamarta et al., 2009). In fact, these
residues represent an abundant, inexpensive and readily available source of renewable
lignocellulosic biomass (Liu et al., 2005).
1.2 Current issues related to biomass utilization
The main problem with agricultural straw is its relatively low density in its original or baled
forms. The bulk density of loose and standard baled straw is approximately 40 kg/m
3
and
100 kg/m
3
, respectively, compared with the bulk density of unprocessed wood residue,
which is approximately 250 kg/m
3
(Demirbaş, 2001; Tripathi et al., 1998). The relative low
density of straw makes it more expensive to transport compared to wood and coal because a
lower mass of straw can be transported per unit volume. Additionally, a larger storage
area/volume is required for baled straw compared to wood chip. Densification into pellets
increases the bulk density of biomass (McMullen et al., 2005; Obernberger and Thek ,2004)
and as a result, the net calorific content per unit volume is increased (Bhattacharya et al.,
1989) and the storage, transport and handling of the material is easier and cheaper
(Balatinecz, 1983; Bhattacharya et al., 1989; Kaliyan and Morey, 2006).
The quality of fuel pellet is usually assessed based on its density and durability. High bulk
density increases storage and transport capacity of pellets (Adapa et al., 2007; Mani et al.,
2003). Since feeding of boilers and gasifiers generally is volume-dependent, variations in
bulk density should be avoided (Larsson et al., 2008). A bulk density of 650 kg/m
3
is stated
as design value for wood pellet producers (Obernberger and Thek 2004). Low durability of
pellets results in problems like disturbance within pellet feeding systems, dust emissions,
Biofuel's Engineering Process Technology
412
and increased risk of fire and explosions during pellet handling and storage (Temmerman et
al. 2006).
Densification of straw and determining the optimal parameters involved is an art in itself.
The entire process involves securing of baled straw from agricultural fields, size reduction
(chopping and grinding), application of pre-treatment (chemical, physico-chemical, and
biological), determining the physical and frictional properties of straw grinds,
lignocellulosic characterization of straw, lab-scale and pilot-scale densification of grinds into
pellets to determine the effect of various independent parameters on quality (density and
durability), and energy analysis/ balance (Fig. 1). This chapter will only address the effect
and need of lignocellulose characterization, pre-treatment and size reduction, and physical
properties on densification of agricultural straw.
Fig. 1. Processing steps involved in converting straw from field to pelletized product.
Biomass Feedstock Pre-Processing – Part 1: Pre-Treatment
413
2. Lignocellulosic biomass characterization
2.1 Structure of lignocellulosic material
Lignocellulosic material refers to plant biomass that is composed of cellulose, hemicellulose,
and lignin (Fig. 2) (Lin and Tanaka, 2006). The major combustible component of non-food
energy crops is cellulose, followed by lignin.
Cellulose: Cellulose is an organic polysaccharide consisting of a linear chain of several
hundreds to over nine thousand β(1→4) linked D-glucose (C
6
H
10
O
5
)n units (Crawford, 1981;
Updegraff, 1969). Cellulose, a fibrous, tough, water-insoluble substance, is found in the cell
walls of plants, particularly in the stalks, stems, trunks and all the woody portions of the
plant body (Nelson and Cox, 2005). Cellulose comprises 40-60% of the dry weight of plant
material (the cellulose content of cotton is 90% and that of wood is 50%) (Encyclopædia
Britannica, 2008; USDE, 2006).
Zandersons et al. (2004) and Shaw (2008) reported that binding of wood material during hot
pressing / densification is mainly dependent on the transition of cellulose into the
amorphous state. According to Hon (1989), due to the semi-crystalline structure, hydrogen
bonded cellulose cannot be dissolved easily in conventional solvents, and it cannot be
melted before it burns; hence, cellulose itself is not a suitable adhesive. This can be
overcome by breaking the hydrogen bonds, thus making the cellulose molecule more
flexible (Hon 1989). Cellulose requires a temperature of 320°C and pressure of 25 MPa to
become amorphous in water (Deguchi et al., 2006).
Hemicellulose: Hemicellulose is made of several heteropolymers (matrix polysaccharides)
present in almost all plant cell walls along with cellulose (Fig. 2). While cellulose is
crystalline, strong, and resistant to hydrolysis; hemicellulose has a random, amorphous
structure with less strength. Hemicellulose is a polysaccharide related to cellulose and
comprises 20-40% of the biomass of most plants. In contrast to cellulose, hemicellulose is
derived from several sugars in addition to glucose, including especially xylose but also
mannose, galactose, rhamnose and arabinose (Shambe and Kennedy, 1985). Branching in
hemicellulose produces an amorphous structure that is more easily hydrolyzed than
cellulose (Shaw, 2008). Also, hemicellulose can be dissolved in strong alkali solutions.
Hemicellulose provides structural integrity to the cell. Some researchers believe that natural
bonding may occur due to the adhesive properties of degraded hemicellulose (Bhattacharya
et al., 1989).
Lignin: Lignin is a complex chemical compound most commonly derived from wood and is
an integral part of the cell walls of plants (Lebo et al., 2001; Zandersons et al., 2004). The
compound has several unusual properties as a biopolymer, not the least its heterogeneity in
lacking a defined primary structure. Lignin fills the spaces in the cell wall between cellulose
and hemicellulose (Fig. 2). It is covalently linked to hemicellulose and thereby crosslinks
different plant polysaccharides, conferring mechanical strength to the cell wall and
consequently to the whole plant structure (Chabannes et al., 2001).
Lignin acts as a binder for the cellulose fibres (Fig. 2). van Dam et al. (2004) have reported
that lignin can be used as an intrinsic resin in binderless board production due to the fact
that when lignin melts (temperatures above 140°C), it exhibits thermosetting properties.
Lignin is the component that permits adhesion in the wood structure, and is a rigidifying
and bulking agent (Anglès et al., 2001). Lehtikangas (2001) reported that water (8-15%) in
pellets will reduce the softening temperature of lignin to 100-135°C by plasticizing the
molecular chains. The adhesive properties of thermally softened lignin are thought to
contribute considerably to the strength characteristics of briquettes made of lignocellulosic
materials (Granada et al., 2002; Shaw, 2008).
Biofuel's Engineering Process Technology
414
Fig. 2. Location and arrangement of cellulose microfibrils in plant cell walls (Murphy and
McCarthy, 2005; Shaw, 2008).
2.2 Rapid characterization of lignocellulosic materials
The effect of various pre-processing and pre-treatment methods (Fig. 1) on the
lignocellulosic matrix at the molecular level is not well understood. Applications of pre-
processing methods such as size reduction or increasing porosity, and pre-treatment
techniques such as steam explosion on agricultural biomass have demonstrated an
improvement in pellet (compact) quality that can be attributed to the changes in the
lignocellulosic components and distribution (Bagby, 1982; Focher et al., 1998). Therefore, it is
critical to rapidly quantify the change in cellulose, hemicelluloses and lignin components of
biomass due to application of pre-treatment methods.
Infrared spectroscopy has the potential to produce qualitative and quantitative analytical
data for samples with minimum or no sample preparation, and at high speed and
throughput (Adapa et al., 2011b and 2009; Budevska, 2002; Luypaert et al., 2003; Smola and
Urleb, 2000; Tucker et al., 2000). Traditionally, chemical analyses of the individual
components (e.g., lignin) of lignocellulosics have been performed by acid hydrolysis
followed by gravimetric determination of lignin (Kelley et al., 2004). These methods can
provide highly precise data. However, these methods are laborious, time-consuming, and,
consequently, expensive to perform and sample throughput is limited.
2.3 Fourier transform infrared spectroscopy
Fourier Transform Infrared Spectroscopy (FTIR) can be used to rapidly characterize and
quantify cellulose-hemicellulose-lignin composition prior to and after application of various
methods of pre-processing and pre-treatment of biomass (Adapa et al., 2009). The
quantitative analysis of FTIR absorption spectrometry is based on the Bouguer-Beer-
Lambert law (Sherman Hsu, 1997). According to this law, the intensities of absorption bands
are linearly proportional to the concentration of each component in a homogenous mixture
or solution.
Regression equations to predict the lignocellulosic content of agricultural biomass can be
developed using pure cellulose, hemicelluloses and lignin as reference samples, and
Biomass Feedstock Pre-Processing – Part 1: Pre-Treatment
415
subsequently mixing them in different proportions to determine the change in absorption
intensity at characteristic peak height (Adapa et al., 2011b). An overview of the experimental
procedure to characterize the lignocellulosic composition is provided in Figure 3.
Pure cellulose has five distinct characteristic/ prominent peaks at wavenumbers of 1431,
1373, 1338, 1319 and 1203 cm
-1
. Similarly, hemicellulose (xylan) has prominent peaks at
wavenumbers of 1606, 1461, 1251, 1213, 1166 and 1050 cm
-1
. The lignin spectrum has
characteristic peaks at wavenumber of 1599, 1511, 1467, 1429, 1157 and 1054 cm
-1
. The
intensity of absorption at characteristic peak heights of cellulose, hemicellulose and lignin
were used to develop regression equations to predict lignocellulosic composition of any
agricultural biomass (Table 1) (Adapa et al., 2011b).
Fig. 3. Experimental procedure followed to characterize lignocellulosic composition of
agricultural straw (Adapa et al., 2011b).