Monitoring Control and Effects of Air Pollution Part 6 pdf
Bạn đang xem bản rút gọn của tài liệu. Xem và tải ngay bản đầy đủ của tài liệu tại đây (312.12 KB, 20 trang )
Remote Sensing of PM2.5 Over Penang Island from Satellite Measurements
91
space: past, present and future, Bulletin of the American Meteorological society,
2229-2259
Liu, C. H.; Chen, A. J. ^ Liu, G. R. (1996). An image-based retrieval algorithm of aerosol
characteristics and surface reflectance for satellite images, International Journal Of
Remote Sensing, 17 (17), 3477-3500
Makra, L. and Brimblecombe, P. 2004. Selections from the history of environmental
pollution, with special attention to air pollution. Part 1. International Journal of
Environment and Pollution (IJEP), 22(6):641-656
Makra, L., Horváth, Sz., Taylor, C.C., Zempléni, A., Motika, G. and Sümeghy, Z. 2001a.
Modelling air pollution data in countryside and urban environment, Hungary. The
2nd International Symposium on Air Quality Management at Urban, Regional and
Global Scales. Istanbul Technical University, Istanbul, Turkey, 25-28 September
2001. Proceedings.189-196. Eds: Topcu, S., Yardim, M.F. and Incecik, S
Makra, L., Horvلth, Sz., Zempléni, A., Csiszلr, V., Rózsa, K. and Motika, G. 2001b. Air
quality trends in Southern Hungary. "3rd International Conference on Urban Air
Quality and 5th Saturn Workshop. Measurement, Modelling and Management."
Institute of Physics, Canopus Publishing Limited. Loutraki, Greece. Extended
Abstracts CD-ROM. [2001. március 19-23.]
Popp, C.; Schläpfer, D.; Bojinski, S.; Schaepman, M. & Itten, K. I. (2004). Evaluation of
Aerosol Mapping Methods using AVIRIS Imagery. R. Green (Editor), 13th Annual
JPL Airborne Earth Science Workshop. JPL Publications, March 2004, Pasadena,
CA, 10
Quaidrari, H. dan Vermote, E. F. (1999). Operational atmospheric correction of Landsat TM
data, Remote Sensing Environment, 70: 4-15
Retalis, A.; Sifakis, N.; Grosso, N.; Paronis, D. & Sarigiannis, D. (2003). Aerosol optical
thickness retrieval from AVHRR images over the Athens urban area, [Online]
available: />talisetal_web.pdf
Richter R (1990) A fast atmospheric correction algorithm applied to Landsat TM images. Int
J Remote Sens 11(11):159–166
Schroeder TA, Cohen WB, Song C, Canty MJ, Yang Z (2006) Radiometric correction of multi-
temporal Landsat data for characterization of early successional forest patterns in
western Oregon. Remote Sens Environ 103:16–26
Song C, Woodcock CE, Seto KC, Lenney MP, Macomber SA (2001) Classification and change
detection using Landsat TM data: When and how to correct atmospheric effects?
Remote Sensing of Environment, 75, 230-244
Tan, K. C., Lim, H. S., MatJafri, M. Z. and Abdullah, K., 2010, Landsat data to evaluate urban
expansion and determine land use/land cover changes in Penang Island, Malaysia,
Springer, Environmental Earth Sciences, 60(7), p. p.1509–1521, ISSN: 1866-6280
(Print)18666299(Online),Availableonline: />00w220673408052/. Digital Object Identifier: 10.1007/s12665-009-0286-z
Vermote, E. & Roger, J. C. (1996). Advances in the use of NOAA AVHRR data for land
application: Radiative transfer modeling for calibration and atmospheric correction,
Kluwer Academic Publishers, Dordrecht/Boston/London, 49-72
Vermote, E.; Tanre, D.; Deuze, J. L.; Herman, M. & Morcrette, J. J. (1997). 6S user guide
Version 2, Second Simulation of the satellite signal in the solar spectrum (6S),
Monitoring, Control and Effects of Air Pollution
92
[Online]available: />nv2.0_P1.pdf
Vicente-Serrano SM, Perez-Cabello F, Lasanta T (2008) Assessment of radiometric correction
techniques in analyzing vegetation variability and change using time series of
Landsat images. Remote Sens Environ 112:3916–3934
7
Photoacoustic Measurements of Black Carbon
Light Absorption/Scattering Coefficients and
Visibility Degradation in Jordan
During 2007/2008
Khadeejeh M. Hamasha
Physics Departement, University of Tabuk,
Kingdom of Saudi Arabia
1. Introduction
Air is the name given to atmosphere used in breathing and photosynthesis. Air supplies us
with oxygen which is essential for our bodies to live. Air consists of 79% nitrogen, 20%
oxygen, 1% water vapor and inert gases. Air pollution is the introduction of chemicals,
particulate matter, or biological materials that cause harm or discomfort to organisms into
the atmosphere. Air pollutants are known as substances in the air that can cause harm to
humans and the environment. These substances are not naturally found in the air at greater
concentrations or in different locations from usual. Pollutants can be in the form of solid
particles, liquid droplets, or gases. In addition, they may be arising from natural processes
or human activities.
Pollutants can be classified as primary air pollutants or secondary air pollutants according
to their sources. Usually, primary air pollutants are directly emitted from a process, such
as ash from a volcanic eruption, sulfur dioxide released from factories or the carbon
monoxide gas from a motor vehicle exhaust. Secondary pollutants are not emitted
directly. But, they form in the air when primary pollutants interact or react. An example
of a secondary pollutant is ground level ozone, which is one of the many secondary
pollutants that make up photochemical smog. Some pollutants may be both primary and
secondary: that is, they are both emitted directly and formed from other primary
pollutants.
The primary air pollutants found in most urban areas are dispersed throughout the world’s
atmosphere in concentrations high enough to gradually serious health problems. This
problems can occurs quickly when air pollutants are concentrated. The main sources of
pollutants in urban areas are transportation and fuel composition in stationary sources, such
as commercial, coal-burning power plant, cooling, and industrial heating.
One type of air pollution is the release of particles (aerosols) into the air from burning fuel
for energy. Aerosols are defined as the relatively stable suspensions of solid or liquid
particles in gas. There are many properties of particles that are important for their role in the
atmospheric processes. These include number concentration, mass, size, chemical
composition, and aerodynamic and chemical properties (Chang et al. 1982; Walker 1966). Of
Monitoring, Control and Effects of Air Pollution
94
these, size is very important. It is related to the source of particles and their impact on health
(Harber et al. 2003; Puntoni et al. 2004; Borm et al. 2005), visibility, and climate (Finlayson-
Pitts and Pitts 2000).
2. Black carbon
Light absorbing carbon particles (organic carbon and black carbon) are the most abundant
and efficient light absorbing component in the atmosphere in the visible spectrum. It
typically depends inversely on wavelength (Horvath 1993; Horvath 1997). Organic carbon
is strongly wavelength dependent, with increased absorption for UV and short
wavelength visible radiation, but hardly at all at 870 nm. Black carbon is very likely to
dominate at 870 nm (Lewis et al. 2008). When aerosols absorb light, the energy of the light
is transferred to the particles as heat and eventually is given to the surrounding gas.
Aerosol particles in the atmosphere have a great influence on fluxes of solar energy and
the accompanied fluctuations in temperature caused by changes in the aerosol (Horvath
1993).
Black carbon, the main constituent of soot, is almost exclusively responsible for aerosol light
absorption at long wavelength visible radiation and near infrared wavelengths. This type of
pollution is sometimes referred to as black carbon pollution. Air pollution caused by black
carbon particles has been a major problem since the beginning of the industrial revolution
and the development of the internal combustion engine. Scientific publications dealing with
the analysis of soot and smoke date back as early as 1896 (Arrhenius 1896). Mankind has
become so dependent on the burning of fossil fuels (petroleum products, coal, and natural
gas) that the sum total of all combustion-related emissions now constitutes a serious and
widespread problem, not only to human health (Gillmour et al. 2004, Gardiner et al. 2001,
Parent et al. 2000), but also to the entire global environment (IPCC 1996, Finlayson-Pitts and
Pitts 2000).
Absorption of solar radiation by black carbon is expected to lead to heating of the
atmosphere since the light energy is converted into thermal energy (Finlayson-Pitts and Pitts
2000). This is the opposite effect of scattering of light by particles into the upper atmosphere.
This heating effect would be expected to be most important in polluted urban areas (Liu and
Smith 1995, Horvath 1995). Black carbon aerosol light absorption reduces the amount of
sunlight available at the surface to drive atmospheric circulation and boundary layer
development.
Even the burning of wood and charcoal in fireplaces and barbeques can release significant
quantities of soot into the air. Some of these pollutants can be created by indoor activities
such as smoking and cooking. So pollution also needs to be considered inside homes,
offices, and schools. According to the world health report 2002 indoor air pollution is
responsible for 2.7% of the global burden of disease (WHO 2010). We spend about 80-90% of
our time inside buildings, and so our exposure to harmful indoor pollutants can be serious
(Harber et al. 2003; Puntoni et al. 2004; Borm et al. 2005). It is therefore important to consider
both indoor and outdoor air pollution.
3. Jordan
Jordan is located between 29°10΄ N - 33°45΄ N and 34°55΄ E - 39°20΄ E. The discovery of oil in
the Arabian Peninsula has resulted in fast growth and social and economical development
Photoacoustic Measurements of Black Carbon Light
Absorption/Scattering Coefficients and Visibility Degradation in Jordan During 2007/2008
95
in the Gulf States and their neighboring countries including Jordan, which provides skilled
workers. The social and economic development in Jordan has been accompanied by an
increase in the consumption of oil for different needs, including residential, commercial,
industrial, transportation, and power generation. According to figures published by the
Department of Statistics, Jordan imported about six million tons of crude oil in 2005
(Department of Statistics, 2010).
Combustion of oil and other fossil fuel is recognized as a major source of air pollution in
urban areas. Several airborne substances can remain in the atmosphere for weeks, and travel
over hundreds of kilometers, making air pollution a global problem. Common pollutants
that are generated through oil combustion are carbon oxides (CO and CO
2
), sulfur oxides
(SOx), nitrogen oxides (NOx), particulate matter (PM), and volatile organic compounds
(VOCs). Tropospheric ozone is a secondary pollutant that is generated in the troposphere
through a photosynthesis reaction of NOx and VOCs in the presence of solar radiation. It is
becoming a major threat to air quality in metropolitan areas.
Emissions from motor vehicles account for 50–90 percent of air pollution in urban centers
(Cooper et al. 1996; Gillies et al 2008). There are just over 750,000 vehicles licensed in Jordan,
of which 77.5% are registered in the capital, Amman (Department of Driving and Vehicles
Licensing 2010). More than 31% of the vehicles in Jordan are diesel-powered. Vans and
trucks represent 33% and 42.7% of the total diesel-powered vehicles, respectively. Most
public transportation vehicles work inside cities, especially Amman and Zarqa. Particles
emanated from motor vehicles contain sulfate, carbonaceous particles, and a large number
of chemicals (Kassel 2003).
Other sources of air pollution in Jordan include power generation, which uses heavy oil and
natural gas; cement production, which uses oil shale; cooking; home furnaces fueled by
diesel, natural gas, or kerosene; in addition wood stoves. The unexpected jump in oil prices
experienced during winter of 2007 has forced people with low income in the countryside
and mountainous areas to switch to wood stoves because they use either olive husk or
wood, which are available at low, or no, cost in their immediate surroundings.
The negative health impact of air pollution has been widely studied in humans and
animals. Findings of several epidemiology studies pointed out that high levels of air
pollution may result in several health problems, including eye irritation, skin irritation,
asthma, lung cancer, cardiovascular issues, high blood pressure, lung tumors, and
increasing mortality rate (Pope et al. 1995; Künzli et al. 2000; Pope et al. 2002; Takano et
al. 2002; Sanjay Rajagopalan 2008). Over 300,000 cases of chronic bronchitis, 500,000
asthma attacks, and 16 million lost person-days of activity recorded in Europe were
blamed on vehicle emissions (Künzli et al. 2000). Exposure to high levels of SO
2
causes
impairment of the respiratory function and aggravates existing respiratory and cardiac
illnesses (Andre 2001). Long-term exposure to NO
2
lowers resistance to respiratory
infections and aggravates existing chronic respiratory diseases. In addition to its adverse
impact on humans, air pollution has adverse impacts on animals, and vegetation, in
addition to loss of crops.
In spite of the fast growth of urban areas and industrial activities in Jordan, air pollution has
not received due attention. Air quality is not routinely monitored anywhere except at
Alhashameiah (to the northeast of Zarqa), which experiences high levels of sulfur oxides
and particulates. There have been a few studies that tackled air pollution in Jordan, but they
Monitoring, Control and Effects of Air Pollution
96
have been limited to three stations only: Downtown and Shmeisani areas in Amman, as well
as Al-Hashemyeh. Those studies have pointed out that local air quality is poor where
concentrations of criteria pollutants (NOx, SOx, CO, PM
10
, TSP, Lead, and hydrogen sulfide)
exceed the National Air Quality Standards (Asi et al. 2001; Hamdi 2008). The Jordanian
ministry of environment has recently launched a project to establish an air quality
monitoring network throughout the country, but actual steps towards that goal have not
been taken yet.
4. Measurements of black carbon levels using photoacoustic technique
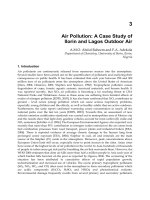
Photoacoustic instrument (Arnott 1999) is used to measure the black carbon light absorption
coefficients. Data were displayed as absorption coefficients in 1/Mm, and were later
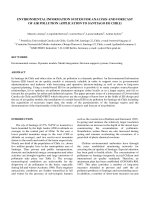
converted to black carbon mass concentration. The photoacoustic instrument (figure 1)
utilizes a microphone to record sound issuing from heat transferred from light absorbing
aerosol to the surrounding air. A power meter records the laser power. The ratio of
microphone pressure and laser power is used to obtain the light absorption coefficient.
Photoacoustic instruments have a very large dynamic range of measurement, and are not
influenced by artifacts due to filter loading and scattering aerosol associated with filter-
based sampling methods (Arnott et al. 2005).
Fig. 1. A schematic view of the photoacoustic spectrometer instrument. (PMT is a
photomultiplier)
Photoacoustic Measurements of Black Carbon Light
Absorption/Scattering Coefficients and Visibility Degradation in Jordan During 2007/2008
97
Black carbon and organic carbon are the most efficient light-absorbing aerosol species in
the visible spectral range. Organic carbon is strongly wavelength dependent, with
increased absorption for UV and short wavelength visible radiation, but hardly at all at
870 nm. Black carbon is very likely to dominate at 870 nm (Rosen et al. 1978; Lindberg et
al. 1993; Lewis et al. 2008). Thus the measurement of aerosol light absorption at
wavelengths in the long visible wavelength is correlated to the measurement of black
carbon. Light absorption by particles depends on the wavelength of the incident light. The
relationship between the aerosol absorption coefficients, B
abs
and the corresponding black
carbon mass concentration (BC) is established by the aerosol specific mass absorption
efficiency σ
abs
via the relationship:
abs abs
BBC
σ
=
(1)
The magnitude of
abs
σ
ranges from 2 to 20 m
2
/g (Liousse et al. 1993). Black carbon mass
concentrations (BC) are calculated from B
abs
using the light absorption efficiency for black
carbon,
α
a
, such that (Arnott et al. 1999):
()( )( )
-1 3 2
abs a
BMm=BCμg/m × m /
g
m
α
(2)
and,
2
a
10m /
g
m for 532nm
αλ
==
(3)
Since B
abs
is proportional to 1/
λ
(Kirchstetter et al. 2004); then
α
a
is also proportional to
1/
λ
. Therefore,
1
2
870
(870 ) (532 )( )
532
6.11 /
aa
nm nm
mg
αα
−
=
=
(4)
Substituting back in equation (2) yields
()()
abs
BC 870nm = B 870nm /6.11
(5)
5. Black carbon levels in Jordan
Measurements of black carbon light absorption coefficients (B
abs
) using photoacoustic
instrument at the wavelength of 870 nm in different locations of Jordan show that B
abs
is
higher for the locations in the city centers than the locations in the industrial centers during
summer 2007( Hamasha et al. 2010). Low black carbon concentrations in the vicinity of
industrial zones are attributed to the efficiency of tall stacks in reducing ground level
concentrations of emitted substances. However, tall stacks do not really make air cleaner;
they only carry black carbon and other pollutants to distant locations as seen from the
results at the location in Zarqa downtown. Measurements carried out at Zarqa downtown
Monitoring, Control and Effects of Air Pollution
98
gave the highest levels of black carbon concentration during summer as well as winter
(Hamasha et al. 2010); because of numerous air pollution sources concentrated in the city.
Zarqa is a growing industrial city with a population of about half a million as 2008 estimate
(Department of Statistics 2010). It hosts about 35% of the heavy industry in Jordan including
the only oil refinery, an oil-based power plant, steel factories, a pipe factory, a wastewater
treatment plant, to mention a few. A total of 2400 industrial activities are registered in the
Zarqa Industrial Chamber.
B
abs
in Zarqa city center is about 179 Mm
-1
during summer day, 2007 And about
81Mm
1
during winter day, 2008. While in Amman city center the measured values of B
abs
were about 67Mm
-1
during summer day, 2007 and about 23Mm
-1
during winter day,
2008(Hamasha et al. 2010).
Measurements at Ibbeen city center on a winter day (28/2/2008) show that the city had
relatively high levels of black carbon (about 72 Mm
-1
) for such a small city that is not
crowded with automobiles especially during winter. The city of Ibbeen is very cold in
winter, and people usually use wood heaters. These heaters have chimneys outside that
release significant amounts of black carbon particles as well as other pollutant gases.
Measurements of black carbon light absorption coefficients in six sites in Irbid city were
done during summer 2007. The average value of B
abs
of all the sites was about 40Mm
-1
.
While the largest value was about 61Mm
-1
in the city center (Hamasha and arnott 2009).
6. Indoor air pollution by black carbon
Measurements of the black carbon light absorption coefficients (B
abs
)
using the
photoacoustic instrument, at wavelength of 870 nm, were done inside different buildings
at Yarmouk University/Jordan on summer 2007. The sources of black carbon inside
buildings were the human activities and the incoming aerosol from outside that travel
with air. Inside these buildings there were no kitchens, so no cooking source of black
carbon. As the time of the measurements was summer, there was no source black carbon
from heating systems. This measurements show that B
abs
are low inside buildings with a
max value of about 8Mm
-1
and an average value of 6Mm
-1
( Hamasha 2008). The building
that has the highest level of black carbon is the closest building to very crowded main
street. Crowded main street means a lot of automobiles and a lot of aerosol particles that
could easily travel by air to the nearest building through the opened doors and windows.
Other indoor measurements of black carbon levels were conducting during the period,
20–26 January 2008 inside living rooms of different houses. During the period of
measurements the temperatures were between 0
0
C and 10
0
C. Ventilation in these living
rooms is few minutes during the day, while operation of heaters is about 15 hours. These
measurements indicated that the daily indoor black carbon levels were high with average
value of about 19 μg/m
3
(116Mm
-1
) and max value of about 32 μg/m
3
(196Mm
-1
) (
Hamasha 2010a). The levels of the BC inside houses in winter were higher than that in
summer. The reasons for that are: in summer doors and windows are opened most of the
times which leads to a good ventilation, but in winter they are mostly closed to keep the
warm inside. This means if there are pollutants species inside it stay inside. In addition,
heaters in winter are another big source of pollutant species like black carbon caused by
the incomplete combustion.
Photoacoustic Measurements of Black Carbon Light
Absorption/Scattering Coefficients and Visibility Degradation in Jordan During 2007/2008
99
7. Impacts of serosols on the visibility in Irbid city
Diurnal aerosol visible light absorption and scattering coefficients at the wavelength of 870
nm were obtained using the Photoacoustic Instrument at two sites of Irbid city, urban site
and suburban site. The diurnal absorption and scattering patterns showed a strong
variability from day to day at both site. During most of the study days, the highest
absorption peaks appeared in the early morning, while those of scattering appeared at later
times. The earlier absorption peaks could be attributed to the elevated black carbon
emissions during the heavy traffic hours whereas the later scattering peaks are attributed to
secondary aerosol formed photochemically in the atmosphere. During the sampling period,
the suburban site exhibited on the average a higher aerosol scattering and a lower aerosol
absorption contribution to the total aerosol visible light extinction and a better visibility than
the urban site. The average visibility attributed to aerosol at the urban site dominated by
urban scale and regional scale was 44 km, while that of the suburban site was 115 km (
Hamasha 2010b).
8. References
Andre, Nel, E., Diaz-Sanchez, David and Li, Ning, (2001). The role of particulate
pollutants in pulmonary inflammation and asthma: evidence for the involvement
of organic chemicals and oxidative stress. Current Opinion in Pulmonary Medicine.
7(1), 20-26.
Arnott, W. P., H. Moosmüller, C. F. Rogers, T. Jin, and R. Bruch. (1999). "Photoacoustic
spectrometer for measuring light absorption by aerosols: Instrument description."
Atmospheric Environment 33: 2845-2852.
Arnott, W P, Hamasha, K, Moosmüller, H, Sheridan, P J and Ogren, J A, "Towards aerosol
light absorption measurements with a 7-wavelength Aethalometer: Evaluation
with a photoacoustic instrument and a 3 wavelength nephelometer." Aerosol
Science & Technology 39 (2005) 17-29.
Arrhenius, S., "On the Influence of Carbonic Acid in the Air upon the Temperature of the
Ground," Philos. Mag., 41, 237-276 (1896).
Asi, R.; Anani, F.; Asswaeir, J. “Studying Air Quality in Alhashemeiah Area/Zarqa”. A
report prepared by the royal scientific association for the general institution for the
protection of the environment, Amman, Jordan, 2001.
Borm,PJ., RP. Schins, and C. Alberecht. (2004)."Inhaled particles and lung cance, part B:
Paradigms and Risk Assess. "Int J Cancer;110(1):3-14
Chang, S. G., R. Brodzinsky, L. A. Gundle, and T. Novakov. "Chemical and Catalytic
Properties of elemental carbon", In Particulate Carbon: Atmospheric Life Cycle (G.
T. Wolff, and R. L. Klimsch, Ends.), pp. 159- 181, Plenum, New York, 1982.
Cooper, C.D., and Alley, F.C., (1996). Air Pollution Control: A Design Approach. Sci. Total
Environ. 146/147, 27–34. Boston, MA: PWS Publishers.
Department of Driving and Vehicles Licensing. Amman, Jordan, 2010.
Department of Statistics, Amman, Jordan.
retrieved Dec,8, 2010.
Finlayson-Pitts, B. J. and J. James N. Pitts (2000). Chemistry of the Upper and Lower
Atmosphere, Academic press.
Monitoring, Control and Effects of Air Pollution
100
Gardiner K., M. van Tongeren, and M. Harrington, "Respiratory Health Effects from
Exposure to Carbon Black; Results of the Phase 2 and 3 Cross Sectional Studies in
the European Carbon Black Manufacturing Industry," Occup. Environ Med.
2001;58(8)496-503.
Gillies, J.; Abu-Allabanb, M.; Gertler, A; Lowenthal, D: Jennison, B; Goodrich, A. (2008).
Enhanced PM2.5 Source Apportionment Using Chemical Mass Balance Receptor
Modeling and Scanning Electron Microscopy. JJEES, 1:(1) 1-9.
Gillmour, PS., A. Ziesenis, ER. Morrison, MA. Vickers, EM. Drost, I. Ford, E. Karg, C.
Mossa, A. Schroeppel, GA. Ferron, J. Hayder, M. Greaves, W. MacNee, and K.
Donaldson, "Pulmonary and Systematic Effects of Short-Term Inhilation
Exposure to Ultrafine Carbon Black Particles," Toxicol Appl. Pharmacol. 2004
:195(1): 35-44
Hamasha, K. M., (2008), “Measurements of black carbon levels using photoacoustic
technique inside different buildings at Yarmouk University/ Jordan”, Jordan
Journal of Physics, Vol. 1 No. 2, pp 1- 8.
Hamasha, K. M. and W. P., Arnott, ( 2009), “Photoacoustic measurements of carbon light
absorption coefficients in Irbid city, Jordan, Environ. Monit. Assess, Doi
10.1007/s10661-009-1017-3
Hamasha, K. M., M. S. Almomani, M. Abu-Allaban and W.P.Arnott (2010) “Study of black
carbon levels in city centers and industrial centers in Jordan”, Jordan Jornal of
Physics,volume3,No1, pp1-8.
Hamasha, K. M., (2010a), “Black carbon indoor air pollution from space heating in
winter”, Abhath al-Yarmouk Basic Sciences and Engineering, Vol. 19 No. 2, pp
47 – 53.
Hamasha, K. M., (2010b), “Visibility Degradation and light Scattering/Absorption Due to
Aerosol Particles in Urban/Suburban Atmosphere of Irbid, Jordan”, Jordan Journal
of Physics, Vol. 3 No. 2
Hamdi, M. R., Bdour A.; Tarawneh, Z. (2008). Diesel Quality in Jordan: Impacts of
Vehicular and Industrial Emissions on Urban Air Quality.
Harber, P., H. Muranko, S. Solis, A. Torossian, and B. Merz. (2003). "Effect of carbon black
exposure on respiratory function and symptoms." J Occup Environ Med;45(2):144-
155.
Horvath, H. (1993). "Atmospheric Light Absorption-A Review." Atmospheric Environment
27A: 293-317.
Horvath, H., "Size Segregated Light Absorption Coefficient of the Atmospheric Aerosol,"
Atmos. Environ., 29, 875-883 (1995).
Horvath, H. (1997). "Comparison of the light absorption coefficient and carbon measures for
remote aerosols: An independent analysis of data from the improve network I and
II: Discussion." Atmospheric Environment 13: 2885-2887.
IPCC, Intergovernmental Panel on Climate Change, Contribution of Working Group I to the
Second Assessment Report (J.T. Houghton, L. G. Meira Filho, B. A. Callender, N.
Harris, A. Kattenberg, and K. Maskell, Eds), Climate Change 1995: The Science of
Climate Change, Cambridge Univ. Press, Cambridge, UK, 1996.
Photoacoustic Measurements of Black Carbon Light
Absorption/Scattering Coefficients and Visibility Degradation in Jordan During 2007/2008
101
Kassel, R., (2003). Dump Dirty Diesel: The health and Air Quality Benefits of Cleaner Diesel
Engines. Diesel Retrofit Workshop, Oct 21.
Kirchstetter, T.W., Novakov, T. And Hobbs, P.V. (2004), Evidence that the spectral
dependence of light absorption by aerosols is affected by organic carbon. J.
Geophysics. Res. 109(D21):D21208. doi:10.1029/2004JD004999.
Künzli, N., R. Kaiser, S. Medina, M. Studnicka, O. Chanel, P. Filliger, M. Herry,F. Horak, V.
Puybonnieux-Texier, P. Quénel, J. Schneider, R. Seethaler, JC.Vergnaud, and H.
Sommer, (2000). Public-health impact of outdoor and trafficrelated air pollution: a
European assessment. The Lancet. 356(9232), 795-801.
Lewis, K., W.P. Arnott, H. Moosmüller, and E. Wold (2008) "Strong spectral variation of
biomass smoke light absorption and single scattering albedo observed with a novel
dual-wavelength photoacoustic instrument." Journal of Geophysical research, 113,
D16203, doi:10.10292007JD009699.
Lindberg, J. D., Douglass, R. E., and Garvey, D. M. (1993). Carbon and the optical properties
of the atmospheric dust. Applied Optics, 32, 6077-6081.
Liousse, C., Cachier, H., and Jennings, S. G. (1993). Optical and thermal measurements of
black carbon aerosol content in different environments: Variation of the specific
attenuation cross section, sigma (
σ). Atmospheric Environment, 27A, 1203-1211.
Liu, L., and M. H. Smith. "Urban and Rural Aerosol Particle Optical Properties," Atmos.
Environ. , 29, 3293-3301 (1995).
Parent ME, J. Siemiatycki, and L. Fritschi, " Workplace Exposures and Oesophagealcancer,"
Occup Environ Med 2000; 57:325-34
Pope, C.A., Thun, M.J., Namboodira, M., Dockery, D.W., Evans, J.S., Speizer, F.E., Health Jr.,
C.W., 1995. Particulate air pollution as a predictor of mortality in a prospective
study of US adults. American Journal of Respiratory Critical Care Medicine 151,
669–674.
Pope, C.A., Burnett, R.T., Thun, M.J., Calle, E.E., Krewski, D., Ito, K., and Thurston, G.D.
(2002): Lung Cancer, Cardiopulmonary Mortality, and Long-term Exposure to Fine
Particulate Air Pollution. Journal of American Medical Association, Vol 287, No. 9,
1132-1141.
Puntoni,R., M. Ceppi, V.Gennaro, D. Ugolini, M. Puntoni, G. La Manna, C. Casella, and D.
Merlo. (2004). "Occupational exposure to carbon black and risk cancer." Cancer
Causes Control; 15(5):511-6
Rosen, H., Hansen, A. D. A., Gundel, and Novakov, T. (1978). Identification of the optically
absorbing component in urban aerosols. Applied Optics, 17, 3859-3861.
Sanjay Rajagopalan; Ohio State University (2008, July 29). Exposure To Bad Air Raises Blood
Pressure, Study Shows. ScienceDaily. Retrieved October 9, 2008, from
/releases/2008/07/.htm
Takano H., Yanagisawa R, Ichinose T, Sadakane K, Yoshino S, Yoshikawa T, ( 2002
.( Diesel
exhaust particles enhance lung injury related to bacterial endotoxin through
expression of proinflammatory cytokines, chemokines, and intercellular adhesion
molecule-1. Am J Respir Crit Care Med. 165(9),1329–1335
.
Walker, P. L., "Chemistry and physics of carbon". vol. 2, Marcel Dekker Inc., NewYork, USA
(1966)
Monitoring, Control and Effects of Air Pollution
102
WHO, Indoor air pollution,
URL, Dec 8th 2010.
8
PM
2.5
Source Apportionment Applying Material
Balance and Receptor Models in the MAMC
V. Mugica
1
, R. Vallesa
1
, J. Aguilar
1
, J. Figueroa
1
and F. Mugica
2
1
Universidad Autónoma Metropolitana-Azcapotzalco,
2
Universidat Politècnica de Catalunya,
1
Mexico
2
Spain
1. Introduction
The expansion of urban areas and their surroundings suburbs has been increased in the last
decades. Many of these cities, particularly in the developing world, experience an
uncontrolled growth and face unprecedented severe air quality problems, due to the high
demand of energy, industrial activity and transportation (Molina et al., 2010). Policy makers
have the challenge to plan and govern, having as one of their priorities the reduction of air
pollution with the aim to protect the health’s population, providing at the same time
infrastructure and services.
Air quality models or source models are important tools in the environmental assessment
since they estimate receptor concentrations from source emissions and meteorological
measurements. One
of the problems when dispersion models application is considered is
that they use estimates of pollutant emissions rates and often rely on meteorological
measurements from distant airports and emission rate estimates which stand little
resemblance to those applicable to the area under study. As a result of this lack of data,
dispersion models cannot be applied in many places or their results have large
uncertainties.
On the other hand, receptor models include a range of multivariate analysis methods that
use ambient air measurements to infer the source types, locations, and contributions that
affect ambient pollutant concentrations. Receptor models use the environmental
concentration of the studied pollutants, as well as the composition of the chemical
compounds emitted by the different sources to determine the source apportionment
(Watson et. al., 2002a). These models are used also to evaluate the efficiency of specific
control strategies associated with local programs to improve the air quality and also to
estimate the emission inventory uncertainty, since they correlate the pollutants with their
sources of emission. This article presents the importance to determine the main sources of
PM
2.5
through the use of receptor models. As a case study, the Principal Component
Analysis (PCA), the UNMIX and the Chemical Mass Balance (CMB) models were applied
for the source reconciliation of PM
2.5
in the Metropolitan Area of Mexico City (MAMC). The
results obtained by the three models are compared and discussed showing the advantages
of the different models.
Monitoring, Control and Effects of Air Pollution
104
2. Airborne particles
Suspended particles in the atmosphere can be originated from natural sources, such as
wind-driven erosion dust, sea spray, and volcanoes, or from anthropogenic activities such
as combustion of fuels (by vehicles, food cooking, wood burning or industries). Airborne
PM is composed of inorganic salts, organic material, crustal elements and trace metals and
possess a range of morphological, physical, chemical and thermodynamic properties.
Airborne particles can change in the atmosphere in size and/or composition through
condensation of vapor species or by evaporation, by coagulating with other particles, by
chemical reaction, or by activation in the presence of supersaturated water vapor to
become cloud and fog droplets (Raes et al., 2000). When particles are emitted directly they
are known as primary aerosols, but if particles are formed in the atmosphere as a
consequence of physical or chemical interactions among gases, particles and/or water
vapor they are called secondary aerosols. Many organic secondary aerosols are formed in
the atmosphere by incomplete combustion or by photochemical reactions. The most
common inorganic secondary aerosols are the ammonium nitrate and sulfate originated
by the reactions among dissolved sulfuric and nitric acids (formed also in the atmosphere
by the reaction between water and sulfur oxides and nitrogen oxides respectively, with
ammonia gas).
An important characteristic of atmospheric particles is their size distribution, as it strongly
affects particle behaviour, may determine their fate in atmospheric systems as well as their
deposition in the human respiratory tract, and determines the equipment to be used for
sampling. As atmospheric particles are not spherical and have a range of densities, the
aerodynamic diameter (diameter of a spherical particle with an equal gravitational settling
velocity but a material density diameter of 1 gcm
-3
) is used to define their size (Mugica &
Ortiz, 2006). With this in mind, PM
10
, PM
2.5
and PM
1
refer to particles with aerodynamic
diameter less or equal to 10 μm, 2.5 μm or 1 μm respectively. They are known also as
respirable, fine and ultrafine particles, respectively.
Crustal species from mineral dust, such as Si, Fe, Al, Ca, K, and Mg, are often present in
large quantities in the coarse fraction of PM (particles with aerodynamic diameter larger
than 2.5 μm but smaller than 10μm). Usually organic aerosols can account for 50% or more
of the fine PM, and inorganic secondary aerosols are an important fraction of fine particles.
2.1 Health adverse effects of PM
It has been well established that exposure to PM can cause cardiovascular and respiratory
problems, and inclusive increase the premature mortality. For that reason the improvement
of human health is the priority objective of air quality programs (McKinley, 2003). Fine and
ultrafine particles are poorly captured by the lung macrophages and are able to introduce
into the epithelia and the interstitial tissue. Then, the possibility of natural cleaning of lungs
is diminished, with an increasing of lung toxicity (Schwartz et. al., 1996). It was observed
also, than mortality rate is higher in polluted cities, associating the pollution by fine particles
with lung cancer (Dockery et. al., 1993; Maynard & Maynard, 2002), as well as with cardiac
and respiratory illness (Samet el al., 2000).Pope et al. (2002) reported tan an increase of 10
µgm
-3
in the average concentrations of PM
2.5
implicates the increase of lung cancer and
cardiorespiratory risk diseases in 8 and 6% respectively.
PM
2.5
Source Apportionment Applying Material Balance and Receptor Models in the MAMC
105
The precise chemical and physical properties and toxicological mechanisms by which PM
causes adverse health effects are still uncertain. Significant differences exist in the
chemical composition and size distribution of PM based on the wide range of sources,
meteorological conditions, atmospheric chemistry, diurnal and seasonal factors. PM
aerodynamic size is a relevant element when studying PM toxicity due to its variable
ability to penetrate the respiratory system; fine particles can reach the deep regions of the
lungs, whereas coarse PM may be deposited early within the nasal-pharyngeal passages
of the airways. Fine PM potentially may owe the type and intensity of the toxic response
to organic compounds, metals and other reactive chemical compounds, since several of
those species can promote oxidative stress through the generation of reactive oxygen
species (ROS) (Tao et al, 2003; De Vizcaya et al., 2006). ROS can also damage cellular
proteins, lipid, membranes, and DNA and PM exposure is also linked to inflammation
through the generation of ROS, particularly those PM derived from combustion of fossil
fuels (Nel, 2005).
2.2 Adverse effects of PM in the environment
Fine particles and some pollutant gases scatter and absorb light reducing the visibility and
generating a haze that has negative effects on the visibility. Visibility can be defined as the
maximum distance at which the outline of the farthest target can be recognized against a
horizon background (Horvath, 1981). Although absorbing particles remove light
transmitted from the target and make it appear darker, they do not scatter much light into
the sight path, and they generally have a lower effect on contrast reduction than light-
scattering particles. The particles that are most efficient at scattering light are roughly the
same size as the wavelength of visible light (about 0.5 μm) (Horvath, 1981).The correlation
between fine and ultrafine particles with the decreasing of visibility has been measured in
some studies showing that those PM are responsible of the light scattering. (Watson,
2002b).
Other effects of PM and pollutants have been found in materials, damage forests and crops,
ecosystems, due to the abrasion, deposition, direct and indirect chemical attack and
electrochemical corrosion (Davis & Cornwell, 1998). In addition, visible haze change the
earth’s radiation balance
3. Receptor models
Receptor models infer contributions from different source types using multivariate
measurements taken at one or more receptor locations. Receptor models use ambient
concentrations and the abundances of chemical components in source emissions to quantify
source contributions. They are based on the same scientific principles as source models, but
they are explanatory rather than predictive of source contributions. (Watson et al,
2002a).While source models need spatial and temporal resolution and accurate emissions
rates, receptor models need only a seasonal or annual average, area wide inventory to
identify potential source categories. Contributions are quantified from chemically distinct
source-types rather than from individual emitters. Sources with similar chemical and
physical properties cannot be distinguished from each other (e.g., it is quite difficult to
differentiate the diesel exhaust emissions of heavy, cars, trucks, stationary generators and
Monitoring, Control and Effects of Air Pollution
106
engines or off-road equipment, thus they can be grouped in one diesel exhaust category).
Nevertheless, with appropriate chemical analysis of organic and inorganic compounds of
detailed profiles, more chemical markers from sources could be detected and the separation
in sub-categories become possible.
Receptor models are based on the chemical mass balance equation and the main
assumption is that composition of PM remains constant and chemical species do not react
with each other. The source apportionment is accomplished by solving the mass balance
equations expressing the measured ambient elemental concentrations as the sum of
products between the source contributions and the elemental abundances in the source
emissions, e.g. the source profiles. There are different receptor models which differ in the
mathematical approaches that they have to solve the mass balance equations, as well as in
the different degrees of knowledge about source profiles they need for source
apportionment analysis. Receptor models are not statistics methods, and maybe the
misunderstanding partially arises to the fact that much of the receptor modeling
mathematics is also used to determine and test statistical associations in other scientific
fields (Watson & Chow, 2004).
Among the receptor models, Multiple Linear Regression have been widely used from
more than three decades due to they have the advantage to be implemented by many
statistical packages; identification of markers is required. The application of Enrichment
factor is one of the first methods used to identify presence or absence of anthropogenic
sources or processes responsible of the different atmospheric chemical species. Sometimes
the reference geological material could be different to the sampling site. Multivariate
models based in eigenvector analysis but using different normalization and rotation
schemes have also been applied the last two decades; the most important are: Principal
component analysis (PCA), Empirical orthogonal functions (EOF) and Factor Analysis
(FA).The Positive Matrix Factorization (PMF) model was developed by Paatero & Tapper
(1993) as a new approach to factor analysis, where the principal components explaining
the variance of the speciated data are extracted and then interpreted as possible sources.
The CMB model has been widely used to determine source contribution estimates for
PM
10
and PM
2.5
. This model calculates the source contributions by determining the best
combination of source profiles needed to simulate the chemical composition of the
ambient data. The model is able to estimate the source reconciliation for every day. Table
1 shows most of the common receptor models used in air quality studies to develop
pollution control strategies.
Watson and Chow (2004) specify the following qualities which are desirable in any data
base of source and receptor measurements: 1) a full range of chemical species in specified
size fractions (for solid-phase pollutants); 2) specification of operating parameters (for
source measurements), locations and sampling periods (for source and receptor
measurements);3) documentation of sampling and analysis methods; 4) results of quality
control activities and quality audits; 5) precision and accuracy estimates for each
measurement; 6) data validation summaries and flags; and 7) availability in well-
documented computerized formats.
Source and receptor models are complementary rather than competitive. Each has strengths
and weaknesses that compensate for the other. Both types of models can and should be used
in an air quality source assessment on outdoor and indoor air.
PM
2.5
Source Apportionment Applying Material Balance and Receptor Models in the MAMC
107
Receptor Model Description
Enrichment Factors
(EF)
The ratios of atmospheric concentrations of elements to a reference
element are compared to the same ratios in geological or marine
material. Differences are explained in terms of anthropogenic sources.
It is more useful for identification of anthropogenic processes than for
quantification.
Multiple linear
regression (MLR)
Mass of chemical compounds is expressed as the linear sum of
regression coefficients. The regression coefficients represent the inverse
of the chemical abundance of the marker species in the source
emissions. They can easy implemented in statistic packages, but limited
to sources with marker species. The product of the regression
coefficient and the marker concentration for a specific sample is the
tracer solution to the mass balance that yields the source
apportionment. Requires large data set.
Eigenvector
multivariate models:
Principal component
analysis(PCA),
Empirical orthogonal
functions (EOF), Factor
Analysis (FA)
Temporal correlations are calculated from a time series of chemical
concentrations at one or more locations. These are eigenvector analysis
multivariate models which can confirm and identify unrecognized
source types. Eigenvectors of this correlation matrix are determined
and a subset is rotated to maximize and minimize correlations of each
factor with each measured species. The factors are interpreted as source
profiles by comparison of factor loadings with source measurements.
Source profiles from direct measurements are needed to interpret these
eigenvectors. Easy implementation in statistic packages, but limited to
sources with marker species. Requires large data set.
UNMIX
Form of Factor
Analysis
The UNMIX model “unmixes” the concentrations of chemical species
measured in the ambient air to identify the contributing sources.
Chemical profiles of the sources are not required, but instead are
generated internally from the ambient data by UNMIX, using a
mathematical formulation based on a form of factor analysis. UNMIX
uses “edge detection” in a multidimensional space. The edges represent
the samples that characterize the source. It can be run feasibly and
easily on some statistical software. Requires large data set.
Positive Matrix
Factorization [PMF]
The PMF technique is a form of factor analysis where the underlying
co-variability of many variables is described by a smaller set of factors
(PM sources) to which the original variables are related. The PMF
assumption is that the concentration of specie in a site can be explained
by the source matrix and contribution matrix. Both matrixes are
obtained by an iterative minimization algorithm. A restriction of no-
negativity ensures positive abundances and contributions. The main
problem with PCA is that it does not provide a unique solution.
ChemicalMass Balance
(CMB)
Ambient chemical concentrations are expressed as the sum of products
of species abundances and source contributions and the equations are
solved for the source contributions. Ambient concentrations and source
profiles are supplied as input.The chemical characterization of the
possible emission sources together with an estimation of the
uncertainties for the species concentrations, are used as input for the
CMB model. The main drawback of this model is that the accuracy of
the source apportionment depends on the representativeness of the
selected sources for the emission types in the area.
Table 1. Most used Receptor Models in Air Quality Studies
Monitoring, Control and Effects of Air Pollution
108
4. Sampling and chemical analysis
The Metropolitan Area of Mexico City (MAMC) is located in an elevated basin surrounded
by mountains which do not favour the dispersion of air pollutants, especially during the
cold season when frequent thermic inversions are present. The MAMC megacity has nearly
20 million inhabitants, more than 4 million of vehicles and around 35,000 industries. A total
of 132 aerosol samples were collected from January 2002 to December 2003, every six days,
at the Azcapotzalco Campus of the Metropolitan University, located in an industrial-
residential area in the Northern. In addition, other three sites studied in previous campaigns
(Chow et al, 2002) were sampled in March 2003 during ten days in order to determine the
spatial variation. These sites were: 1) La Merced, located in the downtown with high
commercial activity and high traffic activity; 2) Xalostoc, located at the Northeast is an
industrial district surrounded for very important avenues with heavy traffic, and 3)
Pedregal, is a residential neighborhood located at the Southwest.
Samples were collected onto Teflon and quartz 47 mm filters using PM
10
and PM
2.5
Minivol samplers (Airmetrics, Eugene, OR). Teflon-membrane filters (Gelman Scientific,
Ann Arbor, MI) with 2 mm pore size collected samples for mass and subsequent
elemental analysis, whereas precalcinated Quartz fiber filters (Pallflex, Products
Corp.,Putnam, CT) collected samples for water-soluble anions (Cl
-
, NO
3
-
, SO
4
2-
) and
cations (Na
+
, K
+
, NH
4
+
), organic carbon and elemental carbon analyses. Filters were
equilibrated for two weeks in a relative humidity (25–35%) and temperature (20±0.5°C)
controlled environment before gravimetric analysis to minimize particle volatilization.
Filters were weighed before and after sampling with a Mettler Toledo (MT-5)
microbalance. The balance sensitivity is 0.001 mg. Subsequently, the filters were stored in
a freezer until aerosol sampling and chemical analyses. Quartz filters were split into two
using plastic scissors: the first part was for ion analysis and the second one for the
quantification of organic and elemental carbon.
Soluble ions were extracted ultrasonically (Branson bath, USA) with Milli-Q deionized
water during 20 min. Sulfate (SO
4
2-
), water-soluble ammonium (NH
4
+
), nitrate (NO
3
-
), water-
soluble sodium (Na
+
), and potassium (K
+
), were quantified by ion chromatography, with a
Perkin Elmer-Alltech 550 instrument fitted with a conductivity detector), using specific
anion and cation Alltech columns. Organic and elemental carbon was determined by an
automated thermal-optical transmittance (TOT) carbon analyzer, Sunset Lab, USA, using
method 5040 (NIOSH protocol) (Birch and Cary, 1996).
Inductively Coupled Plasma-Atomic Emission Spectrometry, ICP-AES, from Atom
Advantage Thermo Jarrel Ash, was used to analyze the elemental components of the PM
collected on the teflon filters. Filters were digested in a microwave oven (OI-Analytical,
USA) using high-pressure Teflon digestion vessels with 2 ml of HF, 1 ml HCl and 2 ml
HNO
3
(67%). The average filter blank value was used as a background subtraction for each
sampled filter. 20 mg extractions of a well-characterized urban dust (SRM 1649a standard
reference material NIST), field samples and filter blanks were handled and analyzed under
the same procedure as filters with air samples. Quality audits of the sample flow rates were
conducted each week of the study period. Data were submitted to three levels of data
validation (Watson et al., 2002a.), so intercomparison and performance tests were carried
out between CICATA-Altamira and UAM-Azcapotzalco. For the purposes of calculating
weight fractions, elements were normalized for oxygenated species as described by Mc
Donald (2000).
PM
2.5
Source Apportionment Applying Material Balance and Receptor Models in the MAMC
109
5. Mass of PM
2.5
Table 2 shows the basic statistic of the total mass of PM
2.5
in the four sampling sites.
Traditionally (GDF, 2008), Xalostoc is the most polluted site due to the high industrial and
vehicular activities. Winds use to blow from Northeast to Southwest, and although Pedregal
is the less polluted place by PM, usually exceed the ozone standard.
Site N Mean Max Min
Azcapotzalco (N)
132
Two whole years
2002-2003
56.9±13.9 93.1 34.5
Merced (Center)
10
March 2003
58.1±19.3 74.2 39.6
Pedregal (Southwest)
10
March 2003
26.8±11.7 47.2 21.6
Xalostoc (Northeast)
10
March 2003
69.2±23.4 105.7 47.2
Table 2. Levels of PM
2.5
in the MAMC
For CMB model application is necessary to select fitting species, as well as the adequate
sources profiles, thus, in this study the strategy was to use the Factor Analysis Models
(PCA) and UNMIX to identify the main emission sources and marker elements, and
subsequently apply the CMB model with speciated source profiles for a more robust source
apportionment.
6. Factor analysis: principal component analysis
PCA model belongs to the category of factor analysis (FA) techniques, i.e. it is a multivariate
method used to study the correlations among the measured elemental concentrations at the
receptor. With this method, the principal components explaining the variance of the
chemical species data, and then they interpreted as possible sources. Assuming a linear
relationship between the total mass concentration and the contributions of each specie, PCA
factors the data in several steps. First, the chemical composition data are transformed into a
dimensionless standardized form
−
=
Cij Cj
Zij
j
σ
(1)
where i=1, …, n samples; j=1, …, m elements; Cij is the concentration of element j in sample
i; and Cj and
σ
j are the arithmetic mean concentration and the standard deviation for
element j, respectively. The PCA model is expressed as:
1=
=
∑
p
k
Zi
jg
ik hk
j
(2)
where k=1,p sources, and gik and hkj are the factor loadings and the factor scores,
respectively. This equation is solved by eigenvector decomposition. Varimax rotation is
Monitoring, Control and Effects of Air Pollution
110
often used to redistribute the variance and provide a more interpretable structure to the
factors. PCA not provide a unique solution mainly because of its simple approach to factor
analysis. Despite this drawback, known as rotational ambiguity, PCA has been applied as a
tool for source apportionment in many air quality studies (Karar and Gupta, 2007).
With the chemical data obtained from the chemical analysis of samples, a data base was
prepared for the PCA. The ambient data were normalized with media=0 and standard
deviation = 1, to reduce the excessive influence of the species with mass. The statistic
software SPSS v.12 for windows was used to obtain the number of factors, the mass matrix
and the Varimax Rotation. The selection of chemical species was performed to get the better
fittings. Maatlab 6.5 package was used to execute the matrix operations. Matlab estimated
the not scaled contributions for further lineal regression to convert them in mass unities.
Finally the mass balance matrix was cleared to determine the profiles. Model performance
was evaluated with the mass percentage and the linear regression coefficient R
2
.
PCA resulted to be very useful to determine the potentially contribution of source types,
including those with small data set (as was de case of Merced, Pedregal and Xalostoc with
only ten samples). The fitting species were: sulfate, ammonium, organic carbon, elemental
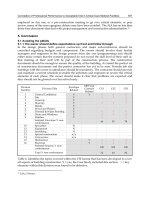
carbon, aluminum, silicon, sulfur, calcium, and iron. Table 3 shows the factor loadings
normalized with the VARIMAX rotation, which maximizes the variances of the squared
normalized factor loadings across variables for each factor, thus making the interpretation
easier. The final solution of PCA reported three values higher than 1, suggesting three main
factors (sources) in the four sites: Vehicular, soil and secondary aerosols. These three sources
accumulated more than the 90% of the system variance.
The markers related to the first factor associated with “soil” that explained 34% of variance
were Al, Si, Ca, and Fe, which are crustal elements. The markers associated to the second
factor “secondary aerosols” are SO
4
2-
and NH
4
+
related with ammonium sulfate, a secondary
aerosol which can be formed in the atmosphere. The third factor “vehicular”, is mainly
represented by organic and elemental carbon.
Rotated Component Matrix*
Component
Soil Sec Aerosols Vehicle
SO4
0.005 0.994 0.042
NH4
-0.123 0.963 0.190
OC
0.412 0.197 0.830
EC
-0.004 0.067 0.964
AL
0.982 -0.094 0.065
SI
0.988 -0.048 0.101
SU
0.000 0.990 0.055
CA
0.984 0.008 0.089
FE
0.964 -0.012 0.173
% Total Variance
34.210 28.541 27.453
% AccumulatedVariance
34.210 62.750 90.204
Extraction Method: Principal Component Analysis.
Rotation Method: Varimax with Kaiser Normalization.
* Rotation converged in 4 iterations.
Table 3. PCA final solution in Azcapotzalco site