Monitoring Control and Effects of Air Pollution Part 7 pdf
Bạn đang xem bản rút gọn của tài liệu. Xem và tải ngay bản đầy đủ của tài liệu tại đây (3.33 MB, 20 trang )
PM
2.5
Source Apportionment Applying Material Balance and Receptor Models in the MAMC
111
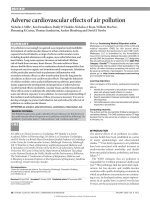
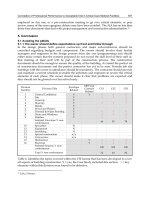
Figure 1 shows graphically the apportionment of PM
2.5
considering the three sources
mentioned above, obtained with PCA for the different sites. In all cases the most important
contributor to PM
2.5
was the mobile sources with more than 45% of the total mass, followed
by secondary aerosols. Pedregal had the lowest contribution of soil. It is important to
highlight that the results from Merced, Pedregal and Xalostoc represent only the
apportionment of PM measured in March 2003 that is part of the warm dry season in the
MAMC, whereas the measurements in Azcapotzalco were carried out during two years, so
these results are the average of measurements done in the dry and rainy seasons.
0%
10%
20%
30%
40%
50%
60%
70%
80%
90%
100%
SOIL
VEHICLES
AEROSOLS
Fig. 1. Source apportionment results from PCA at the four sites
7. UNMIX model
The UNMIX model is a refined multivariate receptor model that uses a new transformation
method based on the self-modeling curve resolution technique toderive meaningful factors.
UNMIX incorporates user-specified non-negativity constraints and edge-finding algorithms
to derive a physically reasonable apportionment of source contributions (Henry, 2001; Poirot
et al., 2001). The edges are constant ratios among chemical components that are detected in
multi-dimensional space. The edges detected by this model are translated into source profile
abundances.This model does not require a previous knowledge about emission sources,
although it is necessary a big number of measurements to estimate the different factors, as
well as the magnitude of their contributions (Chen et al., 2002; Hellén et al. 2003). UNMIX
try to solve the problem of the chemical species mixture with the assumption that the data of
each sample has a lineal combination of an unknown number of sources which contributes
with an unknown mass concentration to the total mass. Another assumption is that all
values are positive (> 0).
UNMIX uses the singular value decomposition (SVD) method to estimate the source
number by reducing the dimensionality of data space m to p (Henry, 2001). The UNMIX
model can be expressed as
11
==
⎛⎞
⎜⎟
=+
⎜⎟
⎝⎠
∑∑
pp
ik
Ci
j
Uik Dkl Vl
j
i
j
ε
(3)
Monitoring, Control and Effects of Air Pollution
112
Where U, D, and V are n×p, p×pdiagonal, and p×mmatrices, respectively; and εij is the error
term consisting of all the variability in Cij not accounted for by the first p principal
components.
Geometrical concepts of self-modeling curve resolution are used to ensure that the results
obey (to within error) the nonnegative constraints on source compositions and
contributions.The data are then projected to a plane perpendicular to the first axis of p-
dimensional space. The edges represent the samples that characterize the source. Such edges
in point sets are then used to calculate the vertices, which are used with the matrices
decomposed by SVD to obtain the source profiles and contributions. The stand-alone EPA
UNMIX version 5.0 was used in this study. For a given selection of species, UNMIX
estimates the number of sources, the source compositions, and source contributions to each
sample.
UNMIX has been applied to several studies for source apportionment of particulate matter
(Chen et al., 2002; Song et al. 2006). One of the first applications was performed by Lewis et
al. (2003) in a three years data set in Phoenix, Arizona. The model estimated the source
profiles for five source categories (gasoline-vehicles, diesel-vehicles, secondary sulfates, soil
and wood burning), and the results were consistent with other study that applied the PMF
model. Maykut et al. (2003) compared CMB, PMF and UNMIX in Seattle to determine the
PM
2.5
sources with the coincidence of three sources: wood burning, mobile sources and
secondary aerosols. Larsen y Baker (2003) applied UNMIX and PMF models to determine
the origin of polycyclic aromatic hydrocarbons in Baltimore.
When UNMIX model was applied to the MAMC samples, the same three sources obtained
in the PCA were clearly identified. Table 4 shows the output of the model for Azcapotzalco
site, where not only the total mass contributions are displayed, but also the contribution of
the most abundant species to the total mass of PM
2.5
.
Table 4. Output of UNMIX model for Azcapotzalco site.
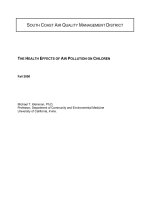
Figure 2 shows the contribution of the three mentioned sources to the total mass of PM
2.5
at
the three sites. It is possible to appreciate some difference of the apportionment yield by
PCA. UNMIX apportioned a higher quantity due to mobile sources than PCA.
PM
2.5
Source Apportionment Applying Material Balance and Receptor Models in the MAMC
113
0%
10%
20%
30%
40%
50%
60%
70%
80%
90%
100%
SOIL
VEHICLES
AEROSOLS
Fig. 2. Source apportionment results from UNMIX at the four sites
8. Chemical Mass Balance receptor model (CMB)
The CMB model is similar to a tracer model, in which a specific compound, that is
associated with a particular type of source, is used to identify and quantify the contributions
of each source. The model uses the complete model of chemical emissions of a category of
specific source to determine its contribution. For the application of the CMB model is
necessary to have the databases of the ambient and the source emission profiles. The first
one is obtained by collecting samples of ambient air at different locations with the purpose
of obtaining information of the population that is investigated. When taking the samples it is
expected that they are representative and reflect the properties of the site. On the other
hand, source profiles are obtained directly inside the source or as near as possible. The
quality of the data will depend on the number of taken samples, used devices, the place and
time of the sampling. Equation 4 is the fundamental base of the receptor model, this
expresses the relationship between the concentrations of the chemical species measured in
the receptor with those emitted in the source.
1=
=⋅
∑
p
j
Ci Fij Sj (4)
Where
Ci = Ambient concentration of the species “i” measured in the receptor site
p = Number of sources that contribute j = 1, 2, j
Fij = Fraction of the emissions of the species “i” starting from the source “j”
Sj = Impact to the receptor (calculated contribution) of the source “j”
These equations are solved for the source contributions. Several different solution methods
have been applied, but the effective variance least squares estimation method is most
commonly used because it incorporates precision estimates for all of the input data into the
solution and propagates these errors to the model outputs
The CMB model provided values for several performance measures to evaluate the solution.
These measured values included chi-square, the weighted sum of the squared differences
between calculated and measured fitting species concentrations divided by the effective
Monitoring, Control and Effects of Air Pollution
114
variance and degrees of freedom (ideally chi-square would be zero, but values up to 4 are
acceptable). R
2
is the fraction of the variance in the receptor concentrations. R
2
ranges from 0
to 1, when R
2
is less than 0.8 the source contribution estimated did not explain the
observations clearly with the fitting source profiles. The calculated mass should be in the
range of 100 ± 20 (Watson et al., 1991).
The chemical mass balance model, CMB, which is based upon regression analysis of PM
chemical composition, is the fundamental receptor model to find the most appropriate
combination of source apportionment. This model has been used in other countries (Chow
and Watson, 2002) with the aim to establish control measurements for the main PM
contributors.
In this study, each of the daily ambient concentrations of PM
2.5
and elemental components
were submitted as input to the CMB model (Henry, 1997). The source profiles for fugitive
dust (Vega et al., 2001), food cooking (Mugica et al., 2001) and combustion source profiles
developed for Mexico City (Mugica et al., 2008) were used also as input. The most common
inorganic components were included as fitting species in the CMB model as well as organic
and elemental carbon (OC and EC). In order to account for secondary aerosol contributions
to PM
2.5
, ammonium sulfate, and ammonium nitrate profiles were introduced in the
analysis. Each result was evaluated by using the regression statistical parameters available
for each CMB output.
CMB model could identify six different sources: soil, gasoline vehicles exhaust, diesel
vehicles exhaust, food cooking, ammonium sulfate and ammonium nitrate. This means that
CMB could separate two different types of vehicles (e.g. those which use gasoline and those
that use diesel), as well as the two types of inorganic secondary aerosols. Table 5 displays
the average of the statistical parameters of the model in the PM
2.5
source reconciliation in the
four sites. In general, the parameters of R
2
, Chi
2
and percentage of mass were in the
acceptable interval. The values of R
2
fluctuated between 0.92 and 0.96. Likewise, the values
of Chi
2
were smaller than 4. The percentages of mass calculated when applying the model
varied from 88.1 to 104.5, with an average of 93.5%.
Site R
2
CHi
2
%Mass
Meas. Conc.
[μgm-3]
Calc. Conc.
[μgm-3]
Azcapotzalco 0.95 0.95 95.7 56.92 54.17
Merced 0.96 2.34 94.3 51.25 48.04
Pedregal 0.96 3.49 94.6 26.32 25.74
Xalostoc 0.97 2.86 91.6 68.32 70.74
Table 5. Average statistical parameters of the CMB model applied to PM
2.5
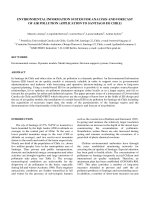
The estimated contributions in μgm
-3
by CMB model vary considerably from one day to
another in every site, although in all the cases the major emission sources were the vehicles
(sum of diesel plus gasoline exhaust) with contributions between 50 and 66%, followed by
aerosols (ammonium sulfate plus ammonium nitrate) and soil (Figure 3).
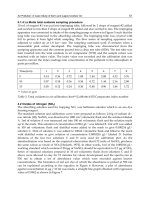
Figure 4 shows the source contribution of the six sources separated by CMB model in some
selected samples of the Azcapotzalco site. In this graphic the separation between gasoline
exhaust (with around 28% of the total of PM
2.5
) and diesel exhaust (with 26%) is visible. The
new source due to food cooking was also identified with contributions up to 10%, and it was
possible to detect that ammonium sulfate concentration is more than four times greater
than ammonium nitrate.
PM
2.5
Source Apportionment Applying Material Balance and Receptor Models in the MAMC
115
0%
10%
20%
30%
40%
50%
60%
70%
80%
90%
100%
SOIL
VEHICLES
AEROSOLS
Fig. 3. Source apportionment from CMB at the four sites.
0
10
20
30
40
50
60
70
80
90
06/01/02
07/02/02
19/03/02
22/04/02
24/05/02
17/06/02
27/07/02
20/08/02
29/09/02
23/10/02
16/11/02
18/12/02
03/01/03
04/02/03
08/03/03
26/04/03
19/05/03
04/06/03
14/07/03
07/08/03
31/08/03
24/09/03
26/10/03
27/11/03
29/12/03
Food Am. Sulfate Am. Nitrate Diesel Gasoline Soil
Mass of PM2.5
Fig. 4. Source apportionment of PM
2.5
(μgm
-3
) in Azcapotzalco
Mann-Whitney U test was used to determine differences among the results obtained for the
three models. The findings showed that the contributions of soil, vehicles and secondary
aerosols estimated by the three models are statistically equivalent, with (p > 0.05). CMB
fully apportions receptor concentrations to chemically distinct source-types depending upon
the source profile database, while UNMIX and PMF internally generate source profiles from
the ambient data.
9. Conclusion
In this paper, the principles of different receptor models were revised and the performances
of CMB, PMF and PCA were evaluated in their application to PM
2.5
samples from different
sites of the MAMC. The use of several types of models helps to identify and quantify model
Monitoring, Control and Effects of Air Pollution
116
inaccuracies and focus further investigation on the areas of greatest uncertainty. PCA and
UNMIX apportioned one single source of mobile sources, but the CMB model was able to
distinguish between the two main sources of mobile sources (gasoline and diesel exhaust) in
the four sites. In addition CMB could separate the two different types of secondary aerosols.
Thus, in this study was demonstrated the capability of CMB model to better apportion on
PM mass. Nevertheless the use of PCA and UNMIX was fundamental to identify the main
sources as well as the marker elements which were further used during the CMB application
as fitting species. The use of three models improve the source reconciliation and allows a
better knowledge of the suspended PM
2.5
in the MAMC.
10. Acknowledgements
The authors wish to express their thanks for the chemical analysis to the Applied Chemistry
laboratories at the Metropolitan University-Azcapotzalco, and CICATA/IPN. V. Mugica
and J. Aguilar gratefully acknowledge the SNI for the distinction of her membership and the
stipend received.
11. References
Chen, L.W.A., Doddridge, B.G.; Dickerson, R.R.; Chow, J.C.; Henry, R.C. 2002. Origins of
Fine Aerosol Mass in the Baltimore–Washington Corridor: Implications From
Observation, Factor Analysis, and Ensemble Air Parcel Back Trajectories; Atmos.
Environ. 36, 4541-4554.
Chow, J.C., Watson, J.G., 2002. Review of PM
2.5
and PM
10
apportionment for fossil fuel
combustion and other sources by the chemical mass balance receptor model.
Energy& Fuels 16, 222–260.
Davis ML, Cornwell DA. 1998. Introduction to environmental engineering. McGrawHill,
Singapore. e in atmospheric aerosols. Atmos. Environment. 38: 1387-1388.
De Vizcaya-Ruiz A., Gutiérrez-Castillo M.E., Uribe-Ramirez M., Cebrián M.E., Mugica-
Alvarez V., Sepúlveda J., Rosas I., Salinas E., Garcia-Cuéllar C.M., Martínez F.,
Alfaro-Moreno E., Torres-Flores V., Osornio-Vargas A., Sioutas C., Fine P.M., Singh
M., Geller M.D., Kuhn T., Eiguren-Fernandez A., Miguel A., Schiestl R., Reliene R.,
Froines J. 2006. Characterization and in vitro biological effects of Concentrated
particulate matter from Mexico City. Atmospheric Environment. 40, 2: 583-592.
Dockery DW, Pope CA III, Xu X, Spengler JD, Ware JH, Fay ME, Ferris Jr BG, Speizer FE.
1993. An association between air pollution and mortality in six US cities. The New
England Journal of Medice 329: 1753-1759.
Hellén H, Hakola H, Laurila T. 2003. Determination of source contribution of NMHC in
Helsinki (60ºN, 25ºE) using chemical mass balance and the UNMIX Multivariate
receptor models. Atmospheric Environment. 37: 1413-1424.
Henry, R.C., Willis, R.D., 1997. Chemical mass balance receptor model version 8 (CMB8)
user´s manual. Prepared for US Environmental Protection Agency, Research
Triangle Park, NC, by Desert Research Institute, Reno, NV.
Henry, R. C. UNMIX Version 2.4 Manual; U.S. Environmental Protection Agency: Research
Triangle Park, NC. 2001.
Karar, K., Gupta, A.K., 2007. Source apportionment of PM10 at residential and industrial
sites of an urban region of Kolkata, India. Atmospheric Research 84, 30–41.
PM
2.5
Source Apportionment Applying Material Balance and Receptor Models in the MAMC
117
Larsen RK III, Baker JE. 2003. Source apportionment of polycyclic aromatic hydrocarbons in
the urban atmosphere: a comparison of three methods. Environ. Sci. Technol. 37:
1873-1881.
Maynard AD, Maynard RL. 2002. A derived association between ambient aerosol surface
area and excess mortality using historic time series data. Atmospheric Environment
36: 5561-5567.
McKinley G., Zuk M, Hojer M, Avalos M, González I, Hernández M, Iniestra R, Laguna I,
Martínez MA, Osnaya P, Reynales LM, Valdés R, Martínez J. 2003. The Local
Benefits of Global Air Pollution Control in Mexico City: Final Report of the Second
Phase of the IntegratedEnvironmentalStrategies Program in Mexico.
IntitutoNacional de Ecología – InstitutoNacional de SaludPública, México.
Maykut NN, Lentas J, Kim E, Larson TV. 2003. Source apportionment of PM
2.5
at an urban
IMPROVE site in Seattle, Washington. Environ. Sci. Technol. 37: 5135-5142.
Mc Donald J., Zielinska B., Fujita E., Sagebiel J., Chow J. and Watson J. (2000). Fine particle
and gaseous emission rates from residential wood combustion. Environ. Sci.
Technol. 34, 2080-2091.
Mugica V., Vega E., Chow J., Reyes E., Sanchez G., Arriaga J., Egami R., Watson J. 2001.
Speciated non-methane organic compounds emissions from food cooking in
Mexico. Atmospheric Environment 35, 1729-1734.
Mugica V. & Ortiz E. 2005. Elemental composition of airborneparticles Analytical techniques
and application in decision-making for air quality management in Applications of
Analytical Chemistry in Environmental Research, 219-261. ISBN: 81-308-0057-8 M.
Palomar (Ed). Research Signpost. 37/661 (2). India.
Mugica V., Mugica F., Torres M., Figueroa J. 2008. PM
2.5
Emission Elemental Composition in
the Metropolitan Area of Mexico City. From diverse Combustion Sources in the
Metropolitan Area of Mexico City. The Scientific World.8: 275-286.
Nel A. 2005. Atmosphere. Air pollution-relatedillness: effects of particles. Science. 308
(5723): 804-6.
Paatero, P.&Tapper, U., 1993. Analysis of different modes of factor analysisas least squares
fit problems. Chemometrics and Intelligent LaboratorySystems 18, 183–194.
Poirot, R.L.; Wishinski, P.R.; Hopke, P.K.; Polissar, A.V. 2001. Comparative Application of
Multiple ReceptorMethods to IdentifyAerosol Sources in Northern Vermont;
Environ. Sci. Technol. 35, 4622-4636.
Pope III C.A., Burnett R.T., Thun M.J., Calle E.E., Krewski D., Ito K., Thurston G.D. 2002
Lung cancer, cardiopulmonarymortality, and long-termexposure to fine particulate
air pollution. JAMA. 287: 1132-41.
Raes F., Van Dingenen R, Vignati E., Wilson J, Putaud JP, Seinfeld JH, Adams P. 2000.
Formation and cycling of aerosols in the global troposphere. Atmos. Environ. 34:
4215-4240.
Song Y., Xie S., Zhang Y., Zeng L. Salmon L., Zheng M. 2006. Source apportionment of PM
2.5
in Beijing using principal component analysis/absolute principal component scores
and UNMIX.The Science of the Total Environment. 15: 372(1):278-86.
Samet JM, Dominici F, Curriero FC, Coursac I, Séller SL. 2000. Fine particle air pollution and
mortality in 20 US cities, 1987-1994. The New England Journal of Medicine 343:
1742-1749.
Monitoring, Control and Effects of Air Pollution
118
Schwartz J, Dockery DW, Neas LM. 1996. Is daily mortality associated specifically with fine
particles? J. Air & Waste Manage. Assoc. 46: 927-939.
Tao F, Gonzalez-Flecha B, Kobzik L. 2003. Reactiveoxygenspecies in pulmonary
inflammation by ambient particulates. Free Radic.Biol. Med. 35:327-40.
Vega E., Mugica V., Reyes E., Sánchez G., Chow J., Watson J. 2001.Chemical Composition of
Fugitive Dust Emitters in Mexico City. Atmos. Environ., 35, 23, pp 4033-4039.
Watson, J., Chow, J., Pace, T., 1991. Chemical mass balance. In: Hopke, P.K.
(Ed.),ReceptorModeling for Air Quality Management. Elsevier Press, New York,
NY,pp. 83–116.
Watson JG, Zhu T, Chow JC, Engelbrecht J, Fujita EM, Wilson WE. 2002a. Receptor
modeling application framework for particle source apportionment. Chemosphere.
49:1093-1136.
Watson J. 2002b. Visibility: Science and regulation. J. Air Waste Manag Assoc. 52 : 628-713.
Watson J. & Chow J. 2004. Receptor Models for Air Quality Management.EM. October:15-24.
Part 3
Air Pollution in Office and
Public Transport Vehicles
9
Emission and Formation of Fine Particles from
Hardcopy Devices: the Cause of Indoor
Air Pollution
David D. Massey
1
* and Ajay Taneja
1,2
1
School of Chemical Sciences, Department of Chemistry, St John’s College,
2
Department of Chemistry, Dr. B.R. Ambedkar University,
India
1. Introduction
The last few decades have seen major changes in the home and work environments. The
economies of the Indian and other industrialized nations have shifted from manufacturing
towards services that engage information technologies. Advances in information technology
have increased the quantity and transformed the nature of equipment used in proximity to
office worker due to which electronic media used for entertainment, telecommunications
and data processing have become widespread in daily life. Typical examples are television
sets, video recorders, hi-fi systems, and computers with their peripherals such as monitors
and printers, scanners and copiers. Tabletop printers serve individual users in their
workspace or home, or clusters of users in an office suite. Scanning machines and
photocopiers are prevalent in office environments (Newburger, 2001). In addition, the use of
notebook computers spanning both work and non work environments is on the rise. These
devices are predominantly made of polymeric components and materials which can contain
not only additives, such as flame retardants and plasticizers (Wensing et al., 2005), but also
chemical residues from production processing aids (Wensing et al., 2002).
There is growing concern about the levels of potentially harmful pollutants that may be
emitted from office equipment and for which either toxicological effects or potentially
significant exposures have been described in the literature. Office equipment has been found
to be a source of ozone, particulate matter, volatile organic compounds (VOCs) and semi
volatile organic compounds (SVOCs). VOC, SVOC and particles can also be emitted by the
paper processed during printing and copying (Wolkoff et al., 1993). Many studies have
investigated the health effects of photocopier toner dust and concluded that siderosilicosis
and sarcoidosis-like pulmonary diseases are associated with human exposure to
photocopier toner dust (Armbruster et al., 1996). Black and Worthan (1999) have described
the VOC/ TVOC, particle and ozone emissions of laser printers, dryprocess photocopiers
and personal computers. Wolkoff (1999) study dealt with photocopiers and indoor air
pollution. Later on Lee et al. (2001) characterized VOC, ozone and PM
10
emissions from
office equipment. Today discussion focuses in particular on particle release from hardcopy
devices, printers and photocopiers and its impact on the health of office workers (Roller,
2006). Recent advances in measurement techniques have enabled researchers to measure the
Monitoring, Control and Effects of Air Pollution
122
ultrafine particles of nanoscale range and have provided evidence that the smaller particles
typically emitted from sources such as internal combustion engines may have more severe
impact on the human respiratory system than the bigger particles (Newburger, 2001).
Ozone and particulate matter have been associated with occupational symptoms such as
eye, nose or throat irritation, headache and fatigue (Wolkoff et al., 2006). The results of He et
al., (2007) suggested that there is potential harm to human beings because of breathed in
toner particles. A recent study by Gatti, 2008 using in-vitro and in-vivo experiments with 5
types of nanoparticles found chemical evidence of particulate matter in human pathological
tissues from patients who had suffered diseases of unknown origin. It was pointed out in
this study that inhaled and ingested nanoparticles can penetrate through the alveolar as well
as the digestive walls to enter the blood system and subsequently be transported to any
organ in the body. Only about 20% of nanoparticles are removed once deposited in alveolar
regions in animal subjects after 24 hour exposure, in contrast to about 80% removal for
particles above 500 nm (Oberdörster et al., 2005). In related work, Chalupa et al., (2004)
found about 74% deposition of carbon ultrafine particles in asthmatic human subjects for a 2
hour exposure.
With possible adverse health effects, the question of the chemical characterization of the
ultra-fine particles released by such devices is of special importance (BfR, 2008). However,
due to the low mass of the UFPs and high volatility nature, they evaporate as soon as they
are released; it has not yet been possible to ascertain their chemical composition (Wensing et
al, 2008). Previous publications by Bake and Moriske, (2006) and Wensing et al., (2006) have
shown that hardcopy devices often emit UFPs while larger particles (e.g. toner dust) could
only be detected in low concentrations. Moreover, adverse health effects from exposure to
nanoparticles have been found to be more closely related to particle number concentration
than to particle mass concentration ( Oberdorster,2000). These health effects may differ
substantially depending on the size, morphology, composition (both bulk and surface), and
concentration of airborne particles (Oberdorster, 2005).
Many studies of photocopier-related emission have been carried out in test chambers (Lee et
al., 2001). Field studies on the impact of photocopiers and printers on indoor air quality are
relatively limited. Though specific printer-emitted VOCs and PM has been studied (Kagi et
al., 2007), no report has addressed the PM concentration in photocopier and printer centers.
Since the size of individual particles influences the degree to which they can be inhaled and
the effects that they can cause (Lee et al., 2001), the characteristics of such-emitted particles
are needed to evaluate whether exposure control and reduction efforts are necessary.
Furthermore, the main difference between the photocopier centers in India and other
developed countries is that such centers in India are generally small and serve as both
businesses and residences. Thus, the pollutants emitted during such processes would affect
the indoor air quality and potentially have adverse health effects on the employees as well
as the residents of the workplace. The objective of this study is to investigate size distributed
particle number and mass concentration in 250 to 1000 nano meters range in some
representative commercial photocopier and printer centers in the Northern Central India.
The sources of these particles are also discussed in the indoor air.
2. Materials and methods
Air sampling was conducted at 2 photocopier centers A and B (Fig.1) in the Agra city in the
month of June 2009. Measurements were made for eight days, four days each at each
Emission and Formation of Fine Particles from
Hardcopy Devices: the Cause of Indoor Air Pollution
123
sampling center. In India, most photocopiers and printer centers are located in multi-storey
street houses. The area of each center is approximately 30 to 36 m
3
. No forced ventilation
systems used during the measurement. However, the door to the experimental rooms were
opened and closed often by the users and the customers whenever they entered the room to
use the equipment. In a typical street house, the ground floor is the work area and the upper
floors are living areas. Typical interior materials used in photocopier centers include ceramic
tile floor, painted concrete ceiling, painted concrete walls and sliding aluminum-framed
glass doors. Usually only some metal desks and chairs, and no other furniture are present in
the confined space of a photocopier center. Basic information of each center, including
business hours, room dimensions, environmental conditions, types of ventilation and
entrance, number of photocopiers, printers and number of copies made were collected.
Table 1 lists there characteristics of the centers.
Fig. 1. Map of Agra Showing the Sampling Centers
Grimm 31-Channel Portable Aerosol Spectrometer model No.1.109 was selected for
monitoring the particle mass and size distribution in the range of 250 – 1000 nm, at a flow
rate of 1.2 L/min ± 5% constant with controller for continuous measurement during the
sampling period. The instrument was set to collect data at 10 minute intervals and it store
the data in data memory logger card from which data can be downloaded to computer and
can be analysed. Particles are collected close by the analyzer from a dedicated 5 cm long
vertical sampling head (no sampling tubes and therefore no particle loss). The instrument
Monitoring, Control and Effects of Air Pollution
124
works on dual technology i.e. the principle of scattering of light at 90° to give the real-time
measurements and total particles can be collected on 47- mm PTFE filter paper for chemical
analysis. Its real time measuring range is from 0.25 µm to 32 µm or 250 nm to 32,000 nm in
31 channel sizes, each unit is with NIST (National Institute of Standards and Technology)
certified, monodisperse latex on the size of channels calibrated [www. GRIMM-
aerosols.com].To improve the time resolution, the range was limited to 0.25 to 1 µm or 250 to
1000 nm in 12 channels. The sampling tube of the analyzer was positioned as close as
possible to head height in the center of the sampling room. The GRIMM particle measuring
system is equipped with GRIMM 1174 Software for data acquisition.
a = air-conditioned, b = natural ventilation open door
Table 1. Physical Characteristics of the Photocopier Centers
3. Result and discussion
3.1 Experimental methods used in emission characterization
Sampling was done to measure the ultra fine particle size distribution and mass
concentration at an interval of 10 minutes, in two periods at the photocopier and printer
centers A and B during the business hours and background hours. The back ground values
were obtained inside the centers by monitoring the particles 2 hours before opening of the
centre and 2 hours after the centers were closed. All measurements were conducted during
eight days period in the month of June 2009. Emissions from hardcopies were measured at
room temperature (21–30ºC), with an intermediate humidity conditions (45–60% RH). CO
2
was also recorded up to 650 PPM while sampling.
The average mass concentration of the particles ranged from 1.86 µgm
-3
to 11.71 µgm
-3
at
center A and 4.89 µgm
-3
to 46.46 µgm
-3
at center B as shown in table 2 A. Increase in the
concentration of ultra fine particles in this study seems to be in consistent with the results of
studies which suggested that PM emitted by hardcopiers are aerosolized toner powder (Lee
et al., 2007). Table 2 A shows the particle mass concentrations measured in back ground air
ranged from 0.87 µgm
-3
to 9.10 µgm
-3
at center A and 0.87 µgm
-3
to 9.13 µgm
-3
at center B and
during the hardcopier making they ranged from 2.43 µgm
-3
to 13.71 µgm
-3
at center A and
8.33 µgm
-3
to 80.16 µgm
-3
at center B which were much higher at both the sites from the
background values. Increase in the particulate concentration at the center B was observed
more in comparison to A.
Table 2 B, shows the particle number concentration obtained in photocopier centers A and B.
The table reveals that the number of particle increased when hardcopier devices began to
make copies. During the operational mode of these hard copying machines the number
concentration of the particulate varied in center A from 68223/Lit to 569896/Lit with an
average of 258485/Lit, where as in the center B it varied from 82612/Lit to 2580941/Lit in
the range of 250-1000 nm with an average of 1504133/Lit respectively. A high number
concentration of ultra fine particles was found with a peak value of 569896/Lit particle at
Emission and Formation of Fine Particles from
Hardcopy Devices: the Cause of Indoor Air Pollution
125
center A and 1504133/Lit at center B particularly during business hours. The number
concentration of particles in 250–1000 nm was significantly higher than mass concentration
of the same range at both the centers. It was 3-7 times higher during operational hours than
background values obtained before and after the machine was operational at both the
centers (table 3). As the machines were nonoperational before the opening of the centers in
morning and after the closing of the centers at night, there were significant decrease in the
particulate numbers and mass concentrations from the working hours of the machine
during the day. While during the working hours, the number of particulate and mass
concentration kept on increasing during the first hour of hardcopying; however they
decreased after a period of time as shown in Fig. 2.
The number and mass concentrations of the particles in the sampling centers were found
to increase significantly from background values during the sampling of 4 hrs in a definite
trend as shown in Fig. 2. This increase with respect to background values in centers A and
B was 27% for first hour which decreased to 23% in the second hour, 20% in the third and
19% in the fourth hour with respect to background values. Thus settling time for the
particles emitted from the photocopier was analyzed from the background values
measurement. The photocopier and printers were not in use during the night hours that is
before opening and after closing of the centers. The total particle count in a cubic
centimeter and mass concentration in µgm
-3
of air was estimated for the working hours as
shown in Fig 2. Activity resumed from the morning by photo printing of the machines.
Hence, the settling time of the particles could be estimated using the data from the
background values. It can be seen that the total particle count and mass concentration
dropped to low levels over two hours of working and then remained constant during the
further working hours.
Centers also have other individual sources than the hardcopiers itself for particles
generation. Other chemical constituents, as well as mechanical processes, can also
influence the emission behavior during operation (Wensing et al., 2006). Characterizing
emissions from hardcopier equipment are also difficult due to the diversity of available
equipment, the rapid evolution and turnover of product lines and the variability in
environmental and operating conditions. Lee (2001) have pointed out earlier in his
laboratory study about 75% of photocopier toner is transferred to the photoconductive
drum and that which does not adhere to the drum becomes available for emission to
indoor air. The toner particles are about 10 µm. It needs further consideration but is
indicating (Kagi et al., 2007) in the study that fine particles were not directly generated
from toner particles but by the secondary formation of the VOCs and the water mists
emitted during the operation of the printers.
Finally, the path by which the UFPs leave the printer is also an important aspect
describing emission behavior. As an example, the maximum total concentration of
particles (d<1μm) and the sampling points are displayed by using a printer in Fig.3
(Wensing et al., 2008). The results show that most particles leave the printer near the
paper tray and at the back. Release through the fan above the toner waste bottle is
considerably lower. Consequently, a retrofitted filter system (designing of air flow system
in such a way that the majority of the released UFP leave the casing through a definite
opening) may be a possible way to reduce the overall UFP emissions from the appliances.
However, the results of this experiment are limited to the printer examined because every
type of laser printer—even from the same manufacturer—can have different ventilation
and air flow paths. The air flow direction will not be the same for every printer. In some
Monitoring, Control and Effects of Air Pollution
126
cases air is blown into the printer to cool the internal components (such as printed circuit
boards). In such a case a fitted filter would only come in contact with the emitted particles
via the backflow.
4. Formation of particles
The particle size distribution obtained in this study indicated the formation of fine particles
during photocopying and printing. Many studies have suggested different mechanism of
formation of fine and ultra fine particles (UFP) (Lee et al., 2007).
a. Physical process of nucleation and condensation. The first possible formation
mechanism of UFP is the nucleation/condensation of low vapor pressure substances,
which were vaporized at high temperature and condensed at low temperature to form
particles. Some substances from the heated toner or paper were vaporized during the
fusing stage, in which the fuser temperature reached around 200ºC, and their
concentrations exceeded their saturation vapor concentration (Jang and Kamens, 2001).
Therefore, particles may form when the saturated vapor condenses at a lower
temperature.
b. Oxidation of VOCs. The second possible mechanism of UFP formation during
photocopying is the oxidation of indoor VOCs. The byproducts of corona charging
during photocopying, such as ozone, NO
x
and OH-radicals, are both strong oxidants for
the oxidations of emitted VOCs. Many studies have demonstrated that photo-oxidation
products of aromatic hydrocarbons can undergo various reactions to produce
secondary organic aerosols (SOA) in the presence of O
3
, OH radicals, and NO
x
(Edney
et al., 2001; Jang and Kamens, 2001). The microenvironment inside the photocopier is
very similar to a photochemical smog chamber that contains a light source and higher
concentrations of reaction agents. Therefore, SOA formation inside photocopiers might
be an important source of indoor UFP and FP during photocopying. Furthermore,
many studies have confirmed that ozone may react with unsaturated VOCs (such as
terpenes and styrene), causing secondary emission of UFP and FP in an indoor
environment (Wolkoff and Nielsen, 2001; Fan et al., 2005). Even though UV irradiation
is not present in indoor environment (except the spaces inside the photocopiers), SOA
may form when ozone reacts with those unsaturated VOCs presented in photocopy
center.
c. Ion-induced nucleation. Ions, which are generated by corona devices during
photocopying, may play a role in the formation of UFP and FP by ion-induced
nucleation of organic vapors. Many works have confirmed the effect of ionizing
radiation on aerosol formation (Ramamurthi et al., 1993). Ion-induced nucleation is the
gasto-particle process causing supersaturated vapors to condense on ions. During ion-
induced nucleation processes, the higher particle growth rates are observed because
electrostatic forces would enhance the stability of electrically charged clusters (Yu and
Turco, 2001). Ichitsubo et al., (1996) reported an experimental study of UFP generated
from organic vapors by corona ionizers. Among the organic compounds tested
(aromatics, alcohols, ketones and others), only aromatic compounds undergo gas-to-
particle conversion process and yield unstable clusters, which may grow into detectable
particles (42 nm) during corona discharge. Based on the results of the above studies,
UFP could be formed rapidly during photocopying by the ion-induced nucleation of
emitted aromatic hydrocarbons.
Emission and Formation of Fine Particles from
Hardcopy Devices: the Cause of Indoor Air Pollution
127
A. Mass concentration in µgm
-3
B. Particulate count/liter
Table 2. Particulate Mass and Number at Centers A and B
Monitoring, Control and Effects of Air Pollution
128
Mass difference
Count difference
Table 3. Mass and Number Difference at the Two Centers
Emission and Formation of Fine Particles from
Hardcopy Devices: the Cause of Indoor Air Pollution
129
Center A
Center B
Fig. 2. Trends in number and mass concentration of particles in photocopier center A and B
Monitoring, Control and Effects of Air Pollution
130
To date, the information regarding the formations of UFP and FP during photocopying is
still limited. The mechanism of UFP and FP formation is far from being well understood and
a single process is not likely to explain all the phenomena’s. Although the formation
mechanism remains unclear, Fig. 3 summarizes the possible mechanisms for the formation
of UFP during photocopying, including condensation, oxidation and ion-induced
nucleation. Corona devices, which can generate ozone, NOx, radicals and ions during
photocopying, may be the key element of UFP formation and particle removal in photocopy
centers.
Fig. 3. Example of paths of UFP release from a laser printer Taken from (Wensing et al.,
2008)
Fig. 4. Conceptual model of indoor air chemistry and particle formation and removal during
photocopying and Printing Taken from (Lee et al., 2007)