Monitoring Control and Effects of Air Pollution Part 8 potx
Bạn đang xem bản rút gọn của tài liệu. Xem và tải ngay bản đầy đủ của tài liệu tại đây (3.25 MB, 20 trang )
Emission and Formation of Fine Particles from
Hardcopy Devices: the Cause of Indoor Air Pollution
131
Although the formation mechanism remains unclear, Fig.4 summarizes the possible
mechanisms for the formation of UFP and FP during photocopying, including condensation,
oxidation and ion-induced nucleation (Lee et al., 2007). Corona devices, which can generate
ozone, NOx, radicals and ions during photocopying, may be the key element of UFP and FP
formation and particle removal in photocopier centers.
5. Conclusion
The unexpected phenomenon namely declined in particle mass and number concentration
as operation proceeded for few hours is likely attributable to the surface deposition of
charged particles, which are charged primarily by the diffusion charging of corona devices
equipped inside the hardcopies devices. Particle charging is a function of the ion
concentration. Based on the monitored results in centers, particle number and mass
concentrations increased immediately as the operations proceeded. During the first hour of
operation, ions emitted from corona devices might not be high enough to charge particles
indoors; therefore, the increasing trends of particles were consistent. However, after the first
hour of operation, the ion concentrations in indoor environment might reach to a point that
can accelerate the speed of diffusion charging and increase the deposition rates of charged
particles to nearby surfaces. After this point, the particle removal rates were higher than the
particle formation rates and therefore the particle number concentrations decreased,
although hard copying process was consistently being conducted under the same
ventilation conditions. This decrease was less in center A than in comparison to center B
because center A was fully air-conditioned. So the doors and windows were kept close
where as center B was naturally ventilated.
The results of the these real room measurements are not sufficient to permit classification of
possible health related issues with printer and photocopier generated aerosols for this
purpose both a more detailed chemical characterization of the particles and a model for
exposure assessment would be required. The fact that hardcopy devices are not the only
source of fine particulate in indoor environment also needs to be accounted for. In Agra
photocopy centers usually open at 10 am and close at 10 pm. If the background particulate
value is taken as the particle mass concentration in close hours then the 24 h average PM
concentration can be calculated for each photocopy centre by assuming 12 hrs for business
and 12 for close hours respectively. Additionally most photocopy centers in Agra open 6
days a week and 52 weeks per year. Therefore based on the results of this study, the PM in
the range of 250 nm to 1000 nm should be concerned in view of annual human exposure.
Personal exposures may be significantly larger than those estimated through average
pollutant indoor concentrations, due to proximity of users to the sources over extended
periods of time. The magnitude of emissions, the link from emissions to personal exposure,
the toxicological significance of the chemicals emitted, and the costs and impacts of alternate
materials should all be considered in order to evaluate potential importance of human
exposures and health risks. The policy for precautionary reasons for example developing
ecolables for low emitting products can be a possible solution to it.
Finally, it is important to put this work in the context of exposure, health implications,
energy costs, and technology options. Considering the diversity of equipment, the rapid
evolution and turnover of product lines, changes in manufacturing processes and variability
Monitoring, Control and Effects of Air Pollution
132
in operating conditions, the values summarized in this study represent initial estimates of
emissions and their implications. This study also highlights the importance the need for
evaluating long term effects of exposure to toner particles since these are yet to be fully
understood. Further studies are recommended to measure the direct adverse effects of these
particles to human health.
6. Acknowledgements
The authors like to thank the CSIR (COUNCIL OF INDUSTRIAL RESEARCH) project no:
231065/2K10/1, Dr. F.M.Prasad, Principal of St. John’s College Agra and Dr. Ashok Kumar,
Head, Department of Chemistry, St. John’s College Agra for providing us the facilities.
7. References
Newburger E. C. (2001): “Home computers and Internet use in the United States: August
2000”, Special Studies, US Census Bureau, Washington, DC
Wensing M., Uhde E., Salthammer T. (2005): ‘‘Ultra-fine particles release from hardcopy
devices: Sources, real-room measurements and efficiency of filter accessories”,
Science of The Total Environment 339: 19–40
Wensing M., Kummer T., Riemann A., W Schwampe W. (2002): “Emissions from electronic
devices: examination of computer monitors and laser printers in a 1m
3
emission test
chamber”, The 9
th
International Conference on Indoor Air and Climate, 2,
Monterey, p. 554–9
Wolkoff P., Wilkins C.K., Clausen P.A., Larsen K. (1993): “Comparison of volatile organic
compounds from processed paper and toners from office copiers and printers:
methods, emission rates, and modeled concentrations”, Indoor Air, 3: 113–123
Armbruster C., Dekan G., Hovorka A. (1996): “Granulomatous pneumonitis and mediastinal
lymphadenopathy due to photocopier toner dust”, Lancet 348: 690
Black M.S., Worthan A.W. (1999): “Emissions from office equipment”, The 8
th
International
Conference on Indoor Air and Climate. 2, Edinburgh. p. 454–9
Wolkoff P. (1999): “Photocopiers and indoor air pollution”, Atmospheric Environment, 33:
2129–30
Lee S.C., Lam S., Fai H.K. (2001): “Characterization of VOCs, ozone, and PM
10
emissions
from office equipment in an environmental chamber”, Building and Environment
369, (7): 837–42
Roller. (2006): “Quantitative risk assessment for the exposure to toner emissions from
copiers”, Gefahrst Reinhalt Luft, 66: 211–6
Wolkoff P., Wilkins C.K., Clausen P.A., Nielsen G.D. (2006): “Organic compounds in office
environments—sensory irritation, odor, measurements and the role of reactive
chemistry”, Indoor Air, 16, 7–19
He C., Morawska L., Taplin L. (2007): “Particle Emission Characteristics of Office Printers,
Environment Science and Technology, 41 (17)
Gatti A.M. (2008): “Nanopathology: a new vision of the interaction environment-human”,
Available on line from address: />oflife/ka4/pdf/report_nanopathology_en.pdf
Emission and Formation of Fine Particles from
Hardcopy Devices: the Cause of Indoor Air Pollution
133
Oberdorster G., Oberdorster E., Oberdorster (2005): “Nanotoxicology: An emerging
discipline evolving from studies of ultrafine particles Environ” J. Health Perspect,
113: 823–839
Chalupa D.C., Marrow P.E., Oberdorster G., Utell M.J., Frampton M.W. (2004): “Ultrafine
particle deposition in subjects with asthma”, Environmental Health Perspectives.
112: 879-882
BfR–Federal Institute for Risk Assessment, (2008), Gesundheitliche Bewert Organic
compounds in office environments—sensory irritation, odor, measurements and
the role of reactive chemistry, ung Nr. 014/2008 vom 31, März
Bake D., Moriske H.J. (2006): “Investigations about emissions of fine and ultrafine particles
by using laser printers. Umweltmed Forsch Prax 11: 301–8
Wensing M., Pinz G., Bednarek M., Schripp T., Uhde E., Salthammer T. (2006): “Particle
measurement of hardcopy devices”, Healthy Buildings, 2: Lisbon. pp. 461–464
Oberdorster G. (2000): “Toxicology of ultrafine particles: In vivo studies”, Philos.Trans. R.
Soc. Lond, A 358: 2719–2740
Oberdorster G., Oberdorster E., Oberdorster (2005): “Nanotoxicology: An emerging
discipline evolving from studies of ultrafine particles Environ” J. Health Perspect,
113: 823–839
Kagi N., Fujii S., Horiba Y., Namiki N., Ohtani Y., Emi H., Tamura H., kim Y.S. (2007):
“Indoor air quality for chemical and ultrafine particle contaminants from printers”,
Building and Environment, 42: 1949-1954
www.GRIMM-aerosol.com
Lee C.W., D J Hsu D.J. (2007): “Measurements of fine and ultrafine particle formation in
photocopy centers in Taiwan”, Atmospheric Environment, 4: 6598-6609
Wensing M., Schripp T., Uhde E., Salthammer T. (2008): “Ultra-fine particles release from
hardcopy devices: Sources, real-room measurements and efficiency of filter
accessories”, Science of The Total Environment, 407: 418-427
Jang M., Kamens R.M. (2001): “Characterization of secondary aerosol from the
photooxidation of toluene in the presence of NO
x
and 1-propene”, Environmental
Science and Technology, 35: 3626-3639
Edney E.O., Driscoll D.J, Weathers W.S., Kleindienst T.E., Conver T.S., Mclver C.D., W Li W.
(2001): “Formation of polyketones in irradiated toluene/propylene/NO
x
/air
mixtures”, Aerosol Science and Technology, 35: 998-1008
Wolkoff P., Nielsen G.D. (2001): “Organic compounds in indoor air—their relevance for
perceived indoor air quality?”, Atmospheric Environment, 35: 4407-4417, 2001
Fan Z.H., Weschler C.J., Han I.K., Zhang J.F. (2005): “Conformation of hydroperoxides and
ultra-fine particles during the reactions of ozone with a complex VOC mixture
under simulated indoor conditions”, Atmospheric Environment, 39: 5171-5182
Ramamurthi M., Strydom R., Hopke P.K., Holub R.F. (1993): “Nanometer and ultrafine
aerosols from radon radiolysis”, Journal of Aerosol Science, 24: 393–407
Yu F., Turco R.P. (2001): “From molecular clusters to nanoparticles: role of ambient
ionization in tropospheric aerosol formation”, Journal of Geophysical Research,
106: 4797-4814, 2001
Monitoring, Control and Effects of Air Pollution
134
Ichitsubo H., Alonso M., Ishii M., Endo Y., Kousaka Y., Sato K. (1996): “Behavior of ultrafine
particles generated from organic vapors by corona ionizers”, Particle and Particle
System Characterization, 13: 41-46, 1996
10
In-Office Dispersion and Exposure to
Contaminants Originating
from an Unfolded Letter
Alfred D. Eisner
1
, Russell W. Wiener
2
and Jacky Rosati
2
1
Alion Science and Technology,
2
National Homeland Security Research Center,
U.S. Environmental Protection Agency,
USA
1. Introduction
Incidents of bioterrorism that have occurred over the past decade have demonstrated a need
to understand the transmission and exposure risks of daily activities to potential biological
agents (NATO, 2005; de Armond, 2002; Block, 2001). Based on experience since September
11, 2001, the mail has become a significant means of bioagent dispersion. This chapter seeks
to further advance our understanding of fluid and aerosol dynamic processes of exposures
resulting from dust lying on the surface of a letter or a table being resuspended by air flow,
(Richmond-Bryant, et al., 2006).
Transmission of aerosols from an unfolded letter, (Duncan et al., 2009), is dependent on the
motion of the air in the environment in which the letter resides (Dull et al., 2002). The
primary source of fluid motion in most buildings is the heating, ventilation, and air-
conditioning (HVAC) system. Several reports suggest that numerous pathogens may
survive such airborne transport (e.g., Nardell et al., 1986; Mangili and Gendreau, 2005).
Others show how contaminants can be dispersed into the indoor environment (e.g., reviews
by Wallace, 1996, and Nazaroff, 2004; Price, et al., 2009; Reshetin & Regens, 2003; Reshetin &
Regens, 2004). These reviews and many papers cited therein show that indoor particle
transport is subject to complex interactions of dispersion, deposition, and resuspension.
Understanding these processes is predicated on understanding the interaction between
turbulent airflow and particles. Rooms often have complex geometries that result in
extremely complex turbulence because of flow phenomena such as flow separation,
recirculation, and buoyancy (Posner et al., 2003; Rim and Novoselac, 2009).
Contamination and exposure resulting from a localized source such as a contaminated letter
has received some recent attention. (Agranovski et al., 2005; Ho et al., 1993; Ho et al., 2005;
Kornikakis et al., 2001; Kornikakis eta l., 2009; Kornikakis et al., 2010; Lien et al., 2010).
In many offices, outlets from the HVAC system are positioned in the ceiling and often
generate a substantial downward blowing of air, (Nardell, et al., 1986). Ceiling fans can have
a similar effect. This airflow will almost certainly incorporate flow separation and
recirculation zones. Advancing the understanding of dispersion of particulate contaminants
under such complex conditions can provide useful input for decontamination efforts
Monitoring, Control and Effects of Air Pollution
136
directed toward contaminated individuals or objects. To this end, the study described in this
paper investigated dispersion and surface contamination resulting from contaminated
material being reentrained from flat letter lying on a table top under a vent.
2. Methods
2.1 Experimental setting
This investigation was designed to explore a hypothetical situation in which a person seated
at a table is exposed to reentrained dust from the surface of a letter that is lying flat on a
desk under an HVAC vent. In our experimental simulation, an individual, represented by a
manikin, was seated at a table adjacent to an office wall and positioned under an HVAC
vent (Fig. 1). A surrogate letter was made of Rosco cine foil
TM
, matte black, and gauge 0.002
in. It’s thickness, stiffness and roughness were similar to a standard paper sheet. Using this
surrogate was necessary to prevent PIV cameras over saturation and to obtain images of
particles moving very close to the surface. From now on we will refer to this surrogate letter
as letter. It was placed flatly on the table in front of the manikin and sprinkled with test
dust. The dust was Arizona dust with particle size ranging from 1-5 microns.
2.2 Experimental systems
Several fundamental experimental systems were used in this research: a thermal articulated
manikin (TAM), an environmental walk-in chamber (EWC) used as an office space
simulator, and a particle imaging velocimetry (PIV) system. Each of these systems is
described briefly below.
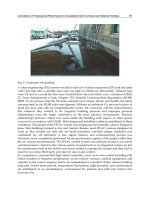
Fig. 1. Manikin confronted by a cloud of contaminating dust blown from an unfolded letter
by air from a ceiling vent. Piled-up dust of mostly agglomerated and shifted large particles
can be seen on the letter section close to the manikin’s chest. Two x,y coordinate systems
reflect positions of the PIV test areas, namely, a table area and a head area.
In-Office Dispersion and Exposure to Contaminants Originating from an Unfolded Letter
137
2.2.1 Articulated manikin
An adult-size TAM (Model Newton, Measurement Technology Northwest, Seattle, WA,
USA) with 18 heating zones was used in this study. The dimensions of the manikin were
sized to match a 50
th
percentile U.S./European male. The TAM, designed as a repeatable
instrument to evaluate various thermal conditions, has isothermal surfaces over each
individual zone. All thermal zones are fitted with heaters to simulate metabolic heat output
rates and a distributed temperature sensor to accurately measure the average temperature
over each zone. For the purpose of this study all zones were set at 37 °C.
2.2.2 Environmental walk-in chamber
The EWC (297 by 216 by 221 cm) was made of industrial steel and was located inside a large
laboratory facility with temperature and humidity kept at normal laboratory levels. The
EWC was fitted with two ceiling openings (20 cm in diameter) located centrally 50 cm from
the front and back walls. The openings were used as the HVAC system’s air inlet and outlet
and were connected to the recirculating air moving unit positioned on the roof of the EWC.
The air mover speed could be controlled by a variac, and the blower fan could be turned on
or off as needed. Aluminum corrugated duct work several meters long was connected to the
blower to allow for quick heat dissipation by the blower fan, thus ensuring the temperature
and humidity conditions inside the EWC were essentially those in the large laboratory
space. A table measuring 122 by 70 by 91 cm and a TAM were positioned inside the EWC.
Fig. 2. Schematic view of TAM seated inside EWC. The table and chair are represented
schematically by flat rectangles. Two openings in the ceiling represent the HVAC inlet (IN)
(above the table) and outlet (OUT).
Monitoring, Control and Effects of Air Pollution
138
2.2.3 Particle imaging velocimetry (PIV)
A two-pulse laser technique such as PIV (TSI Inc., Shoreview, MN, USA) is commonly
used to investigate particle-laden fluid flows. In these laboratory configurations, two laser
pulses are fired in rapid sequence, typically 10 microseconds to 10 milliseconds apart.
Usually two synchronized laser heads are used. In this study, a standard PIV
configuration was used in which two laser beams following a common path form sheets
that illuminate a plane of air, thus illuminating the location of particles in the flow. Two
PIV digital cameras capable of recording two frames in one image were used. PIV was
activated remotely to collect images of the dispersed dust particles. The images were then
analyzed for particle displacement, allowing study of the flow. The images were analyzed
using Insight 3G software provided by the PIV manufacturer (TSI, Inc.). This application
can execute statistical analysis and generate 2-D and 3-D graphics in conjunction with
applications such as TechPlot (Polysoft, Salt Lake City, UT, USA) and Matlab (The
MathWorks, Inc., Natick, MA, USA).
2.3 Numerical methods
Computational fluid dynamics (CFD) numerical methods, (Darrell, et al., 2007), were used
to simulate and analyze airflow patterns and thermal fields inside the chamber and around
the manikin (Lu et al., 1997; Patankar, 1980). The CFD method is predicated on solving the
Navier-Stokes equations, which are formulations of mass, momentum, and energy
conservation laws for fluid flows. The equations are supplemented by fluid state equations
defining the nature of the fluid and by empirical dependencies of fluid density, viscosity,
and thermal conductivity on temperature.
To predict turbulent flow, the Favre-averaged Navier-Stokes equations were used, where
time-averaged effects of the flow turbulence on the flow parameters were considered. In this
procedure, the information on Reynolds stresses must be provided for the equations. To
close this system of equations, transport equations for the turbulent kinetic energy and its
dissipation rate, the so-called k-ε model, are employed. A laminar/turbulent boundary layer
model was used to describe flows in near-wall regions. The model was based on the
modified wall functions approach. This model is employed to characterize laminar and
turbulent flows near the walls and to describe transitions from laminar to turbulent flow
and vice versa. The modified wall function uses a Van Driest’s profile instead of a
logarithmic profile. If the size of the mesh cell near the wall is more than the boundary layer
thickness, the integral boundary layer technology is used.
The CFD model calculates two-phase flows as a motion of spherical solid particles in a
steady-state flow field. Their drag coefficient is calculated with Henderson’s formula,
derived for continuum laminar, transient, and turbulent flows over the particles and taking
into account the temperature difference between the fluid and the particle. The gravity is
also taken into account. The interaction of particles with the model surfaces is taken into
account by specifying ideal or non-ideal reflection (which is typical for solid particles). The
ideal reflection denotes that, in the impinging plane defined by the particle velocity vector
and the surface normal at the impingement point, the particle velocity component tangent to
the surface is conserved, whereas the particle velocity component normal to the surface
changes its sign. A non-ideal reflection is specified by the two particle velocity restitution
(reflection) coefficients.
Briefly, the CFD program solves the governing equations with the finite volume (FV)
method on a spatially rectangular computational mesh designed in the Cartesian coordinate
In-Office Dispersion and Exposure to Contaminants Originating from an Unfolded Letter
139
system with the planes orthogonal to its axes and refined locally at the solid/fluid interface
and, if necessary in specified fluid regions, at the solid/solid surfaces and in the fluid region
during calculation. Values of all the physical variables are stored at the mesh cell centers. In
the FV method, the governing equations are discretized in a conservative form. The spatial
derivatives are approximated with implicit difference operators of second-order accuracy.
The time derivatives are approximated with an implicit first-order Euler scheme. The
viscosity of the numerical scheme is negligible with respect to the fluid viscosity. All issues
related to solution convergence, such as mashing or boundary flow convergence, are taken
care of automatically or by user defined criteria.
A numerical (virtual) EWC (NEWC), as shown in Fig. 2, was used to model the airflow and
aerosol dispersion inside the simulated office, (Rhie & Chow, 1983; Vlahostergios, et al.,
2009). The dimensions of the NEWC were identical to the actual EWC. The NEWC is a fully
functional meshed 3-D numerical model of the EWC and the articulated manikin seated at
the table. The manikin’s position and orientation could be changed and the chamber
furnishings rearranged as desired. The NEWC was fitted with two ceiling vents that could
be used to define air in-flow and out-flow as desired based on volume or pressure. For
simulations, the wall temperature and the manikin’s body temperature were 20 °C and
37 °C, respectively, based on actual experimental conditions.
2.4 Experiments
2.4.1 Table zone tests
In our experiments, the letter was folded as a trifold letter and then unfolded and placed on
the desk. It was positioned at two locations in the EWC: (1) close to the vent with the center
of the letter at 30 cm from the manikin’s chest and (2) close to the manikin’s chest with the
center of the page at 20 cm from the manikin’s chest. The letter was coated (contaminated)
with dust. The dust coating was achieved by loading a small amount of fine test dust
(Powder Technology, Inc., Burnsville, MN, USA) in the 5 μm or less size range onto a No.
270 sieve and vigorously shaking the sieve above the foil. Experiments were conducted
with the EWC closed and no laboratory personnel present to reduce any uncontrolled
disturbance to air motion.
The vertical test area measured 25 by 25 cm and was located directly above the letter in the
vertical plane bisecting the manikin’s chest, as indicated by the x,y coordinate system shown
just above the table in front of the manikin’s chest in Fig. 1. The coordinate system origin
was located on the table surface 5 cm from the manikin’s chest. Thus, the x-axis coincided
with the table surface and extended from the manikin toward the wall of the test room,
while the y-axis extended vertically upwards. (Note that because of various limitations, such
as accessibility inside the EWC, PIV camera positioning and viewing orientation, and a
separate CFD-defined calculational domain, several coordinate systems appear in images
and figures in this paper.)
The HVAC system was activated simultaneously with the PIV system to capture the event
of the dust being reentrained from the foil. The PIV system could collect 20 double images in
real time (saved in ROM) at a frequency of up to 10 images per second. Thus, to increase the
possibility of detecting particle liftoff from the letter, we kept the PIV frequency at 2–3
images per second. These experiments showed that dust particles were indeed blown from
the letter and reached the breathing zone of the manikin, as discussed below.
Monitoring, Control and Effects of Air Pollution
140
2.4.2 Breathing zone tests
After demonstrating in the table zone tests that particles could be lifted from the
contaminated letter, experiments were conducted to determine if these particles reached the
manikin’s breathing zone. For the purpose of these experiments, the PIV test section was
positioned in front of the manikin’s head. This positioning is reflected by the x,y coordinate
system adjacent to the manikin’s face (see Fig. 1). Experimental procedures were similar to
those in the previous experiments.
3. Experimental results and analyses
3.1 Airflow pattern in table zone area
Several experiments were conducted with theatrical smoke particles fed into the air duct
system to determine the airflow pattern above the table. When the blower was activated, the
air velocity from the vent quickly reached approximately 1 m s
-1
. PIV images of the entire
test area were then analyzed. Representative velocity vector fields, measured within a
second of each other, are shown in Fig. 3a and 3b.
Fig. 3a. Airflow vector field in PIV test area just above the letter. Manikin’s torso is to the left
of the y-axis. For the investigation area shown, the average U (horizontal) velocity
component was -0.35 m s
-1
, and the average V (vertical) velocity component was -0.43 m s
-1
.
Areas void of vectors, especially in Fig. 3a, most likely resulted from the lack of particles at
the instant the image was taken. The smoke generator was delivering particles directly into
the venting duct and images were captured before well-mixed conditions were achieved.
A comparison of Fig. 3a and 3b shows that the velocities in Fig. 3b are generally higher than
in Fig. 3a, because these images were captured as the blower was speeding up. The higher
velocity resulted from activation of the air mover and its rapid acceleration to the steady
maximum rate. Part of the airflow is diverted by the table toward the manikin’s chest,
especially within the layer 10 cm from the table surface. Although the average velocity
components during those seconds when the images were captured were on the order of 0.5
m s
-1
, the increased vector lengths in Fig. 3a and 3b show that the velocity of the air flowing
parallel to the table surface in that layer was higher and exceeded 1 m s
-1
.
In-Office Dispersion and Exposure to Contaminants Originating from an Unfolded Letter
141
Fig. 3b. Airflow vector field in PIV test area just above the letter. The manikin’s torso is to
the left of the y-axis. For the investigation area shown, the average U (horizontal) velocity
component was -0.46 m s
-1
, and the average V (vertical) velocity component was -0.71 m s
-1
.
3.2 Contaminated letter tests
In these experiments, the air mover and the PIV system were activated simultaneously to
capture images of the dust being blown from the letter. Particle motion away from the edge
of the letter is visible in Fig. 4a in the form of a particle cloud. This area was analyzed to
produce the particle velocity vector field shown in Fig. 4b. Although particle motion toward
the manikin’s chest was a dominating characteristic of the transport, some particle motion
was affected by the flow separation from the letter edge.
Suspecting that higher average horizontal air velocities may exist along the table surface
farther from the vent’s central axis stagnation area, the letter was positioned closer to the
manikin, at 20 cm from the chest. The event is shown in Fig. 5a and its corresponding
velocity field in Fig. 5b.
As expected, this experiment resulted in higher average horizontal particle velocities than
in the previous case. Positioning the letter somewhat farther away from the vent resulted
in particles being subjected to a less chaotic and more developed boundary airflow
pattern. Such velocities can certainly be effective in delivering the dust to the manikin’s
chest.
Although these data produced clear, quantifiable evidence that particles on the
contaminated foil can become airborne, some particles became deposited on the table
surface, thus contaminating the table surface as shown in Fig. 6. The initial powder coating
of the letter was very fine. The air jet affected the particles in a unique way: namely,
particles traversed the surface and in the process agglomerated into much larger particles
that are easily visible on the page surface and the table surface. Many particles followed that
airflow below the table edge and contaminated lower parts of the manikin’s torso in the
process.
Monitoring, Control and Effects of Air Pollution
142
Fig. 4a. Cloud of particles (under mid-arm) moving away from the letter positioned 30 cm
from the chest by air emerging from the ceiling vent.
Fig. 4b. Air velocity field obtained using particles lifted from the letter positioned 30 cm
from the chest. The average U (horizontal) velocity component was -0.60 m s
-1
, and the
average V (vertical) velocity component was -0.17 m s
-1
. The letter surface is essentially at y
= 20 mm. (Values smaller than y = 20 mm pertained to the part of the image irrelevant to
particle transport.)
In-Office Dispersion and Exposure to Contaminants Originating from an Unfolded Letter
143
Fig. 5a. Contaminant particles (lower left corner of image) being moved from letter
positioned 20 cm from the chest by air emerging from the vent.
Fig. 5b. Velocity field within 10 mm of the letter surface obtained using particles lifted from
the letter. The average U (horizontal) velocity component was approximately -1 m s
-1
, and
the average V (vertical) velocity component was 0.16 m s
-1
. The letter surface is essentially at
y = 25 mm. (Values smaller than y = 25 mm pertained to the part of the image irrelevant to
particle transport.)
Monitoring, Control and Effects of Air Pollution
144
Fig. 6. Dust pattern created by air from the vent as dust is blown from the letter. The
manikin is positioned to the left from the table edge visible in this figure.
3.3 Breathing zone tests
To determine whether particles reentrained from the letter reached the manikin’s breathing
zone, PIV images were analyzed to obtain a velocity vector field like the one in Fig. 7. A few
seconds later a residual smoke aerosol entered the airflow and allowed detailed observation
of the airflow in front of the manikin’s face. The flow pattern is shown in Fig. 8. Strong
deflection by the chin and other facial features is noticeable. In addition, the orientation of
the flow vectors also suggests the possibility that a recirculation zone is created in front of
Fig. 7. Airflow vector field in the PIV test area in front of the face, created entirely by
particles lifted from the contaminated letter. The manikin’s head is positioned to the left of
the y-axis. The average U (horizontal) velocity component was -0.05 m s
-1
, and the average V
(vertical) velocity component was 0.2 m s
-1
. Y = 0 corresponds to the top of the manikin’s
head, a convenient point of reference. X = 0 is adjacent to the manikin’s face.
In-Office Dispersion and Exposure to Contaminants Originating from an Unfolded Letter
145
Fig. 8. Detailed airflow pattern in front of the manikin’s face, as depicted by the smoke
particles carried by the vent air. Y = 0 corresponds to the top of the manikin’s head, a
convenient point of reference. X = 0 is adjacent to the manikin’s face
and slightly below the head zone. Such recirculation can lead to a longer exposure time. The
very few vectors after approximately x = 130 is likely due to lack of light sheet in that area.
Here the light sheet (shaped triangularly) originated from above the manikin’s head to
illuminate the area as close to the face as possible.
4. Numerical results and analyses
A numerical (virtual) EWC (NEWC) with the TAM seated at the table was created, as shown
in the two cross-sectional views (side and front) in Fig. 9. CFD simulations were conducted
using the NEWC. Boundary conditions were set based on actual experimental conditions as
described in the experiments above. The simulations assumed that the wall’s temperature
was 20 °C and the manikin’s body temperature was 37 °C. The inlet air velocity was
assumed to be 1 m s
-1
, which matched closely the inlet velocity during the experiments
when PIV images were taken.
Fig. 9. Front and side views of the NEWC
Monitoring, Control and Effects of Air Pollution
146
4.1 Airflow patterns inside NEWC with seated TAM
Fig. 10 shows the air velocity profile (velocity vectors and color-coded velocity range zones)
in the vertical middle cross section of the NEWC. Deflection of the air by the table toward
the manikin and the opposing wall is clearly seen here as indicated by the vectors. A
stagnation area around the inlet axis and accelerated airflow zones along the table surface
are also quite visible.
A more detailed velocity field is presented in Fig. 11, with color-coded zones representing
the temperature field in the NEWC. To avoid clutter, the velocity field is demonstrated
using only 30 trajectories. This figure shows several remarkable stationary eddies that
develop near the manikin. The vortex slightly below the head zone and the flow pattern
above the table surface were also captured in the PIV experiments. An enlarged section of
Fig. 11 is shown in Fig. 12 to elucidate the detailed structure of the flow near the manikin’s
body.
In the flow near the manikin, body heat contributes to convective airflow along the body,
resulting in airflow in the upward direction. If this airflow is contaminated by particles, as
from the contaminated foil under study, the flow pattern will certainly result in
contamination of the torso. (In fact, Fig. 1 shows that the manikin’s torso has become
covered with the dust originating from the contaminated foil.) In addition, the stationary
eddies that form in front of and behind the head may result in enhanced exposure to the
contaminant. Turning the head away from the table may not be helpful in terms of avoiding
exposure. Other eddies, such as the ones near the wall and under the table in Fig. 11, may
require a longer time to clear the contaminating material from the air in the room.
Fig. 10. Air velocity profile in vertical middle cross section of NEWC
In-Office Dispersion and Exposure to Contaminants Originating from an Unfolded Letter
147
Fig. 11. 2-D air velocity field, represented by 30 trajectories, in vertical middle cross section
of NEWC
Fig. 12. 2-D flow patterns near manikin’s body. Picture is flipped horizontally relative to
previous one in order to match the PIV views shown in Fig. 7 and 8.
Monitoring, Control and Effects of Air Pollution
148
Fig. 13. 3-D flow trajectories inside the NEWC.
In Fig. 13, 3-D flow trajectories from the entire chamber volume are shown as projected onto
the central plane. From this figure, one can surmise that the upper torso is essentially
engulfed in a complex recirculating vortex. If this air was contaminated, the flow pattern
suggests entrapment of the torso in the contaminated personal cloud.
5. Conclusion
The potential exposure of a person to biocontaminants residing on the surface of a letter was
examined through experimental and computational evaluation of particle motion and fluid
flow between a flat surface and the breathing zone. The scenario examined used an airflow
pathway where air is released and withdrawn from ceiling vents on either side of a manikin
sitting at a desk in a simulated office enclosure and a black anodized aluminum sheet
sprinkled with fine test dust simulating the contaminated letter. Particle imaging
velocimetry (PIV) showed that dust from the contaminated sheet could readily reach the
torso and the breathing zone of a person sitting next to the letter. Further, extensive
contamination of the table and person’s body below the table is also likely. Numerical
simulations suggest that several recirculating eddies may form in the proximity of the
person’s head. Such eddies may entrap contaminant particles and thus prolong air
contamination and enhance exposure.
The experimental data analyses and numerical modeling described above demonstrate that
dust particles originally coating the contaminated letter are dislodged from the letter when
it is inadvertently positioned under a ceiling vent. Boundary airflow in the vicinity of the
letter causes particle entrainment into the air. Subsequent airflow toward the person’s chest
In-Office Dispersion and Exposure to Contaminants Originating from an Unfolded Letter
149
and further vertical airflow is induced by body heat and is sufficient to deliver particles
from the contaminated letter to the breathing zone in a couple of seconds. The presence of a
recirculating vortex behind the manikin’s head suggests that the air behind the manikin
rapidly becomes contaminated as well. The flow patterns obtained in numerical simulations
suggest that the entire torso will become engulfed in a complex recirculating cloud of
particles that leads to its overall contamination.
Based on the experimental and numerical analyses conducted above, it is clear that
contaminated dust residing on the surface of a letter would very likely be entrained and
transported to the breathing zone of a subject. Further, due to the complex fluid motion
generated by the HVAC system, this material is likely to be widely dispersed throughout
the office.
6. Disclaimer
The U.S. Environmental Protection Agency through its Office of Research and Development
funded and managed the research described here under Contract EP-D-05-065 with Alion
Science and Technology. The views expressed in this paper are those of the authors and do
not necessarily reflect the views or policies of the U.S. Environmental Protection Agency.
Mention of trade names or commercial products does not constitute endorsement or
recommendation for use.
7. References
Agranovski, E., Pyankov, V. & Altman, S. (2005). Bioaerosol Contamination of Ambient Air
as the Result of Opening Envelopes Containing Microbial Materials. Aerosol Science
and Technology, Vol. 39, No. 11, pp. 1048 — 1055.
de Armond, P. (2002). The anthrax letters. Albion Monitor,
Block, S., (2001). The growing threat of biological weapons. American Scientist, Vol. 89, pp.
28-37.
Ferziger, H. (1990). Approaches to turbulent flow computation: applications to flow over
obstacles. J Wind Eng Indus Aerodyn, Vol. 35, pp. 1–19.
Darrell, W., Pepper, & Xiuling, W., ( 2007). A meshless model for rapid prediction of indoor
contaminant dispersion ICCES, Vol. 13, No. 1, pp.15-21.
Dull, P., Wilson, K., Kournikakis, B., Whitney, E., Boulet, C., & Ho, J., (2002), Bacillus
anthracis aerosolization associated with a contaminated mail-sorting machine.
Emerging Infectious Diseases, Vol. 8, pp. 1044-1047.
Duncan, S., Kournikakis, B., & Ho, J. (2009). Pulmonary deposition of aerosolized Bacillus
atropheus (BG) in an awake, unrestrained swine model due to exposure from a
simulated anthrax letter incident. Inhalation Toxicology, Vol. 21, No. 2, pp. 141–152.
Ho, J. & Fisher, G. (1993). Detection of BW agents: flow cytometry measurement of Bacillus
subtilis (BG) spore fluorescence. Defense Research Establishment Suffield Technical
Memorandum, DRES SM-1421.
Ho, J. & Duncan, S., (2005). Estimating aerosol hazards from an anthrax letter. Journal of
Aerosol Science, Vol. 36, pp. 701-719.
Lien, F., Ji, H., Yee, E., & Kournikakis, B., (2010). Prediction of aerosol hazards arising from
the opening of an anthrax-tainted letter in an open office environment using
Monitoring, Control and Effects of Air Pollution
150
computational fluid dynamics. Journal of Engineering Science and Technology. Vol. 5,
No. 3, pp. 302 – 331.
Lu, W., Howarth, T, & Jeary, P. (1997). Prediction of airflow and temperature field in a room
with convective heat source. Build Environ, Vol. 32, No. 6, pp. 541–550.
Kournikakis, B., Armour, J., Boulet, C.A., Spence, M. & Parsons, B. (2001). Risk assessment
of anthrax letters. Defense Research Establishment Suffield Technical Report, DRES TR
2001-048.
Kournikakis, B., Walker, M., Ho, J., & Duncan, S. (2009). Statistical analysis of bacterial spore
aerosols created by opening a spore containing “Anthrax Letter” in an office.
Journal of Aerosol Science, Vol. 40, No. 6, pp. 514–522.
Kournikakis, B., Ho, J., & Duncan, S. (2010). Anthrax letters: personal exposure, building
contamination and effectiveness of immediate mitigation measures. Journal of
Occupational and Environmental Hygiene, Vol. 7, No. 2, pp. 71-79.
Mangili A. & Gendreau, A. (2005). Transmission of infectious diseases during commercial
air travel. Lancet, Vol. 365, pp. 989–994.
Nardell, A., McInnis, B., Thomas, B. & Weidhaas S. (1986). Exogenous reinfection with
tuberculosis in a shelter for the homeless. New Engl J Med, No. 315, pp. 1570–1571.
NATO Programme for Security through Science. (2005). Risk Assessment and Risk
Communication Strategies in Bioterrorism Preparedness. In Green MS, Zenilman,
J., Cohen, D., Wiser, I. & Balicer, D., editors. NATO Security through Science Series
– A: Chemistry and Biology. The Netherlands: Springer. ISBN 978-1-4020-5807-3
(PB), ISBN 978-1-4020-5806-6 (HB).
Nazaroff, W. (2004). Indoor particle dynamics. Indoor Air, Vol. 14, pp. 175–183.
Patankar, S. (1980). Numerical heat transfer and fluid flow. Hemisphere Publishing
Corporation.
Posner, D., Buchanan, R. &Dunn-Rankin D. (2003). Measurement and prediction of indoor
air flow in a model room. Energ Build, Vol. 35, No. 5, pp. 515–526.
Price, P., Sohn, M., Lacommare, K. & Mcwilliams, J. (2009). Framework for evaluating
anthrax risk in buildings. Environmental Science and Technology, Vol. 43, No. 6, pp.
1783–1787.
Reshetin, V., & Regens, J., (2003). Simulation modeling of anthrax spore dispersion in a
bioterrorism incident. Risk Analysis, Vol. 23, pp. 1135-1145.
Reshetin, V., & Regens, D. (2004). Evaluation of malignant anthrax spore dispersion in high-
rise buildings. Journal of Engineering Physics and Thermophysics, Vol. 77, No. 6,
pp.1155–1166.
Rhie, C. & Chow, W., (1983). A numerical study of the turbulent flow past an isolated airfoil
with trailing edge separation. AIAA Journal, Vol. 21, No. 11, pp. 1525-1532.
Richmond-Bryant, J., Eisner, A., Brixey, L., & Wiener, R. (2006). Short-term dispersion of
indoor aerosols: can it be assumed the room is well mixed? Building and
Environment, Vol. 41, No. 2, pp. 156-162.
Rim, D. & Novoselac, A. (2009). Transport of particulate and gaseous pollutants in the
vicinity of human body. Build Environ
, Vol. 44, pp. 1840–1849.
Vlahostergios, Z., Yakinthos, K. & Goulas, A. (2009). Separation-induced boundary layer
transition: modeling with a non-linear eddy-viscosity model coupled with the
laminar kinetic energy equation. Int J Heat Fluid Fl, Vol. 30, No. 4, pp. 617–636.
Wallace, L. (1996). Indoor particles: a review. J Air Waste Manage Assoc, Vol. 46, pp. 98–126.