Monitoring Control and Effects of Air Pollution Part 9 pot
Bạn đang xem bản rút gọn của tài liệu. Xem và tải ngay bản đầy đủ của tài liệu tại đây (2.28 MB, 20 trang )
Part 4
Effect of Air Pollutants on Historical Objects
11
Air Pollution and Cultural Heritage: Searching
for “The Relation Between Cause and Effect”
Eleni Metaxa
School of Chemical Engineering, National Technical University of Athens,
Greece
1. Introduction
Pollution of the natural environment is largely unintended and unwanted consequences of
human activities in manufacturing, transportation, agriculture and waste disposal. High
levels of pollution are largely a consequence of industrialization, urbanization and the rapid
increase of human population in modern times. Pollutants are commonly classified
according to the part of the environment primarily effected by them, either by air, water or
land. Sub-grouping depends on characteristics of the pollutants themselves: chemical,
physical, thermal and others. Many pollutants affect more than one resource. The substances
that pollute the atmosphere are either gases, finely divided soils, or finely dispersed liquids
aerosols. Five major classes of pollutants are discharged into the air: carbon monoxide,
sulphur oxides, hydrocarbons, nitrogen oxides and particulates (dust, ash). The principle
source of air pollution is the burning of fossil fuels, e.g., coal, oil and derivatives of the latter,
such as gasoline, in internal combustion engines or for heating or industrial purposes.
The term heritage was used for first time from experts in the early seventies, to declare all the
human creation with artistic features, which have been delivered to us as hereditary asset,
namely as heritage. At the end of the same decade, the term heritage acquired collective
sense and it was used to talk about European Heritage or later about Universal Heritage; in any
case to indicate monuments, objects and places.
If in a sense culture is the evolution of human life in space and time, the “monuments-
remnants” of the human creation of all the times form the prints, the signs, the evidences,
the strides of the human-beings progress within the time: “past narrates its history…”. Thus,
monuments form an undivided entirety with time and place, with man, his surroundings
and his history. These unique and unprecedented fingerprints of human civilization form
the natural and cultural heritage of a place, of a country, of a people, the peculiar features of
a nation which characterize its identity.
Cultural heritage is continuously undergoing numerical strains: anthropogenic and natural
ones, from which the former can be anticipated or/and prevented, whereas the latter not.
The result of these strains is the deterioration of all the materials. In fact, there is no material
which is not to be downgraded. The Second Law of Thermodynamics inevitably intervenes
and finally results in the deterioration of all the materials. For this reason, materials’
deterioration is independent, in practice, on their surroundings and it is taking place in any
environment, even without the direct contact of the materials with the constituents of a
Monitoring, Control and Effects of Air Pollution
154
corrosive environment. Of course, the environment impacts quantitatively the deterioration
or corrosion phenomenon taking place, by means of the impact on the rate of the
deterioration process(es) and the kind of the produced substances.
Air pollution as an anthropogenic reason for materials’ deterioration forms a problem of a
great importance, because it has catastrophic consequences, universally, in health, in the
environment and in the cultural heritage monuments and artifacts. The most famous kind of
atmospheric pollution is the photochemical cloud, whose components are complicated
chemical reactions in atmosphere, which have as principal reactants the hydrocarbons,
nitrogen oxides, sulphur oxides, ozone and ultraviolet radiation.
The conservation of works of art and antiquities is intended to: (a) the preservation of
cultural heritage, (b) the deceleration of their deterioration processes and (c) the
restoration, in some cases, of their form in order to be comprehensible from the public. All
of these purposes can be achieved with: (i) control of the environment, (ii) saving static
interferences on the monument (i.e., structural conservation), which restore the static
sufficiency of the monument, so it does not collapse; (iii) saving interferences on the
surface of the monument (i.e., surface conservation), since all decay actions start from the
surface of the monument. As the Nobel prize-winners Wolfgang Pauli and Enrico Fermi
have felicitously worded: “if God made solids, surfaces were work of Devil”! Indeed,
solid surfaces are not uniform, namely homogeneous, but they present heterogeneity,
which in general arises from the existence of “imperfections” of various origins. These
imperfections are distributed randomly on the surface of the solid material influencing its
potential.
An absolutely serious scientific approach of the problem of confrontation of historic
buildings and monuments decay because of air pollution presupposes the finding of the
relation between “cause and effect”, namely of “how and why air-pollutants interact with
each other and with the solid surfaces”. Then someone could interfere and inhibit a
corruptive action on them, by restricting even minimizing the conditions are being
responsible for. A scientific answer in the previous question presupposes knowledge of
the mechanism of materials surfaces deterioration due to polluted surrounding
atmosphere.
2. A scientific approach to the problem of cultural heritage deterioration due
to air pollution
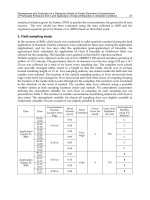
In order to study the action of air pollutants on cultural heritage monuments is important
not only to obtain results by pure chemical analysis of monuments but also to clarify the
mechanism of this action. This mechanism may consist of various steps in series, which are
usually rate processes, with the deposition as the first step, or sometimes equilibrium states,
such as the distribution of air pollutant(s) between the solid surface and the nearby
atmospheric environment through adsorption-desorption phenomena. Thus, a simulation of
various physicochemical actions of air pollutant(s) on the solid surface must be done
followed by the experimental determination of various physicochemical parameters
pertaining to the adsorption-desorption phenomena and possible surface heterogeneous
reactions constants as well. A schematic representation of the possible physicochemical
actions taking place between air pollutant(s) and monuments surface could be the following
one:
Air Pollution and Cultural Heritage: Searching for “The Relation Between Cause and Effect”
155
convection and diffusion currents of gaseous pollutants
A(g) + B(g) C(g)
gaseous phase
A(ads.) B(ads.) C(ads.)
D E G
solid surface
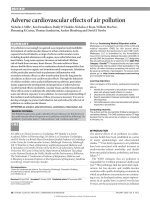
Fig. 1. A model describing the action of air pollutants with the surface of the monument
The model in Fig. 1 is based on the general concept of an open system, consisting of the
exposed solid surface, above the which convection currents and diffusion currents as well
are causing the transport of the gaseous pollutants A(g) and B(g) parallel and perpendicular
to the solid surface, while a possible simultaneous interaction between them may produce
another gaseous pollutant C(g), which may be also adsorbed onto the solid surface or/and
desorbed back to the gaseous phase, or to be undergone a surface heterogeneous reaction,
e.g. dissociation or isomerization. As soon as gaseous pollutants A(g) and B(g) are nearing
the solid surface, adsorption phenomena are taking place, followed either by a surface
chemical reaction between the adsorbed species producing D and E, or a desorption of them
back to the gaseous phase. Therefore, the rate processes describing the above phenomena
are the following ones: (i) diffusion of the pollutants from the gaseous to the solid surface,
(ii) adsorption of them onto the solid surface, (iii) a possible surface heterogeneous reaction
and (iv) desorption of the pollutants back to the gaseous phase.
Therefore an estimation of the crucial relations between environmental factors and
materials’ deterioration cannot only based on simple measurements of various
physicochemical quantities which are validating the materials’ decay, but also “time-
resolved measurements” are necessary to be done, since only the latter can give information
about the actual mechanism of materials’ decay. The latter has, in fact, a “local” character, in
the sense that it depends on the active sites of the solid surface which are available for
adsorption at any particular time t. The achievement of this purpose could be done by using
a dynamic experimental methodology, which could supply us with “real-time”
measurements concerning the whole physicochemical phenomena taking place. To this
direction, the novel method of the Reversed-Flow Inverse Gas Chromatography (RF-IGC)
has already been successfully applied for various interacting systems gas−solid material
or/and gas1/gas2−solid (e.g., gas=HCs, NO
x
, SO
x
, O
3
, etc. and solid=a marble sample, a
ceramic, a pigment, etc.). The results of these applications of RF-IGC in the investigation of
the deterioration mechanism of cultural heritage caused by air-pollutants have already been
published in high impact factor International Scientific Journals and reported in Scientific
Symposiums both in Greece and abroad as well.
Monitoring, Control and Effects of Air Pollution
156
3. A brief overview of various methods and techniques used for studying
environmental impacts on cultural heritage
Cultural heritage is comprised of a great variety of materials including buildings,
monuments, pigments and art objects. Thus analytical data are essential for determining the
state of conservation of the object, as well as the causes and mechanisms of its deterioration.
The analytical methods used in this field of research are identical with those used at the
cutting edge of modern science. Techniques developed for advanced physics and chemistry
can apply to both of ancient and modern materials, since problems encountered in both the
advanced technology and cultural heritage areas are similar. However, there is one essential
difference between the analysis of ancient and modern materials, since an art or ancient
object cannot be replaced and the consumption or damaging of even a small part of it for
analytical purposes must be undertaken only where vital data cannot otherwise be obtained.
Thus, a significant number of different modern instrumental methods for cultural heritage
characterization are available and they have already been used for the investigation of the
weathering effects of air pollution on them, supplying us with information on morphology,
chemical composition and structure of the materials present in the monument,
archaeological artifact, or art object. Depending on the information required and the
procedure involved, the analysis can be considered destructive or nondestructive and it can
be carried out on the bulk or the object surface. In addition, the obtained data can be
panoramic or sequential and the measurements can be directly performed on the work itself
or on a sample, depending on the instrumental technique used. In any case, however, one
should aim at the maximization of information and the minimization of the consumed
volume of the cultural object.
Materials characterization generally includes determination of chemical composition, of
crystalline and molecular structure and of morphology of the object under investigation (A.
Doménech-Carbó et al., 2009).
The major instrumental methods used for characterizing the chemical composition of the
object either in layers or/and in its bulk include: (i) spectroscopic (e.g., XRF, AAS, ICP-AES,
Mössbauer spectroscopy) or/and spectrometric techniques (e.g., ICP-MS, LA-ICP-MS),
which have been widely used in the identification and determination of major, minor and
trace-elements composing either inorganic or organic type cultural objects. The provided
information and the application of each specific technique depends on the range of
electromagnetic radiation and the phenomenon involved in its interaction with the materials
present in the analyzed object (A. Doménech-Carbó et al., 2009; Jenkins, 2000; Putzig et al.,
1994); (ii) activation methods (e.g., NAA, PAA), which are based on the interaction of the
object material with (fast) neutrons or protons and provide information about the major,
minor and trace element composition of the art and archaeological object, which, in turn, can
be used to establish their provenance and temporal origin (A. Doménech-Carbó et al., 2009).
Concerning the characterization of the crystalline and molecular structure of cultural goods,
the analytical techniques most frequently used are grouped into diffraction methods (XRD),
spectroscopic (e.g., UV-VIS, FTIR, DRIFT, ATR, FTIR-PAS, Raman, NMR, EPR) and
spectrometric methods (e.g., MS, DTMS, DPMS, MALDI), chromatographic methods and
thermoanalytical methods (e.g., TG, DTA, DSC) (A. Doménech-Carbó et al., 2009; Jenkins,
2000; Putzig et al., 1994).
The majority of instrumental methods which yield morphological, topological and textural
information of objects are mostly microscopy techniques (e.g., light microscopy (LM),
Air Pollution and Cultural Heritage: Searching for “The Relation Between Cause and Effect”
157
electron microscopy (SEM, ESEM, TEM) and atomic force microscopy (AFM)) (A.
Doménech-Carbó et al., 2009). By using light microscopy (either the low-magnification or
the high-magnification technique), characteristics of materials such as the percentage of
aggregates, pores, temper or specific minerals, pore or grain size and grain shape as well can
be determined, allowing for a better analysis and interpretation of composition, technology,
provenance, deterioration and conservation. In addition, the use of electrons instead of light
in these instruments permits the characterization of the finest topography of the object
surface and additional analytical information can be obtained. The AFM maps the
topography of a substrate by monitoring the interaction force between the sample and a
sharp tip attached to the end of a cantilever, so that the morphology of the surface of the
studied solid sample can be reproduced at nanometer resolution (A. Doménech-Carbó et al.,
2009). In addition, whenever a more elaborate surface analysis is pursued, methods based
on the interaction of the incident energy provided by a microbeam of photons, electrons, or
particles with the atoms or molecules located in the surface of the object sample are used. In
such studies, the concept of “surface” should not considered in a strict sense, since the
investigation concerns a depth in the range of a few μm on the solid surface. Such surface
analysis techniques most frequently used in the characterization of cultural objects include
high-resolution spatially resolved microspectroscopes, such as micro-FTIR (μFTIR), micro-
Raman (μRaman), laser-induced breakdown spectroscopy (LIBS), micro-XRF (μXRF), XPS,
PIXE, etc (A. Doménech-Carbó et al., 2009; Giakoumaki et al., 2007; Jenkins, 2000; Putzig et
al., 1994).
It is worthy of noting that the time-resolved versions of the previous spectroscopic methods
(TRS), although it is not new, has opened up a wide range of nascent application areas,
including test and measurement in materials characterization. Though the basic technique
differs little from the traditional spectroscopic methods, it allows us to measure the
temporal dynamics and the kinetics of photophysical processes. The advantage of TRS over
traditional spectroscopy is that it enables scientists to make more exact measurements of a
sample’s properties (Bhargava and Levin, 2003; Isnard, 2006; Miliani et al., 2010; Osticioli et
al., 2009; Putzig et al., 1994; Quellette, 2004).
In what follows some representative examples of various analytical techniques commonly
used in this field are reported for a better understanding of the particular contribution of
each method used.
• FTIR-studies in materials decay: Infrared radiation is usually defined as that
electromagnetic radiation whose frequency is between ~ 14300 and 20 cm
-1
(namely, ~
0.7 and 500 μm). Within this region of the electromagnetic spectrum, chemical
compounds absorb IR-radiation providing there is a dipole moment change during a
normal molecular vibration, molecular rotation, molecular rotation/vibration, or a
lattice mode or from combination, difference and overtones of the normal molecular
vibrations. The frequencies and intensities of the IR-bands exhibited by a chemical
compound uniquely characterize the material and its IR-spectrum can be used to
identify and quantify the particular substance in an unknown sample. Thus, FTIR and
μFTIR-spectroscopy is useful for the study of degradation forms of cultural heritage, as
it permits to identify the degradation phases and to establish the structural relationship
between them and the substrate. A representative example of application of this
method concerns the results obtained on marble from a Roman sarcophagus, located in
the medieval cloister of St. Cosimato Convent in Rome (Italy) and on oolitic limestone
Monitoring, Control and Effects of Air Pollution
158
from the façade of St. Giuseppe Church in Syracuse (Sicily). The IR-spectra of these
samples showed the presence of degradation products composed of calcium sulphate
hydrate, commonly called gypsum (CaSO
4
·2H
2
O) and calcium oxalate, as well as the
presence of organic matter probably due to conservation materials. The qualitative
distribution maps of degradation products, obtained by means of micro-FTIR (μFTIR)
operating in ATR-mode, revealed that the degradation process is present deep inside
the stones also if it is not visible macroscopically (La Russa et al., 2009).
• SEM-studies in deterioration of glass: Deterioration of glass includes both chemical and
structural changes. The initial stage of attack is a process that involves ion-exchange
between alkali ions, which are present in the silicate structure of the glass, such as Na,
K, and hydrogen from the environment. This leads to the formation of a leached or so-
called “gel layer” in which alkaline elements are depleted. In case of atmospheric
attack, the leached ions will interact with components from the ambient air such as
carbon dioxide and sulphur dioxide which will lead to a crust formation including
products such as a calcite (CaCO
3
) and gypsum (CaSO
4
·2H
2
O) (Adriaens, 2005).
• A combination of stereo-microscope, XRD and ICP-OES techniques was used (Elgohary,
2008) for the investigation of stone degradation due to air-pollution in Amman citadel
of Liwān. The whole investigation and specific measurements showed that the damage
produced on the surfaces of various calcareous stone samples of this region, either
being physical or chemical, such as crustation, crystallization, dirties accumulations and
other deteriorating forms, was essentially the result of the synergistic action of rain
water and the various gaseous pollutants at prevailed in the region under study.
4. Gas chromatographic instrumentation for studying the impacts of air
pollution on cultural heritage
4.1 A brief overview of gas chromatographic techniques
Chromatography is a separation method that combines separation and analysis. It is well-
known that chromatographic separations are based on physicochemical processes such as
diffusion, adsorption and chemical equilibrium of the studied solutes distributed among the
mobile and the stationary phase. Gas chromatography (GC) is a technique that is used not
only to separate substances from each-other, but also to study physicochemical properties.
Some of these properties measured are concerned with the moving gaseous phase, giving
emphasis on the determination of the properties of the solutes; for instance, diffusion
coefficients of solutes into the carrier gas. Gas chromatographic analysis suffers from the so-
called broadening factors, the majority of which is related to non-fulfilment of the
assumptions under which the central chromatographic equation embraced by Van Deemter
is derived; namely, the non-negligible axial diffusion of the solute gas in the
chromatographic column, the non-linearity of the distribution (e.g. adsorption) isotherm
and the non-instantaneous equilibration of the solute distribution among the mobile and the
stationary phase. However, through these broadening factors gas chromatography is
capable of making physicochemical measurements, which lead to very precise and accurate
results, by using relatively cheap instrumentation and very simple experimental
arrangements. Among the most widely used gas chromatographic methods for
physicochemical measurements are the traditional techniques of elution development,
frontal analysis and displacement development under constant gas flow-rate (Cazes, 2009).
Air Pollution and Cultural Heritage: Searching for “The Relation Between Cause and Effect”
159
The majority of gas chromatographic physicochemical measurements has been done by the
inverse gas chromatography (IGC) technique, which uses the same experimental procedures
employed in direct gas chromatography, but it focuses its interest on the stationary phase
and its behavior towards known probe solutes; for instance, the catalytic properties of the
solid stationary phase for reactions between gases. As in direct GC, the results used in IGC
to derive information about the physicochemical properties of the stationary phase are
based on net retention volumes, broadening of elution peaks and further on the analysis of
the statistical moments of the peaks. The usual inverse gas chromatography (IGC), having
the stationary phase of the system as the main object of investigation, is an integration
method and not a time-resolved chromatography, since it totally ignores the heterogeneity
of the adsorbing solid surface, it does not take into account the non-linearity of isotherms,
the non-negligible axial diffusion in the chromatographic column and the kinetics of mass
transfer across the gas/solid boundary (Cazes, 2009; Katsanos & Karaiskakis, 2004;
Thielmann, 2004).
All the afore-mentioned chromatographic systems are not usually in true equilibrium
during the retention period, so that extrapolation to infinite dilution and zero carrier-gas
flow-rate is required to approximate true equilibrium parameters. Moreover, they have not
a time-resolved character of the experimental procedure, since they provide measurements
for physicochemical properties statistically weighed over time and enclosed by the
chromatographic elution peaks; some of these properties are indeed independent of time,
but there are other properties strongly dependent on the time variable. A new version of
IGC is a flow perturbation method, the so-called Reversed-Flow Inverse Gas
Chromatography (RF-IGC), which has been introduced in 1980 by N. A. Katsanos et al., and
since then it is extensively used as a tool to study various physicochemical processes
(Katsanos, 1988; Katsanos & Karaiskakis, 2004). It is a differential method depending neither
on retention times and net retention volumes, nor on broadening factors and statistical
moments of the elution bands. In addition, the results of RF-IGC do not need extrapolation
to infinite dilution and zero carrier gas flow rate to approximate true physicochemical
parameters. All the determinations achieved by RF-IGC are based on rate measurements
over an extended period of time, thus constituting a time-resolved chromatography
(Katsanos & Karaiskakis, 2004).
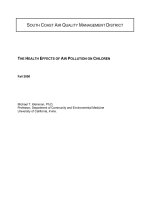
4.2 The novel method of RF-IGC: physical description and experimental setup
The Reversed-Flow Inverse Gas Chromatography (RF-IGC) method: (i) abandons the
main role of carrier-gas in classical gas chromatography and substitutes it with gaseous
diffusion currents inside a new diffusion column perpendicular to the conventional
chromatographic current (sampling column), the latter being a little far from the solid bed
in which all the desired physicochemical phenomena take place in the absence of gas
running; (ii) by means of a four or six port valve the direction of carrier-gas flow is
reversed from time to time for short time intervals, thus creating extra narrow
chromatographic peaks which are deposited onto the conventional chromatographic
signal. All the above described are schematically presented in Figs. 2 and 3. By
introducing these modifications, the carrier gas flow does not intervene with the
measurement of the desired physicochemical quantities, which describe step by step the
entire physicochemical phenomena taking place inside the diffusion column where no
carrier gas flows but only a static pressure of it exists.
Monitoring, Control and Effects of Air Pollution
160
Fig. 2. Experimental setup of RF-IGC
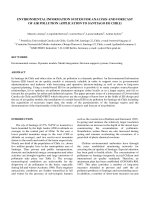
sample peaks
baseline
Fig. 3. A typical chromatogram obtained by RF-IGC
The extra chromatographic peaks (Fig. 3) obtained by repeatedly reversing the carrier gas
direction for short time intervals are termed sample peaks, because they constitute samples
of the phenomena taken from the region of their occurrence at various times, like small
samples taken from a reaction occurring in a usual chemical flask containing the reactants.
They have different heights depending on the time at which each flow reversal was made.
Since this happens at various chosen times, it constitutes a time-resolved experiment like
those in chemical kinetics. The experimental details by means of which the reversals are
Air Pollution and Cultural Heritage: Searching for “The Relation Between Cause and Effect”
161
effected are shown in Fig. 2. From the series of the sample peaks obtained under various
conditions, several physicochemical quantities have been determined and published
(Agelakopoulou et al., 2009; Arvanitopoulou et al., 1994; Bakaoukas et al., 2005; Floropoulou
et al., 2009; Katsanos et al., 1998,2003,2004; Metaxa et al., 2009a,2009b,2009c; Roubani-
Kalantzopoulou, 2004,2009; Roubani-Kalantzopoulou et al., 1996; Sotiropoulou et al., 1995).
The sample peaks are predicted theoretically by the so-called chromatographic sampling
equation (1), which describes the concentration-time curve of the sample peaks created by
the flow reversals and has been derived using mass balances, rates of change, etc., and
integrating the resulting partial differential equations under given initial and boundary
conditions. It gives the concentration of the solute at the junction of the sampling and the
diffusion column x=l’ or z=0 of Fig. 2, for different values of the time variable. The sampling
equation predicts the sample peaks theoretically and its predictions coincide with the
experimental sample peaks shown in Fig. 3, the only difference being that the peaks
predicted are square, whereas those actually found are not square owing obviously to non-
ideality. In fact, the experimental peaks can be made as narrow as we want, since the width
at their half-height is equal to the duration of the carrier-gas flow reversal. The equation
describing the height, H, of the sample peaks as a function of time, t, when each flow-
reversal was made has the form:
()
1/
(’,) exp ,
M
ii
i
H
g
cl t A B t=⋅ =
∑
(1)
where i runs from 1−4, M is the response factor of the detector used (M=1 for a flame
ionization detector), g is the calibration factor of the detector (in cm
4
· mol), c(l’,t) is the
measured sampling concentration of the gaseous analyte (in mol· cm
-3
) at x=l’ or z=0 of Fig.
2, and A
i
, B
i
are functions of the physicochemical quantities pertaining to the various
phenomena occurring in the solid bed region. The detailed content of A
i
and B
i
, as found
from a non-linear least-square analysis of the plot of H
1/M
versus time t, leads to the clear
determination of the physicochemical quantities of the mathematical model used; for
instance, catalytic reaction constants, adsorption-desorption rate constants, gas and surface
diffusion coefficients, local adsorption isotherms, local adsorption energies, local adsorption
energy probability density functions, local lateral molecular interactions and adsorption
rates, as will be explained for the action of various gaseous pollutants on calcareous stones,
marbles and statues in the next sections. In addition, a brief account of the general principles
which construct the mathematical model of the method of RF-IGC will be given in the
following section.
4.2.1 Mathematical model
The theoretical analysis for the measurement of the time resolved physicochemical
parameters by RF-IGC is based on the following equations:
i.
two mass balances for the gaseous concentration of the analyte in the regions y and z, c
y
(mol· cm
-3
) and c
z
(mol· cm
-3
), respectively;
2
*
21
2
()
yy
S
SS a
pp y
y
cc
a
Dkcckc
ta
y
∂∂
∂
∂
−
=− −− (2)
Monitoring, Control and Effects of Air Pollution
162
2
1
2
Z
Z
a
pp
Z
c
c
Dkc
t
z
∂
∂
∂
∂
=− (3)
ii.
one rate of change of the adsorbed concentration c
S
(mol· g
-1
) of the analyte in the
region y and
()
*
12
S
SS S
c
kcc kc
t
∂
∂
−
=−− (4)
iii.
one local adsorption isotherm, which correlates the adsorbed equilibrium concentration
c
S
* (mol· g
-1
) on the solid surface with the non-adsorbed concentration c
y
:
()
21
0
()
t
y
S
Sy
SS
a
m
cyLkcd
aa
δττ
∗
=−+
∫
(5)
k
app.
: is the apparent rate constant of a first- or pseudofirst-order reaction of the gaseous
adsorbate in the gas phase (in s
-1
).
D
2
: is the diffusion coefficient of this gaseous adsorbate into the gas phase in section y (in
cm
2
s
-1
).
k
-1
: is the rate constant for desorption of the solute from the solid bulk (in s
-1
).
c
S
: is the adsorbed concentration of the gaseous adsorbate adsorbed on the solid at time t (in
mol g
-1
).
k
2
: is the rate constant of a possible first-order or pseudofirst-order surface reaction of the
adsorbed solute (in s
-1
).
With the initial conditions
2
(0, ) ( )
y
y
m
cy yL
a
δ
=−, and (0, ) 0
S
cy= , m being the amount
(mol) of the gaseous adsorbate introduced as a pulse at
y=L
2
, all the required adsorption
parameters are calculated from the experimental data – pairs (
H, t) and various geometrical
characteristics of the diffusion column and the solid bed – on the basis of the following
equations, by means of a suitable PC-program based on non-linear least-squares regression
analysis (Agelakopoulou et al., 2009; Arvanitopoulou et al., 1994; Bakaoukas et al., 2005;
Floropoulou et al., 2009; Katsanos et al., 1998,2003,2004; Metaxa et al., 2009a,2009b,2009c;
Roubani-Kalantzopoulou, 2004,2009; Roubani-Kalantzopoulou et al., 1996; Sotiropoulou et
al., 1995):
a.
local adsorption energies, ε
()()
0
ln ln lnRT KRT RT K
ε
⎡
⎤
=−−
⎣
⎦
(6)
b.
local adsorption equilibrium concentrations, c
S
*
and c
y
()
3
1
1
1
exp 1
y
i
si
szi
i
A
L
ck Bt
gD B
α
υ
α
∗
=
⎡
⎤
=−
⎣
⎦
∑
(7)
()
3
1
1
1
exp
y
ii
i
L
cABt
gD
υ
=
=
∑
(8)
Air Pollution and Cultural Heritage: Searching for “The Relation Between Cause and Effect”
163
c. local adsorption isotherm, θ
t
max
s
t
s
c
c
θ
∗
∗
= (9)
max
11
1
s
y
s
c
KRT c
c
ϑ
θ
ϑ
∗
∗
=− ⋅ ⋅
(10)
d.
local monolayer capacity,
maxs
c
∗
:
max
s
y
ss
cc
cc
KRT
∗
∗∗
∂∂
=+
(11)
e.
probability distribution function for adsorption energy, φ(ε; t):
()
()
2
max
//
/
(;)
/
ssy
s
y
s
KRT c t c c t
cc
t
KRT t KRT
cRT
θ
ϕε
∗∗
∗
∗
⎡
⎤
∂∂+∂ ∂∂
∂∂
⎢
⎥
=−
⎢
⎥
∂∂
⎢
⎥
⎣
⎦
(12)
f.
dimensionless parameter, β, for lateral interactions:
zRT
ω
β
= (13)
where:
ω is the lateral interaction energy, z the number of neighbors for each adsorption site
and
β is a dimensionless parameter. Thus, the “θzω” is the added to ε “differential energy of
adsorption due to lateral interactions
”, namely:
zRT
θω
β
θ
= (14)
All these relations are based on the Jovanovic local isotherm Eq. (15):
(, ,) 1 exp( )
p
TKp
θε
=− −
(15)
where
0
()exp(/ )KKT RT
ε
=
(16)
R being the gas constant, and
3
0
3/2 5/2
()
()
(2 ) ( )
S
g
T
h
K
bT
mkT
υ
π
=⋅
(17)
where:
m is the molecular mass of the adsorbate; k is the Boltzmann’s constant; h the
Planck’s constant; and the ratio
u
s
(T)/b
g
(T) of two partition functions, namely that of the
adsorbed molecule,
u
s
(T), and that for rotations-vibrations in the gas phase b
g
(T). This ratio
is taken as a unity, approximately, as was done before (Agelakopoulou et al., 2009;
Arvanitopoulou et al., 1994; Bakaoukas et al., 2005; Floropoulou et al., 2009; Katsanos et al.,
Monitoring, Control and Effects of Air Pollution
164
1998,2003,2004; Metaxa et al., 2009a,2009b,2009c; Roubani-Kalantzopoulou, 2004,2009;
Roubani-Kalantzopoulou et al., 1996; Sotiropoulou et al., 1995).
The contribution of lateral molecular interactions in the overall phenomenon of adsorption
and desorption is taken into account, by correcting Eq. (16) to include this type of energy:
()
0
exp exp
ii
KK K
RT
ε
β
θ
β
θ
⎛⎞
′
=+=
⎜⎟
⎝⎠
(18)
Thus, Jovanovic isotherm described in Eq. (15), is modified accordingly, as well as any other
equation based on it.
4.2.2 Applications of RF-IGC in studying physicochemical phenomena being
responsible for materials’ decay
The differential time-resolved RF-IGC method provides a new pathway for solids
characterization, by supplying us with experimental local values of important
physicochemical quantities, such as adsorption energy, adsorption isotherm, monolayer
capacity, non-adsorbed concentration of gaseous analyte in equilibrium with the solid
surface, probability density function and energy owing to lateral molecular interactions,
which pertain to the particular surfaces. It is reminded that the term “local” means “with
respect to time t”, namely it regards only adsorption sites active at time t.
In the following sections, some representative results are described, which have already
published in high impact International Scientific Journals and announced in Scientific
Symposiums, concerning cultural heritage monuments in Greece (Agelakopoulou et al.,
2009; Arvanitopoulou et al., 1994; Bakaoukas et al., 2005; Floropoulou et al., 2009; Katsanos
et al., 1998,2003,2004; Metaxa et al., 2009a,2009b,2009c; Roubani-Kalantzopoulou, 2004,2009;
Roubani-Kalantzopoulou et al., 1996; Sotiropoulou et al., 1995).
4.2.2.1 The local character of adsorption in materials decay: chemisorption or physisorption?
Due to their different crystallographic properties, natural stones exhibit different types of
structural surfaces−each one with its own adsorption energy distribution function−which
determines the variations in the observed weathering, deterioration patterns and processes
of these materials. The adsorption of atoms or molecules onto these heterogeneous surfaces
may occur either by the formation of strong chemical bonds (chemisorption) or via weaker
physical attachment (physisorption) of the adsorbed molecules. It should be noted that
although the majority of the reported results regards experiments done at relatively low
temperatures, where physisorption is more expected, the structural materials of samples
used (e.g., statues from Museums) are energetically upgraded, as a consequence of the
whole process they have been undergone from the moment of their natural formation until
the moment of their use as materials for creating statues. Thus, in the presence of an
aggressive environment a chemisorption process is favorable; by means of RF-IGC
experiments, chemisorption is observed taking place in the beginning of the experiments
(Agelakopoulou et al., 2009; Floropoulou et al., 2009; Katsanos et al., 1998,2003,2004; Metaxa
et al., 2009a,2009b,2009c; Roubani-Kalantzopoulou, 2004,2009). Furthermore, any kind of
adsorption process (chemisorption or/and physisorption) takes place in different extent,
because of the development of molecular lateral interactions (attractive or/and repulsive)
between the adsorbed species, in addition to the adsorbent-adsorbate interactions, the latter
being the predominant type of forces characterizing chemisorption. In case of chemisorption,
Air Pollution and Cultural Heritage: Searching for “The Relation Between Cause and Effect”
165
the lateral interactions between adsorbates are mostly repulsive, resulting in random
topography. The adsorbent-adsorbate interactions leading to chemisorptions are chemical
bond forces.
The active sites, where chemisorption takes place, are included in the region A and
correspond on the minima of potential energy of the surface, namely the maxima of
adsorption energy. The distribution of the adsorbed molecules on these active sites is
random. These sites correspond to high values of coverage θ and adsorption energy ε. The
regions B and C include active centers that correspond to adsorption at sites of lower energy,
ε and surface coverage, θ. They are characterized by a patchwise or/and an island topography
of the adsorbed molecules and created by weak forces of Van der Waals type between the
admolecules. Adsorption sites in B and C are not on a free surface, but they are created
through the lateral interactions with molecules have been already adsorbed. When
chemisorption is taking place, high adsorption energy values are observed, since they
correspond to the minima of the potential energy of the surface. Contrary to this,
physisorption entails low adsorption energy values, since it usually corresponds to the
maxima of the surface potential (saddle points) [Rudzinski & Everett, 1992]. The decrease of
adsorption entropy values verifies that adsorption occurred. All the above are depicted in
Figs. (4a)-(4d). The “topography” of the solid surface is described experimentally through
the time-resolved analysis of the energy distribution function φ(ε;t) versus t, where
distinguished regions corresponding to different kinds of active sites produced at different
times are observed, as the three types of active sites recorded in Figs. (4c) and (5c). The
number of distinct peaks recorded corresponds to different kinds of active sites appear and
the area under these peaks corresponds to the collection of adsorbed species onto active sites
with a definite mean energy value; in fact, this reflects or/and explains the “local” character
of adsorption. It is worthy of noting that these results coincide with those extracted with
simulation methods for the submonolayer adsorption of argon on the surface of crystalline
rutile (Bakaev& Steele, 1992).
In the absence of SO
2
, an adsorption-induced surface reconstruction creates new adsorption
sites, as it is indicated in Figs. 4 (a, b, d) and Figs. 5 (a, b, d). The above observed surface
reconstruction [Agelakopoulou et al., 2009; Floropoulou, 2009; Metaxa et al., 2009a, 2009b]
may be attributed to one or more of the following reasons:
i.
An entropy increase owing to the close approach of adsorbates in various configurations
which increase the surface entropy and unveil new active sites for adsorption on the
solid surface [Jansen, 2008].
ii.
The creation of sub-surface states which does not affect the surface free-energy
[Christmann, 1995].
iii.
A co-variation in chemisorption and physisorption so that an equilibrium has been
established between adsorption and desorption.
The most possible reason in this case seems to be the entropic one, because of the
momentary increment of the adsorption entropy observed in Fig. (4d) as a local maximum,
which is followed by a new slight decrease in the adsorption entropy thus confirming the
readsorption induced. Obviously, the third kind of active sites observed for the adsorption
of C
2
H
2
on the surface of the statues (L291 of Kavala and L1991 of Philippi), in the absence
of SO
2
, resulted from this surface-reconstruction.; in the presence of SO
2
, only two different
types of active sites are observed, as Fig. (4c) indicates. Although the above-mentioned
explanation for this surface reconstruction and readsorption induced concerns, in fact, the
formation of islands without attractive interactions [Jansen, 2008], another surface
Monitoring, Control and Effects of Air Pollution
166
reconstruction process which favours the formation of islands due to attractive lateral
interactions have been proposed by other researchers (Velasco & Rezzano, 1999). The latter
explanation could be also accepted in our case, in the sense that this island-formation occurs
in higher time-values and after θ=1, at saddle-points positions (Roubani-Kalantzopoulou,
2004, 2009; Agelakopoulou et al., 2009; Metaxa et al., 2009a).
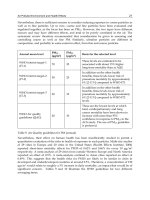
(a) (b)
(c) (d)
Fig. 4. Time-resolved analysis for the adsorption isotherms (4a), adsorption energies (4b),
distribution energy functions (semi-logarithmic plot) (4c), and adsorption entropies (4d),
concerning the systems C
2
H
2(g)
/(SO
2(g)
)/L291 Statue of Kavala, Greece.
Air Pollution and Cultural Heritage: Searching for “The Relation Between Cause and Effect”
167
(a) (b)
(c) (d)
Fig. 5. Time-resolved analysis for the adsorption isotherms (4a), adsorption energies (4b),
distribution energy functions (semi-logarithmic plot) (4c), and adsorption entropies (4d),
concerning the systems C
2
H
2(g)
/(SO
2(g)
)/L1991 Statue of Philippi, Greece.
4.2.2.2 The role of synergy in the adsorption phenomena
The synergistic effect of a second pollutant has also been examined and is very obvious how
it operates in each case. For example, in the presence of SO
2
lower values for c*
ssmax
are
determined for the adsorption of ethane on the surface of the ancient statue L1991 taken
from the interior of the Museum of Philippi, near Salonica, in Greece. This fact could be
Monitoring, Control and Effects of Air Pollution
168
(a) (b)
(c) (d)
Fig. 6. Time-resolved analysis of local molecular capacity, c*
ssmax
, for the systems: (a)
C
2
H
2
/(SO
2
)/L291 statue of Kavala museum, (b) C
2
H
6
/(SO
2
)/L1991 statue of Philippi
museum and (c,d) C
2
H
4
/(SO
2
)/Pentelic marble.
attributed either to an oxidation of the hydrocarbon molecules from SO
2
in the gaseous
phase before adsorption takes place or to a competitive adsorption of SO
2
-molecules
towards ethane molecules on the active sites of the statue surface. This fact is confirmed by
Fig. 5d, where the number of active sites on the statue surface dramatically decreases in the
presence of sulphur dioxide. On the other hand, an opposite behavior is observed
concerning the synergistic action of sulphur dioxide on the adsorption of acetylene on the
Air Pollution and Cultural Heritage: Searching for “The Relation Between Cause and Effect”
169
surface of the ancient statue L291 - a pure calcite - from the exterior of Kavala Museum and
on the adsorption of ethylene on the surface of a recently cut sample from Penteli mountain
ore in Dionysos, Greece. The latter is also confirmed by Fig. 4d, where the number of active
sites available for the adsorption of acetylene on the surface of L291 statue increases
significantly in the presence of sulphur dioxide. Analogous observations have been drawn
for the adsorption of ethane, ethene and ethyne (acetylene) on the surface of another ancient
statue sample (L351), which was taken from the interior of the Kavala Museum and it was a
pure dolomite, as an X-Ray diffraction analysis of this sample showed. Finally, the amounts
of the hydrocarbons which totally adsorbed (c*
s
) on both of the statues from Museum of
Kavala was calculated, with or without the presence of sulphur dioxide (Agelakopoulou et
al, 2009). The results show that with the presence of SO
2
an increment of the estimated total
adsorbed amount of acetylene is noted for the calcite’s statue (L291) of Kavala, contrary to
the other hydrocarbons where the presence of sulphur dioxide causes only a negligible or no
effect. As regards the dolomite’s statue (L351) of Kavala, the synergistic effect of SO
2
is more
profound. First of all, the totally adsorbed amount of each hydrocarbon on L351 statue,
either with or without the presence of sulphur dioxide, is higher than in case of L291 statue,
a fact that is ascribable to the higher porosity of the former, which is dolomite, whereas the
latter is calcite. Secondly, the higher adsorbed amount found for ethane in the absence of SO
2
,
something is reversed in the presence of SO
2
and concerns acetylene. In addition, the
synergistic effect of SO
2
decreases from acetylene to ethene and ethane; obviously, the order
of the bond of hydrocarbon has a significant role in the adsorption phenomenon.
4.2.2.3 The influence of the hydrocarbon’s bond on the adsorption phenomena
For the same solid adsorbent (statue, pure oxide, etc.), the influence of the type of the bond
in the molecule of the hydrocarbon is related with its molecular weight which reflects on the
diffusion coefficient of the molecule. As the molecular weight of the hydrocarbon increases,
the corresponding diffusion coefficient decreases. This becomes obvious in the following
diagram (Fig. 7) which depicts the non-adsorbed concentration, c
y
, of the hydrocarbon as a
function of time t:
Fig. 7(a). Time-resolved analysis of the local non-adsorbed equilibrium concentration, c
y
, of
each hydrocarbon adsorbed on the various solid substrates: (a) marble of Penteli, (b) L1991
statue of Philippi, (c) L291 statue of Kavala and (d) L351 statue of Kavala.
Monitoring, Control and Effects of Air Pollution
170
Fig. 7(b, c, d). Time-resolved analysis of the local non-adsorbed equilibrium concentration,
c
y
, of each hydrocarbon adsorbed on the various solid substrates: (a) marble of Penteli,
(b) L1991 statue of Philippi, (c) L291 statue of Kavala and (d) L351 statue of Kavala.