Wiley Wastewater Quality Monitoring and Treatment_12 doc
Bạn đang xem bản rút gọn của tài liệu. Xem và tải ngay bản đầy đủ của tài liệu tại đây (576.33 KB, 19 trang )
JWBK117-3.2 JWBK117-Quevauviller October 10, 2006 20:27 Char Count= 0
198 Treatability Evaluation
Table 3.2.5 N/COD ratios and calculations of the single fractions of TKN
Values of N/COD ratios (g N/g COD)
Symbol of
Calculation N/COD ratio Typical value Range
S
ND
= i
NSS
· S
S
i
NSS
0.02 —
X
ND
= i
NXS
· X
S
i
NXS
0.04 0.02–0.06
S
NI
= i
NSI
· S
I
i
NSI
0.01 0.01–0.02
X
NI
= i
NXI
· X
I
i
NXI
0.03 0.01–0.06
N
BH
= i
XB
· X
BH
i
XB
0.086 —
3.2.5 METALLIC COMPOUNDS
The concentration of metals in raw wastewater can differ significantly depending
on the domestic, commercial or industrial activities collected by the sewerage. The
main interest is in metals characterized by potential toxic impact on health or the
environment, such as Cd, Cr , Cu, Hg, Ni, Pb and Zn. The load of these components at
the inlet of a WWTP can be several times greater in industrial sites than in residential
areas far from industrial activities. Urban run-off during storm events is also a
source of metals and other pollutants, and contributes to the total influent load into a
WWTP.
3.2.5.1 Treatability of Metallic Compounds
Metals inrawwastewater areremoved inWWTPs through twodifferent mechanisms:
r
Primary sedimentation: metals are separated as insoluble precipitates or adsorbed
on settled particulate matter and then extracted with primary sludge. In contrast
the removal of metals in soluble form is negligible.
r
Secondary treatment: during the biological process metals are integrated into acti-
vated sludge or biofilm (adsorbed on flocs or in extracellular polymers). They are
removed at the same efficiency as the sludge solids in the secondary settler and
extracted together with the excess sludge.
Some values for metal removal in primary and secondary treatments are summa-
rized in Table 3.2.6 (European Union, 2001).
Similar patterns of removal percentages are observed in primary and secondary
treatments. Lower removal is observed in both cases for Ni due to its high solubility
that limits the presence of Ni in the particulate matter and sludge. In contrast Pb, one
JWBK117-3.2 JWBK117-Quevauviller October 10, 2006 20:27 Char Count= 0
Metallic Compounds 199
Table 3.2.6 Percentage of metals removed in WWTPs, calculated with respect to the
concentration in the influent raw wastewater
Removal in primary Removal in primary +
Metal treatment (%) secondary treatment (%)
Ni 24 40
Cd 40 65–75
Cr 40 75–80
Zn 50 70–80
Cu 50 75–80
Hg 55 70–80
Pb 55 70–80
of the least soluble metals, shows higher removal in both the primary and secondary
stages. For the majority of metals a significant percentage of the influent load, up to
70–80 %, is transferred into primary and secondary sludge. As a consequence the
concentration of metals in dry sludge (measured as TSS) reaches levels of several
thousand mg/kg TSS, about 1000 times higher than the concentration of metals in
raw wastewater.
In synthesis, the majority of metals entering the WWTPs with the raw waste-
water is transferred to the sludge extracted from primary and secondary treatments.
Depending on the metal solubility, a smaller amount, ranging from 20 to 40 %
(60 % only for Ni), is however discharged in water bodies with the final effluent.
With regards to the fate of sludge separated by settlers, the stabilization processes
through aerobic or mesophilic anaerobic digestion cause the biological reduction of
the volatile solids (30–50 %) and the specific metal content increases, metals being
conserved during stabilization. Due to the presence of metals the final disposal of
sludge may be problematic especially in the case of accumulation in soils interfering
with the long-term sustainable use of sludge on land.
For the prediction of the removal of metals from raw wastewater and the parti-
tioning into final effluent and sludge, mechanistic approaches have been proposed
(Monteith et al., 1993). On the basis of influent wastewater characterization (flow
rate, metal concentrations) and the layout of the WWTP (unit volumes, operational
conditions) the metal concentration in primary sludge, secondary sludge and final
effluent can be predicted. The calculation is performed on the basis of mass balances
by considering the main chemical and physical mechanisms (precipitation of soluble
metals into a settleable form, sorption onto settleable solids, surface volatilization).
In the model the mass of primary and biological sludge produced by primary sed-
imentation and secondary treatment is calculated and partitioning coefficients are
introduced in the model for the estimation of the metal concentrations in the soluble
and solid phases. A similar approach can be applied also for estimating the fate of
organic contaminants instead of metals in WWTP. Modelling can be performed both
under steady-state or dynamic conditions.
JWBK117-3.2 JWBK117-Quevauviller October 10, 2006 20:27 Char Count= 0
200 Treatability Evaluation
3.2.6 FINAL CONSIDERATIONS
WWTPs are effective in the reduction of most pollutants present in wastewater (such
as organic matter, nutrients, potentially toxic elements or some micropollutants), be-
fore the discharge of the treated effluents in surface waters. In WWTPs several
biological and physico-chemical processes can be implemented, but the main path-
ways for pollutants removal are: (1) the biological oxidation by activated sludge or
biofilm systems; or (2) the accumulation of contaminants in excess sludge.
In this chapter the main categories of pollutants present in influent wastewater
and their fate in WWTPs has been discussed. The assessment of the treatability of a
specific wastewater in WWTPs is strictly dependent on the fate of contaminants in
the treatment stages. The amount of pollutants removed in conventional WWTPs or
passing into the effluent has been indicated depending on the category of pollutants,
separated into organic compounds, organic micropollutants, nutrients and metallic
compounds. These main categories were identified in order to make an aggregation
of the large number of individual pollutants; a much longer and detailed report
would be required for the explanation of the fate of each single element. Therefore
the present description is not exhaustive for understanding the fate of each single
compound; the objective of this chapter is to explain the main pathways in WWTPs
for macro-categories of pollutants.
The wastewater characterization can be investigated more or less in depth de-
pending on the particular needs in management of WWTPs, the requirement for
discharge, and the practicalities of operators that make the measurements. The in-
creasing detail in characterization and control of effluent wastewater from WWTPs
coupled with the more stringent limits for discharge in receiving water bodies, ne-
cessitates a more complex and sophisticated monitoring. This causes considerable
additional effort and expense to obtain a high degree of knowledge about the type
and the concentrations of pollutants and micropollutants in influent and effluent
wastewaters.
With regards to COD fractionation the routine measurement of all the parameters
indicated in Section 3.2.2.1, according to the respirometric approach (described in
Section 3.2.2.2), is extremely time-consuming because of the time required for the
respirometric tests and the time need for data elaboration. Therefore, COD fraction-
ation could be done only occasionally in a WWTP and the percentages obtained
can be assumed as typical for a specific wastewater. Of course a periodic valida-
tion of fractionation is required. Alternatively, the simplified procedure described
in Section 3.2.2.3 can be applied, which is more approximate but is advantageously
fast to use. A more detailed characterization, performed by using the respirometric
approach, could be required in order to observe daily, weekly or seasonal variation or
fluctuation occurring in the COD fractions. In the case of industrial sources, shock
loadings are by their nature difficult to predict.
In the case of N fractionation, the calculation described in Section 3.2.4.1 can be
easily done thanks to its dependence on COD fractionation.
JWBK117-3.2 JWBK117-Quevauviller October 10, 2006 20:27 Char Count= 0
References 201
In general a good characterization of COD and N in the influent wastewater
is very important to understand the fate of these components in WWTPs and to
predict the quality of the effluent wastewater before discharge in receiving water
bodies.
With regards to metals or nutrients, they are routinely measured in wastewater
and sludge and an extensive knowledge about these components is usually available
in WWTP management. The measurement is done often routinely in influent and
effluent wastewater due to the relative ease of the analysis and the moderate expense
involved.
In contrast, organic micropollutants, such as PAHs, PCBs, PCDD/PCDFs or phar-
maceuticals, are rarely monitored because of the high cost of analysis and the need
for specialized laboratories and, sometimes, the lack of unified and standardized
methodologies. Furthermore, the limitation in the evaluation of the fate of organic
micropollutants and potentially toxic elements is mainly related to the lack of studies
on mass balance in WWTPs and with regards to partitioning in water and sludge.
Further research is needed to improve knowledge in this field.
REFERENCES
APHA, AWWA and WPCF (1998) Standard Methods for the Examination of Water and Wastew-
ater. American Public Health Association, American Water Works Association and Water
Environment Federation, Washington DC, USA.
Ekama, G.A., Dold, P.L. and Marais, G.v.R. (1986) Water Sci. Technol., 18(6), 91–114.
European Union (2001) Pollutants in Urban Wastewater and Sewage Sludge. Office for Official
Publications of the European Communities, Luxembourg.
Field, J.A., Field, T.M., Poiger, T., Siegrist, H. and Giger, W. (1995) Water Res., 29(5), 1301–1307.
Gujer, W., Henze, M., Mino, T. and van Loosdrecht, M.C.M. (1999) Water Sci. Technol., 39(1),
183–193.
Halling-Sørensen, B., Nors Nielsen, S., Lanzky, P.F., Ingerslev, F., Holten L¨utzhøft, H.C. and
Jørgensen, S.E. (1998) Chemosphere, 36(2), 357–393.
Henze, M. (1992) Water Sci. Technol., 25(6), 1–15.
Henze, M., Grady J., C.P.L., Gujer, W., Marais, G.v.R. and Matsuo, T. (1987) Activated Sludge
Model No. 1. IAWQ Scientific and Technical Report No. 1, London, UK.
Holt, M.S., Fox, K.K., Burford, M., Daniel, M. and Buckland, H. (1998) Sci. Total Environ.,
210/211, 255–269.
Kappeler, J. and Gujer, W. (1992) Water Sci. Technol., 25(6), 125–139.
K¨orner, W., Bolz, U., S¨ußmuth, W., Hiller, G., Schuller, W., Volker, H. and Hagenmaier, H. (2000)
Chemosphere, 40, 1131–1142.
Mamais, D., Jenkins, D. and Pitt, P. (1993) Water Res., 27, 195–197.
Manoli, E. and Samara, C. (1999) J. Environ. Qual., 28(1), 176–186.
McNally, D.L., Mihelcic, J.R. and Lueking, D.R. (1998) Environ. Sci. Technol., 32, 2633–2639.
Metcalf and Eddy. (2003) Wastewater Engineering. Treatment and Reuse,. 4th Edn. McGraw-Hill,
New York.
Monteith, H.D., Bell, J.P., Thompson, D.J., Kemp, J., Yendt, C.M., Melcer, H., (1993) Water
Environ. Res., 65(2), 129–137.
JWBK117-3.2 JWBK117-Quevauviller October 10, 2006 20:27 Char Count= 0
202 Treatability Evaluation
Orhon, D., Artan, N. and Cimsit, Y. (1989) Water Sci. Technol., 21(4–5), 339–350.
Orhon, D., Ate¸s, E., S¨ozen, S. and Ubay C¸ okg¨or, E. (1997) Environ. Pollut., 95(2), 191–204.
Pax´eus, N. (1996) Water Res., 30(5), 1115–1122.
Prats, D., Ruiz, F., V´azquez, B. and Rodriguez-Pastor, M. (1997) Water Res., 31(8), 1925–1930.
Roeleveld, P.J. and van Loosdrecht, M.C.M. (2002) Water Sci. Technol., 45(6), 77–87.
Samara, C., Lintelmann, J. and Kettrup, A. (1995) Toxicol. Environ. Chem., 48(1–2), 89–102.
Sinkkonen, S. and Paasivirta, J. (2000) Chemosphere, 40, 943–949.
Sollfrank, U., Kappeler, J. and Gujer, W. (1992) Water Sci. Technol., 25(6), 33–41.
Spanjers, H, Tak´acs, I. and Brouwer, H. (1999) Water Sci. Technol., 39(4), 137–145.
Spanjers, H. and Vanrolleghem, P. (1995) Water Sci. Technol., 31(2), 105–114.
STOWA. (1996) Methoden voor influentkarakterisering (in Dutch). STOWA Report 96–08,
STOWA, Utrecht, The Netherlands.
Vanrolleghem, P.A.,Spanjers,H.,Petersen,B., Ginestet, P.andTakacs, I. (1999) Water Sci. Technol.,
39(1), 195 – 215.
Weijers, S.R. (1999) Water Sci. Technol., 39(4), 177–184.
Xu, S. and Hultman, B. (1996) Water Sci. Technol., 33(12), 89–98.
Ziglio, G., Andreottola, G., Foladori, P. and Ragazzi, M. (2001) Water Sci. Technol., 43(11),
119–126.
JWBK117-3.3 JWBK117-Quevauviller October 10, 2006 20:28 Char Count= 0
3.3
Toxicity Evaluation
Martijn Devisscher, Chris Thoeye, Greet De Gueldre and
Boudewijn Van De Steene
3.3.1 Introduction
3.3.2 Need for Toxicity Measurements
3.3.3 Influent vs Effluent Toxicity of Wastewater
3.3.3.1 Influent Toxicity Evaluation
3.3.3.2 Effluent Toxicity Evaluation
3.3.4 Units
3.3.5 Sources of Toxicity
3.3.6 Toxicity Testing
3.3.6.1 Influent Toxicity
3.3.6.2 Effluent Toxicity
3.3.7 Toxicity Mitigation
References
3.3.1 INTRODUCTION
Under the Urban Wastewater Treatment Directive 91/271/EEC, the quality of ef-
fluents has been based on the monitoring of global chemical parameters, such as
BOD (biological oxygen demand), COD (chemical oxygen demand) or TSS (total
suspended solids). Wastewaters from various origins may contain compounds, toxic
to the aquatic ecosystem, or even to the biocommunity responsible for the treatment
of the wastewater. These toxic effects are insufficiently expressed in the currently
practiced measurements.
Wastewater Quality Monitoring and Treatment Edited by P. Quevauviller, O. Thomas and A. van der Beken
C
2006 John Wiley & Sons, Ltd. ISBN: 0-471-49929-3
JWBK117-3.3 JWBK117-Quevauviller October 10, 2006 20:28 Char Count= 0
204 Toxicity Evaluation
Although some countries impose toxicity tests on effluents, there is currently no
general European legal framework that systematically prescribes toxicity tests on
effluents. Nevertheless, it is expected that the role of toxicity tests will become more
important in the near future. Indeed, the European Union Water Framework Directive
2000/60/EC places more emphasis on the reduction of discharges of toxic elements,
and the Integrated Pollution Prevention and Control Directive (96/61/EC), coming
into effect by October 2007, is based on a permit system requiring the use of best
available technology (BAT). In this, toxicity measurements may play an important
role.
This chapterpresents anoverviewof thecommon toxicity detectionmethods in use
today. The discussion is limited to ‘conventional’ toxicity tests. In recent years, there
has been increased concern over the release of pharmaceutically active compounds,
personal care products and endocrine disrupting compounds into the environment.
These compounds occur in low concentrations in the environment and are unlikely
to cause acute toxicity. Highly sensitive bioassays have been developed to screen
wastewater effluents on their (anti-)estrogenicity, (anti-)androgenicity, mutagenicity
and cytotoxicity. Developments in these fields are extensive, evolve fast and deserve
separate chapters in their own right.
However, we have limited the discussion to tests that are most relevant to the
operation of wastewater treatment plants (WWTPs): the detection of toxic influents
that can disturb the treatment process, and of toxic compounds in the effluent, which
may be an indication of diminished treatment efficiency.
3.3.2 NEED FOR TOXICITY MEASUREMENTS
Toxic compounds are present in wastewater from various sources. In many countries
in Europe, industrial plants are connected to the sewer. Industrial wastewaters can
contain large amounts of toxic material, such as heavy metals, or synthetic chemicals
and their waste products. These pollutants can even be present after conventional
wastewater treatment (Paxeus, 1996).
Also purely domestic wastewater can contain toxic elements. Domestic discharges
can contribute toxins from consumer products (e.g. cleaning products) or liquid
wastes. Urban run-off may contain leachates or organic pollutants deposited from the
atmosphere onto paved surfaces. In combined sewer systems this run-offis also intro-
duced into the sewer system. Other known sources of potentially toxic compounds
include commercial premises such as health establishments, small manufacturing
industries or catering/hotel enterprises. It is obvious that also illegal discharges to
the sewer represent a potential source of toxicity.
Chemical analyses alone are insufficient for assessing the toxicity of a wastewater.
In the first place, the toxic compounds may be unknown. Indeed, the composition
of wastewater is traditionally expressed in nonspecific terms such as BOD, COD or
TOC (total organic carbon). These rather general measures reflect the general poor
JWBK117-3.3 JWBK117-Quevauviller October 10, 2006 20:28 Char Count= 0
Influent VS Effluent Toxicity Of Wastewater 205
knowledge of the exact composition of wastewaters. Even if an exact composition
of the wastewater is known, it is impossible to have a comprehensive overview on
all compounds that are effectively present in the wastewater upon arrival at the
treatment plant or in the environment. Several transformations may occur and create
additional toxic content. Physico-chemical transformations may be occur, e.g. under
the influence of sunlight UV, and toxic metabolites may originate via biodegradation,
for example during storage in cesspits, during sewer transport or in activated sludge
treatment.
In addition to the presence of unknown compounds, the (eco)toxicity of the known
components may not be well documented. Although databases of such data exist
(e.g. ECOTOX: important gaps remain. The lack of
this kind of information on thousands of chemicals on the market today has been
acknowledged by the European Union, and has prompted the REACH (Registration,
Evaluation, Authorisation and Restrictions of Chemicals) proposal (CEC, 2001).
The goal of this proposal is to secure data on and regulate some 30 000 chemicals
produced in excess of 1 ton for which there is limited information with regard to
toxicity and environmental effects. These data will expand the knowledge on toxic
effects of pure compounds.
However, even when all toxic components in a wastewater have been identified,
and detailed ecotoxicity information would be available for each of these compo-
nents, an additional difficulty is the assessment of the effect of complex mixtures.
Interaction of the compounds with each other, with the wastewater matrix or with the
environment may result in synergistic or antagonistic effects, the matrix may render
certain compounds biologically unavailable or may even increase toxicity (Hernando
et al., 2005).
A more direct measure of toxicity consists of submitting the whole complex
mixture to a toxicity test. Although interactions with the final environment are not
modelled precisely, it is a measure of the resultant toxicity of the complex wastewater
mixture, integrating the combined effect of known and unknown toxic components
and their interactions with the wastewater matrix. This type of testing is known in
the USA as WET (whole effluent testing; US EPA, 1994). and in the UK as DTA
(direct toxicity assessment; Tinsley et al., 2004).
3.3.3 INFLUENT VS EFFLUENT TOXICITY
OF WASTEWATER
The first major distinction to be made is whether the wastewater is monitored before
or after treatment. We will refer to these techniques as influent toxicity monitoring
and effluent toxicity monitoring, respectively.
This distinction is different because both the goal and requirements, and therefore
the adopted methods differ whether the wastewater is monitored before or after
treatment.
JWBK117-3.3 JWBK117-Quevauviller October 10, 2006 20:28 Char Count= 0
206 Toxicity Evaluation
3.3.3.1 Influent Toxicity Evaluation
These tests have the intention to protect the biological wastewater treatment process
from the effect of toxic influents. Although Annex 1 of the Urban Wastewater Treat-
ment Directive already states that ‘Industrial wastewater entering collecting systems
and urban wastewater treatment plants shall be subject to such pretreatment as is re-
quired in order to ensure that the operation of the wastewater treatment plant and
the treatment of sludge are not impeded’, these tests are not commonly imposed by
regulators. The tests used are sometimes referred to as upset early warning devices
(UEWDs; Love and Bott, 2000). The sensitivity of these tests should be representa-
tive for the biocommunity of the wastewater treatment process. This sensitivity can
differ greatly from that of the receiving ecosystem.
3.3.3.2 Effluent Toxicity Evaluation
The purpose of effluent toxicity evaluation is to assess the effect of a certain wastewa-
ter on the receiving waters. The methods used are essentially the same as those used
for ecotoxicity testing of pure compounds. Effluent toxicity tests are imposed by
some discharge consents and have been extensively studied and standardized. The
conventional approach is the use of bioassays. In these tests, the biological response
of a certain bioindicator species is monitored in response to the wastewater to be
tested. These bioassays can be further subdivided according to the species involved,
the duration (acute/chronic toxicity test) or to the effect on the indicator organ-
ism (mortality, reproduction, motility). The requirements of these tests are a high
sensitivity and representativity for the receiving ecosystem.
Although the distinction between influent and effluent toxicity is clear, it is evident
that there is a strong link between the two. The effluent of an industrial treatment
plant may be part of the influent to a municipal plant, and highly toxic substances
in the influent may inhibit the treatment process in such an amount, that the toxic
compounds break through to the effluent to cause effluent toxicity.
3.3.4 UNITS
Central to (eco)toxicity evaluation is a dose–effect relationship. Since bioavail-
ability of a compound introduced in wastewater differs greatly for each individ-
ual compound, test species and wastewater matrix, the exact dose imposed on
the test organism is difficult to quantify. Therefore, in aquatic toxicity testing, a
concentration–effect relationship is considered, relating the concentration in the
wastewater to the effect on the test organism. This relationship becomes evident in
JWBK117-3.3 JWBK117-Quevauviller October 10, 2006 20:28 Char Count= 0
Sources Of Toxicity 207
100
75
50
25
0
0246
LC
50
810
Concentration (e.g. mg/l)
Cumulative response (%)
NOEC
LOEC
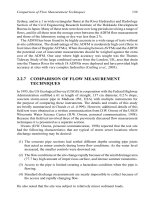
Figure 3.3.1 Sigmoidal response curve. (Adapted from Connell et al., 1999 with permission
from Blackwell Publishing)
the commonly used units for ecotoxicity:
r
EC
50
: The concentration at which 50% of the effect is observed.
r
LOEC: Lowest observable effect concentration, i.e. the lowest concentration at
which an effect can be observed.
r
NOEC: No observable effect concentration, i.e. the highest concentration at which
no effect can be observed.
The term concentration, in the context of whole effluent testing, refers to dilution
series of the original wastewater, ranging from 0 to 100 % of the wastewater.
These measures are graphically represented in Figure. 3.3.1.
(Eco)toxicity is determined by studying quantifiable effects. The effects studied
are specific to each toxicity test. A commonly observed effect is mortality (lethal
effect). In this case, the term LC
50
is used rather than EC
50
. This determines the
concentration at which 50 % mortality is observed. Another commonly used measure
is IC
50
which is the concentration at which 50 % inhibition of a certain activity (e.g.
light emission) is observed.
There is no such thing as a EC
50
of a certain compound. Toxicity is a measurement
of aneffect to a certain organism or community of organisms. It is therefore important
that the test method is specified together with the EC values.
3.3.5 SOURCES OF TOXICITY
Influents of industrial WWTPs may contain a large variety of toxic compounds. It
is practically impossible, and certainly beyond the scope of this chapter, to give a
JWBK117-3.3 JWBK117-Quevauviller October 10, 2006 20:28 Char Count= 0
208 Toxicity Evaluation
comprehensive overview of possible toxicity sources, given the variety of industrial
processes, and hence waste products existing today.
Toxic compounds may originate in industrial plants directly, or by biodegra-
dation of production or waste chemicals. These may break through the industrial
wastewater treatment process because of plant upsets or reduced treatment effi-
ciency, or because these compounds are simply left untouched by the treatment
process. These compounds subsequently represent a cause of toxicity to receiving
waters, or when the industry is connected to the sewer, to the receiving municipal
WWTP.
Toxicity may also originate from domestic sources. In the first place, essentially
all chemicals on the market today are potential sources of toxicity. Examples are
cleaning products, personal care products, pharmaceuticals, or biocides, available
on the market today. Several commercial sources can be identified to contribute to
wastewater toxicity. For example, small manufacturing industries with metal/vehicle
related industries, health establishments and hotel/catering enterprises are important
sources of contamination of urban wastewater with potentially toxic elements. In
combined sewer systems, storm water flows can contribute toxins from leachates,
paved surface wash-off containing residues from tyre and brake-lining wear, or heavy
metals from potable water ducts, painted surfaces or roofing materials (Thornton
et al., 2001).
Toxicity furthermore can originate in the treatment process itself. Firstly, a poor
breakdown of conventional pollutants (e.g. BOD and nitrogen) can have an adverse
effect on toxicity reduction, since toxic components that are otherwise decomposed
by the normal carbon degradation pathways also suffer from treatment deficiencies.
Sometimes, selected effluents from e.g. the food industry, may be added as a carbon
source to enhance nitrogen removal. It is important to screen these streams for
potentially toxic by-products before introduction into the treatment process. Also,
chemical additives used in wastewater and sludge treatment such as coagulants,
flocculant aids, or disinfectants or chemicals for phosphorus precipitation, when
not dosed in an adequate manner, can form serious threats to the health of the
biocommunity and the receiving ecosystem.
When persistent toxicity is observed, identification of the source is necessary.
Toxicity tests on strategic locations in the wastewater transport system can be used
to track down the source of toxicity (Geenens and Thoeye, 1998). Toxicity tests
are also extensively used in toxicity identification evaluation (TIE) procedures (US
EPA, 1991). These procedures are intended to identify the sources of toxicity, by
testing toxicity on parts of the sample, that have undergone laboratory manipulations.
These manipulations include for examplepH adjustment,addition of chelating agents
such as EDTA, or addition of reductants. The difference in toxicity observed before
and after these manipulations can yield clues regarding the sources of toxicity. For
example, disappearing toxicity after pH decrease indicates the presence of a pH
dependent toxicant (a well-known example is ammonia, with the undissociated form
being the main toxic agent).
JWBK117-3.3 JWBK117-Quevauviller October 10, 2006 20:28 Char Count= 0
Toxicity Testing 209
3.3.6 TOXICITY TESTING
3.3.6.1 Influent Toxicity
The goal of influent toxicity testing is the protection of the biocommunity of the
wastewater treatment system against toxic influents.
Of all biological treatment processes, suspended growth activated sludge is the
most widespread. In these processes, the wastewater is brought into close contact
with a concentrated suspension of micro-organisms, which degrade the pollutants by
various biochemical pathways. After treatment, these micro-organisms are separated
from the treated effluent, and are reused. Despite recent developments in membrane-
based separation, the existing patrimonium and the majority of newly built plants
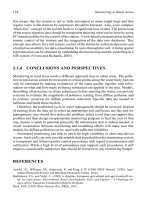
still perform this separation process by gravitational settling. An overview of the
conventional activated sludge treatment process is given in Figure. 3.3.2.
Toxic shocks can be expressed in various ways. They can result in inhibition or
inactivation of certain micro-organisms that perform the biological degradation of
the pollutants. This in turn results in a reduced treatment efficiency of the plant, and
possibly violations of effluent consents.
A more serious effect is the possible complete loss of viability of the organisms.
Although rare, examples exist of total loss of viable biomass in the treatment plant.
Treatment plants may take weeks to recover from such an event, and restoring treat-
ment capacity is very costly, since it involves disposing large volumes of intoxicated
sludge, and re-seeding the system with micro-organisms.
Loss of treatment capacity can also be the result of deflocculation resulting in
sludge washout (Geenens and Thoeye, 1998). Deflocculation is the breakup of flocs
of micro-organisms into smaller fragments. As these have a larger specific surface
area, they settle more slowly, and cannot be removed by gravitational settling.
It is important that the sensitivity of the test be representative for the treatment
plant organisms. The sensitivity of the biomass to toxic substances is inevitably
lower than that of the receiving environment. Indeed, otherwise there would be no
breakdown of these substances in the plant. For this reason, tests designed for effluent
toxicity testing are likely to be too sensitive for application to influents, and will give
rise to false alarms (Guti´errez et al., 2002).
Influent
Reactor
Return sludge
Effluent
Figure 3.3.2 Conventional activated sludge treatment
JWBK117-3.3 JWBK117-Quevauviller October 10, 2006 20:28 Char Count= 0
210 Toxicity Evaluation
Activated sludge is a complex ecosystem of hundreds of micro-organisms. As it
is the case for effluent toxicity testing, a single test species is insufficient to fully
assess toxicity to the biocommunity. Test batteries form a potential solution to this,
provided that the tests, in addition to being representative, yield complementary
results (Ren and Frymier, 2004).
An additional difficulty is the fact that adaptation mechanisms can reduce the
sensitivity of the sludge community to certain compounds. For example, phenolics,
cyanides and thiocyanates are known to be toxic for biological treatment systems
(Blum and Speece, 1991). Grau and Da-Rin (Grau and Da-Rin, 1997) reported
serious municipal plant upsets as a response to phenol concentrations in the in-
fluent. Nevertheless, certain wastewaters, such as those from cokes plants, contain
high amounts of these components, and are adequately treated by activated sludge
plants.
Another important aspect of early warning systems is the need for short-term
testing, and preferably on-line instruments. It is obvious that an influent for a plant
with a hydraulic residence time of 24 h should not be monitored using e.g. a
21-day reproductivity test, if the goal is to protect the plant from toxic shocks.
Longer term testing of influents does occur to evaluate treatability of a wastewater
before introduction, or for confirmation of the results of on-line testing.
An extensive overview on influent toxicity detection methods has been given in
Love and Bott (Love and Bott, 2000), and an update in Ren (Ren, 2004). We will
restrict the discussion to the most commonly used methods: bacterial luminescence,
nitrification inhibition and respirometry.
Bacterial luminescence
The principle of bioluminescence toxicity detection is discussed in more detail for
effluent testing (see below). The method has been applied to raw influents for a
long period of time, and a lot of data has been accumulated that can be used as
reference data. However, there are significant disadvantages of using this test for
assesssing toxicity to wastewater treatment bacteria. Vibrio fischeri, the standard
organism at the basis of the commonly used bioluminescence tests, is a marine
bacterium, and therefore the relevance to the activated sludge community is at the
very least questionable. Furthermore, because of its marine origins, the salinity of
the test solution needs to be adapted. This manipulation diverts the measurement
conditions from the environmental conditions in the treatment plant.
Several adaptations have been proposed to address these disadvantages. For ex-
ample, Hoffmann and Christofi (Hoffmann and Christofi, 2001) proposed a method
where a population of the luminescent marine bacterium was incorporated into a
sludge testing matrix. Other authors (Kelly et al., 1999; Ren and Frymier, 2003)
have transferred the lux operon of V. fischeri (i.e. a group of genes coding for the
bioluminescence) into a bacteria isolated from activated sludge.
JWBK117-3.3 JWBK117-Quevauviller October 10, 2006 20:28 Char Count= 0
Toxicity Testing 211
These measures improve the representativity of the methods. An extensive
overview of current developments in bacterial luminescence methods is given in
Philp et al. (Philp et al., 2004).
Nitrification inhibition
Conventional biological nitrogen removal involves a two-step process. The first step,
nitrification, comprises the oxidation of reduced nitrogen compounds to nitrite and
eventually to nitrate. Nitrification occurs in two major steps: the oxidation to nitrite,
mediated by a group of bacteriacalled the ammonia oxidising bacteria (AOB,usually
represented by the species Nitrosomonas), and the subsequent oxidation of nitrite
to nitrate by nitrite oxidising bacteria of which Nitrobacter is the most well-known
example.
The second step of biological nitrogen removal is denitrification, in which the
oxidised nitrate forms are used as an electron acceptor, resulting in N
2
gas, which
dissipates into the atmosphere, and finally removes nitrogen from the water.
It is well-known that nitrifying bacteria are the most sensitive to toxic sub-
stances among the activated sludge consortium (Blum and Speece, 1991). A survey
performed by J¨onsson (J¨onsson, 2001) revealed that of 75 interrogated nitrifying
wastewater treatment plants, 48 have experienced nitrification problems. Of these
48, approximately 20 % attributed the problems to an industrial discharge.
Follow-up of nitrification can be done using several methods. Since the first ni-
trification step is known to be most sensitive to toxic substances (Blum and Speece,
1991), most methods monitor either the first step (ammonia to nitrite) or the whole
nitrification process (ammonia to nitrate).
Some methods use pure cultures of Nitrosomonas and Nitrobacter. However, it
should be realised that the traditional role of these species as ‘key’ nitrifiers is
currently being criticised (Blackall, 2000), therefore the test may not be in line with
the species actually performing nitrification in the treatment plant. Alternatively,
enriched cultures from nitrifying WWTPs can be used (Gernaey et al., 1997).
Some methods monitor directly the consumption of ammonia, and/or the produc-
tion of nitrite or nitrate (Hayes etal., 1998). Since each completely oxidised ammonia
molecule yields a proton production of two protons per ammonia molecule, nitrifi-
cation can be measured by titrimetry. This is the monitoring of added quantities of
(in this case) base needed to keep the pH in a reactor at a constant level (Gernaey
et al., 1998). A third method is based on observing the oxygen consumption asso-
ciated with ammonia oxidation. The main difficulty in this approach, is separating
oxygen demand of nitrification from background oxygen consumption (originating
for example from heterotrophic respiration). This can be done by comparing the
oxygen consumption before and after the addition of allylthiourea (ATU), a known
specific inhibitor of nitrification (Gernaey et al., 1997). The difference of the two
represents the oxygen consumption of nitrification alone.
JWBK117-3.3 JWBK117-Quevauviller October 10, 2006 20:28 Char Count= 0
212 Toxicity Evaluation
Nitrification inhibition methods have the advantage of their high sensitivity and
their relevance to the biological nutrient removal process. However, they do not yield
information about toxicity to heterotrophic bacteria, and obviously their relevance is
lost in nonnitrifying plants. In addition, in some plant layouts, nitrifying organisms
are exposed to wastewater after BOD removal. In these situations, the biodegradation
of certain toxic compounds by the heterotrophic biomass during BOD removal is
not taken into account, and toxicity may be overestimated.
Respirometry
One of the most widely used influent toxicity detection techniques is respirometry.
The significance of respirometry in activated sludge systems is largely recognised in
the literature and its uses exceed toxicity detection alone (Bixio et al., 2000; Copp
et al., 2002).
Respirometry monitors the oxygen uptake rate of activated sludge with one or
more oxygen sensors placed in a test reactor. Toxicity is measured by the inhibition of
the oxygen uptake rate following the addition of a test substance. The oxygen uptake
rate of activated sludge is directly coupled with energy metabolism of the activated
sludge micro-organisms. In an indirect way, respiration rate is also indicative for
growth and reproduction, since a decreased growth eventually results in less energy
needs. Therefore, respirometric experiments can be designed to detect toxic effects
on both energy metabolism and growth/reproduction of the biomass.
In influent monitoring, a small biomass sample is subjected to the influent under a
loading rate that is typically higher than that of the actual plant. During breakdown,
various parameters such as oxygen uptake rate are monitored and compared with
the response to a reference influent. The experiment is usually performed in a short
time span, and can therefore be automated and included in the on-line supervision
and control systems of the plant.
All respirometry-based methods in some way refer the measurements to a ref-
erence influent, known not to be toxic to the biomass. By careful selection of this
reference influent and the evaluation method, it is possible to estimate toxicity both
to the heterotrophic and the autotrophic community (Kong et al., 1996). In this way,
additional information on nitrification inhibition can help an early detection of toxic
episodes.
Respirometric measurement methods differ in the way oxygen uptake rate is
monitored. The main difficulty is separating oxygen supply (aeration) from oxygen
uptake. Some methods separate aeration and oxygen decay in time by subsequent
aeration and decay (possibly in repeating cycles, e.g. de Bel et al., 1996), others
separate them in space by cycling a biomass between an aerated and an unaerated
vessel (Spanjers, 1993), while other methods use mathematical methods to separate
the two, simultaneously occurring, processes (Vanrolleghem, 1994).
Another important distinction is in the biomass used for the respirometric mea-
surements. Somerespirometers grow an internal biomass,independent from theplant
JWBK117-3.3 JWBK117-Quevauviller October 10, 2006 20:28 Char Count= 0
Toxicity Testing 213
which is protected by the device, while others sample the plant’s activated sludge for
the toxicity test. The advantage of the first type of respirometers istheir independence
from plant performance, and their adaptation to the reference influent, yielding a fast
and well-defined response. The advantage of the second type is obvious: since the
activated sludge itself is sampled for every measurement, the test species and the
activated sludge itself become identical, ensuring maximal representativeness.
Several commercial devices are available, both for laboratory use and for on-
line application. Although reliability of the on-line instruments has been criticised,
successful full-scale applications exist (Devisscher et al., 2001), provided a thorough
maintenance and control scheme is implemented and respected.
3.3.6.2 Effluent Toxicity
Effluent toxicity tests attempt to quantify the toxic effect of the effluent on the
receiving ecosystem. Bioassays consist of monitoring a quantifiable effect on an
indicator organism. These tests have been used for this purpose for a long time, and
extensive documentation, toxicity data and standard procedures are available.
It is impossible to represent an entire ecosystem by one specific indicator species.
Therefore, in order to have meaningful results, a battery of bioassays representing
locally relevant species from all trophic levels is considered a prerequisite. It is
important to realise that, even with these precautions, considerable differences may
exist between the predicted effect and the actual in-situ effect of the studied effluent
to the receiving water (La Point and Waller, 2000).
An overview of effluent toxicity measurements can be found in Farr´e and Barcel´o
(Farr´e and Barcel´o, 2003). These authors classified the toxicity detection methods
according to the test species used. The same classification is used here.
Fish bioassays
Traditionally used species include rainbow trout (Onchorhynchus mykiss) and the
fathead minnow (Pimephales promelas). A routinely used test is the 96-h lethality
assay (European Commission, 1992a). In this test, fish are exposed to a dilution
series of the wastewater for 96 h. Mortality is recorded at 24-h intervals, and used
to calculate the LC
50
.
Three types of lethality test can be used:
r
Static test: no flow of the test solution occurs.
r
Semi-static test: test with regular batch-wise renewal of the test solution.
r
Flow-through test: the water is renewed constantly in the test chamber.
JWBK117-3.3 JWBK117-Quevauviller October 10, 2006 20:28 Char Count= 0
214 Toxicity Evaluation
Other specieshave beenproposed,and besides lethality, otherfish bioassays are based
on larval growth, larval survival and adenosine triphosphate (ATP) measurements.
Recent developments are ongoing to replace fish tests by direct measurements on
cultured cells.
Fish bioassays are quite laborious. They require specialised equipment and staff.
Invertebrate bioassays
Popular species for invertebrate toxicity testing include Daphnia and Ceriodaphnia.
The 48-h immobilisation test (European Commission, 1992b) is widely used. In this
test, young daphnids are exposed to a dilution series of the wastewater. Immobil-
isation is recorded at 24 and 48 h and the data are then used for calculating the
EC
50
.
Other testsexist,such asthe 21-dayreproduction test,and many otherinvertebrates
have been proposed, such as mayflies (Baetis spp.) amphipods (e.g. Gammarus
lacustris) or stoneflies (Pteronarcys spp.).
Several invertebrate bioassays are being marketed in user-friendly kits.
Plant and algae bioassays
Several bioassays basedon plants exist, but are seldom used. A typical algae indicator
species is Selenastrum capricornutum. In the algal growth inhibition test (European
Commission, 1992c), the exponentially growing test species are incubated in the test
solution for 72 h and cell density is measured every 24 h. The quantified effect is
the inhibition of growth relative to a control culture.
Bacterial bioassays
A widespread toxicity test is based on the luminescence inhibition of luminescent
bacteria, such as V. fischeri or Photobacterium phosphoreum. The bioluminescence
reaction involves the oxidation of a long chain aldehyde (RCHO) and reduced flavin
mononucleotide (FMNH
2
), resulting in the production of oxidised flavin (FMN)
and a long chain fatty acid (RCOOH), along with the emission of blue-green light.
Since FMNH
2
production depends on functional electron transport, only viable cells
produce light. This relationship between light emission and cellular viability forms
the basisof the assayand it forms thelink between toxicity andthe observed response.
These bioluminescence tests are standardised (International Standardization Or-
ganization, 1998) and available as commercial devices by several suppliers.
Since the biochemical and genetic mechanisms of bacterial bioluminescence
are well understood, and because of the possibilities created by recent evolu-
tions in molecular biology, major research efforts are directed to the development
JWBK117-3.3 JWBK117-Quevauviller October 10, 2006 20:28 Char Count= 0
Toxicity Mitigation 215
of genetically modified organisms carrying the lux operon. In this way, toxicity tests
can be developed with a wide range of novel indicator micro-organisms (Philp et al.,
2004).
Biosensors
Biosensors result from the direct coupling of biologically active elements (such as
enzymes, DNA or immobilised micro-organisms) to a physico-chemical transducer
(e.g. a conductivity sensor). The difference with bioassays is subtle. Biosensors
attempt to integrate a bioassay in an instrument, whereas bioassays normally are
conducted in a laboratory.
Whole cell bacterial biosensors have been used for toxicity monitoring. In these
tests, a living organism is immobilised, and their response to toxic mixtures is mon-
itored. A commercially available technique is based on an amperometric system. In
this system, a chemical mediator deviates electrons from the respiratory system of
the immobilised test organism to an amperometric carbon electrode.
The advantages of these sensors are their unattended operation, fast response and
the (semi)continuous signal. These aspects makes them fit for inclusion in on-line
monitoring systems.
3.3.7 TOXICITY MITIGATION
When confronted with recurring toxicity events, mitigation measures should be
provided at the plant to reduce the impact of the toxic influent to the plant.
When influent toxicity is an issue, protection of the purification process is the
main goal. Possibilities include:
r
Calamity basins can be used to store limited volumes of toxic influents. These
volumes can later be tankered away to specialised disposal sites, they can be
treated on-site by the addition of chemicals, or they can be introduced into the
system at a much lower loading rate.
r
Equalisation basins can be used to mix influents from several sources. The mixture
may have reduced toxicity (e.g. in the case of pH-dependent toxicants).
r
Chemicals can be added to reduce toxicity. pH can be adjusted by adding acids
or caustic chemicals; polymers or other coagulants can be added to aid the re-
moval of colloidal or suspended pollutants; or powdered activated carbon can be
dosed to remove toxic organic compounds. These chemicals can be added in the
calamity/equalisation basin, or directly into the treatment process.
r
Adaptation of the plant’s operational parameters can help reduce the effect of toxic
compounds. Increased aeration may result in faster breakdown of biodegradable
JWBK117-3.3 JWBK117-Quevauviller October 10, 2006 20:28 Char Count= 0
216 Toxicity Evaluation
toxicants; or in the stripping of volatile compounds. Alternative measures include
step-feeding (i.e. the introduction of the influent in multiple locations, in order to
reduce the local concentration), rapid return sludge recycling (in order to increase
the biomass concentration at the top of the reactor) and waste sludge storage and
recycling. An evaluation of these last three, together with influent storage and
reintroduction is given in Copp et al. (Copp et al., 2002).
These measures can be taken manually, after detection of toxicity, but the strategies
are more efficient if they can be automatically coupled to an action by inclusion
in the supervision and control system of the plant. These strategies require on-line
toxicity detection instruments.
A thorough procedure for effluent toxicity reduction is given by the US EPA (US
EPA, 1999).
When confronted with effluent toxicity, the sources of this toxicity need to be
traced in order to determine the correct remedial action. Toxicity can be introduced
by the influent, or may originate in the treatment process itself, e.g. through the
addition of certain chemicals. In the last case, replacement of these chemicals should
be considered, oradditional treatmentsteps should betaken to removethe compounds
causing toxicity.
In case toxicity can be traced back to the influent, further follow-up through the
wastewater origins is needed to tackle the toxicity at source. If this is not possible,
existing process operation should be reviewed to check whether the plant is indeed
performing optimally. By adjusting conventional process control parameters such
as oxygen setpoint or mixed liquor suspended solids (MLSS) concentration, an
increased treatment efficiency might be achieved that is able to remove the toxicants
by conventional operation. If the process is performing at its best possible level,
measures such as described above can be taken to reduce influent toxicity.
REFERENCES
Bixio, D., Geenens, D., Bogaert, H. and Thoeye, C. (2000) A stethoscope of the wastewater
treatment plant. In: Proc. 73th WEFTEC, 14–18 October 2000, Anaheim, USA (on CDROM).
Blackall, L.L. (2000) Australasian Biotechnol., 10(3), 29–32.
Blum, D.J.W. and Speece, R.E. (1991) J. Water Pollut Control Fed., 63(3), 198–207.
CEC (2001) Proposal for a regulation ofthe European Parliament and ofthe Council concerning the
Registration, Evaluation, Authorisation and Restriction of Chemicals (REACH), establishing
a European Chemicals Agency and amending Directive 1999/45/EC and Regulation (EC) (on
Persistent Organic Pollutants). Brussels, 29.10.2003, COM(2003) 644 final.
Connell, D.W., Lam, P.,Richardson,B. and Wu, R. (1999) Introduction to Ecotoxicology.Blackwell,
Oxford, UK.
Copp, J.B., Spanjers, H. and Vanrolleghem, P.A. (Eds) (2002) Respirometry in control of the
activated sludge process: benchmarking control strategies. Scientific and Technical Report No.
11. IWA, London, UK.
de Bel, M., Stokes, L., Upton, J. and Watts, J. (1996) Water Sci. Technol., 33(1), 289–296.