Notesto Financial Statements Note 2. Deposits June 30.2005_part1 doc
Bạn đang xem bản rút gọn của tài liệu. Xem và tải ngay bản đầy đủ của tài liệu tại đây (735.09 KB, 11 trang )
Notes
to Financial
Statements
June
30.2005
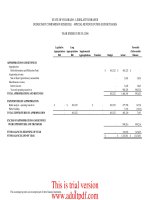
Note 2. Deposits
At
June 30, 2005
and2004,
the University's
bank balances were
$141,695
and
$266,204,
respectively, and were
covered by the Federal
Deposit
Insurance
Corporation
or
pledged
collateral.
The
University
had
cash on
hand of
5223,151
and
$198,383
at
June 30, 2005
artd2004, respectively.
At June
30,
2005
and2004, the Illinois
State University Foundation,
the discretely
presented
component unit, bank
balances were
$3,882,734
and$9,120,641,
respectively,
and all but
$140,451
were covered by
insurance of the
Federal
Deposit Insurance
Corporation
or Security
Investor Protection
Corporation,
or by
pledged
collateral.
2005
2004
DEPOSITS:
University
Bank
Checking Funds
Local
Vault
Cash and
Change Funds
Total
University
Foundation
Cash in
bank
266,204
266.204
$$$$$
3,882,734
$
3,368,352
_9,r20,6IJ_
$
_8WJ64
Reconciliation
of cash
and cash equivalents
to deposits:
2005
$
$
$
$
Bank
Balance
141,695
141,6%
Carrying
Amount
10,782
223,151
233,933
Bank
Balance
Carrying
Amount
$
198,383
$
198,383
$
s
Cash and
cash equivalents
Current
Noncurrent
Total
cash
and cash
equivalents
Less:
Money market
mutual
funds
classified as
investments
for
purposes
of categorization
Carrying
amount
of deposits
Cash
and cash
equivalents
Current
Noncurrent
Total
cash
and cash
equivalents
Less:
Money market
mutual
funds
classified
as
investments
for
purposes
of categorization
Canying
amount
of deposits
University
$
33,680,685
33,680,685
(33,446,752)
$
233,933
Foundation
r,904,044
1,464,308
3,368,352
$
__1;gg;J?_
2004
University
$
22,185,687
22,195,697
(21,987,304)
s
198,383
Foundation
5,149,815
3,676,349
8,826,164
8,826,164
ILLINOIS
STATE
UNIVERSITY
2l
This is trial version
www.adultpdf.com
Notes to Financial
Statements
June
30.2005
Note 3. Investments
Investments are recorded
at
fair
market value,
as determined by
quoted
market
prices.
UNIVERSITY INVESTMENTS
As of June 30, 2005,
the University had the
following investments:
Fair Market
Less Than
I
to
5
Federal Home Loan Mortgage
Corporation I1,844,300
6,942,120
4,902,180
AAA
23,464,890
10,311,667
13,153,223
AAA
U.S.
Treasuries
Federal National Mortgage
Association
Federal Home
Loan Bank
Illinois
Funds
Investment
Pool
Bank Money Market Mutual Funds
Total
University
U.S.
Treasuries
Federal
National
Mortgage Association
Federal Home Loan Bank
Illinois
Funds
Investment
Pool
Bank Money Market Mutual Funds
Total
University
ILLINOIS STATE UNIVERSITY
Value
I Year
Years
Rating
$
4,633,915
$
4,633,915
$
4,941,260
990,940 3,950,320
AAA
Interest Rate Risk: The
University does not have
a
formal
policy
that
limits
investment
maturities
as a means
of
managing
its
exposure to fair value losses
arising
from increasing interest
rates.
Concentration of Credit Risk:
The
University
places
no limit
on
the amount
that may
be
invested
in any one
issuer.
More than SYo
of
the
University
investments
are in
Federal National
Mortgage
Association
(6.3Vo),
Federal
Home
Loan
Mortgage
Corporation
(l5.lyo),
and
Federal
Home
Loan Bank
(30.0%).
Credit
Risk:
State law authorizes
investments
of U.S. Government
Securities
(Treasuries
and
Agencies),
commercial
paper
(not
more than33Yo
of
total cash
and
investments), money
market
mutual funds and
repurchase
agreements.
The
University's investments
are
rated by Moody's
Investors
Service and
Standard
and Poor's
Corporation.
As of June 30,
2004,
the University
had
the following
investments:
Fair Market
Less Than
I to 5
Value
I Year
Years
Rating
$
78,331
17
g
56,325,394
$
22,005,723
$
5,578,689
$
2,925,574
$
2,653,115
12,522,923
2,116,368
10,406,555
AAA
24,860,226
24,860,226
8,586,526
8,586,526
7,309,491
78,992,999
18,992,999
2,994,305
2,994,305
$$$$$
__zzJ!lgggggggggggggggg9_
s
__!J9vA46_
$
___3s,lesJq1_
AAAm
AAAm
22
Federal Home
Loan
Mortgage Corporation 29,734,623
14,908,200
14,826,423
AAA
7,309,491
AAA
This is trial version
www.adultpdf.com
Notes
to
Financial
Statements
June 30
2005
Interest
Rate Risk: The
University does
not
have a formal
policy
that limits investment
maturities
as
a
means of
managing its
exposure
to fair
value
losses
arising from increasing
interest
rates.
Concentration
of Credit Risk:
The University
places
no limit on the amount
that may be
invested
in
any
one issuer.
More
than SYo of the
University investments
are in
Federal
National Mortgage
Association
(16.2%),
Federal Home
Loan
Mortgage Corporation
(38.5%),
and
Federal
Home
Loan Bank
(9.5%).
Credit
Risk: State law
authorizes
investments
of U.S.
Government
Securities
(Treasuries
and
Agencies), commercial
paper (not
more than33%o
of total cash and investments), money market mutual
funds
and
repurchase agreements.
The
University's investments
are
rated
by Moody's Investors
Service
and
Standard
and
Poor's
Corporation.
FOUNDATION INVESTMENTS
The carrying
value of
the
investment
portfolio
of the Foundation at June 30,2005
and20A4,
is as follows:
2005
2004
U.S.
Government
Securities
Corporate Bonds
Certificates
of
Deposits
Common
Stock
Mutual
Funds:
Stocks
Bonds
Commodities
Money Market
Other
Total
Foundation
Bond Mutual Funds
Money Market Mutual Funds
$
slp5323_
$
48,478,064
$$$$$
13,562
$
27,757
283,684
43,207,840
8,256,072
1,020,060
4,497,248
590,100
165,638
245,367
100,233
1,290,502
33,823,256
8,301,393
4,275,690
275,985
Interest
Rate
Risk:
The Foundation
does
not have
a
formal
policy
that limits
investment
maturities
as a
means
of
managing its exposure
to fair value
losses
arising
from increasing
interest rates.
Credit
Risk: The Foundation's
investment
policy
permits
fixed income
investments
in securities
within the
four
highest
grades
assigned
by
Moody's
Investors
Service, Inc. or Standard
and
Poor's
Corporation
or,
if
unrated,
deemed
by
the
investment manager
to be of comparable
quality.
As of
June 30, 2005,
the Foundation
had
the
following
investments
exposed
to
interest rate
risk and credit
risk:
Fair Market
Value
$
8,256,072
4,497,249
Effective
Duration
Rating
AA+
AAA
3.50
years
2.58
years
Duration is
a
measure
of a fixed
income's
cash
flows
using
present
values,
weighted for
cash
flows as a
percentage
of
the investment's full
price.
Effective
duration
makes assumptions
regarding the
most
likely timing
and amounts
of
variable cash
flows
arising
from such
investments
as callable
bonds,
prepayments, and
variable-rate
debt.
ILLINOIS STATE UNIVERSITY
23
This is trial version
www.adultpdf.com
Notes to Financial
Statements
June 30
2005
Investments
consist
of the followine:
Cunent:
Investments
Noncurrent:
Investments
Restricted investments
Endowment investments
Money market
mutual
funds classified
as cash
and cash equivalents
Total
Foundation
Foundation
55,145,726
4,275,690
9,733,466
34,468,908
48,478,064
21,987,304
$
57,896,323
$
77,133,030
48,478,064
2005
2004
University
22,979,642
22,005,723
44,884,365
33,446,752
$
78,331,117
4,369,332
12,501,730
41,025,261
57,896,323
Unive$ity
17,894,069
29,560,736
7,690,921
Bond resolutions
restrict investments
in the Auxiliary
Debt Retirement
account
to
U.S. Government
Securities.
All
other
auxiliary facilities
money may be invested
in
any
instrument
permitted
by
the laws
of the
State of
Illinois for
the
investment
of
public
funds.
Foundation
policy
states
that
assets are
to
be invested in
a
diversified
portfolio
of
equity
and
fixed
income securities.
No investment
is
to
be made
that will
cause the
total investment in
equities
or frxed
income securities
issued or
guaranteed
by any
one
person,
firm,
or corporation
to
exceed
five
percent
of
the then
fair
market value
of
the
Foundation,
provided,
this restriction
is
not
to apply
to either
well diversified
mutual
funds,
pooled
funds,
unit trust,
or
the
like, or direct
obligations
of
the
U.S. Government and its fully
guaranteed
agencies.
Equities are
to
represent a
majority of Foundation
assets
up to
a
desired 75
percent
of the total,
Investments should
be
diversified;
however,
investment managers will
be
allowed
to
choose reasonable degrees
of
concentration,
or
lack thereof.
Bias in
selection
of
equity securities
rated within the
four highest
grades
assigned by
Moody's
Investor
Service,
Inc. or Standard
&
Poor's Corporation
or,
if
unrated, deemed
by
the
investment manager
to
be
comparable
quality.
A maximum
of
15
percent
of the total
portfolio
may be invested in
foreign securities.
Note 4. Accounts Receivable
Accounts receivable
consist
of
the
following
at
June 30, 2005
and 2004:
2005
2004
Student tuition and fees
Auxiliary
facilities and other operating activities
Other
Federal, state, and
private grants
and contracts
Sub-total
Less
allowance
for
uncollectible accounts
Net
Accounts Receivable
ILLINOIS STATB UNIVERSITY
5,587,317
2,530,387
516,973
1,789,856
10,424,533
(1,806,256)
8,618,277
3,800,737
2,498,921
1,090,526
2,508,661
9,998,845
(1J23,633)
8,105,212
24
This is trial version
www.adultpdf.com
Notesto Financial
Statements June 30
2005
Note 5.
Student
Loans Receivable
Student loans receivable
at
June
30. 2005
and2004 are summarized
as
follows:
Perkins
student
loan
fund
Nursing
loan
fund
University
loan fund
Sub-total
Less
allowance for uncollectible
accounts
Net
Student Loans
Receivable
Estimated
current
portion
Estimated
noncurrent
portion
Total
2005
$
10,485,686
310,553
43,659
10,839,897
(911,784)
$
___2,e?gll_i_
$
1,722,235
8,205,878
$
___2f2!Jt!_
5,865,441
(255,104)
(202,000)
_JAo!337
2,541,257
2,867,080
5,408,337
2004
10,377,935
301,230
49,131
10,728,296
(900,784)
9,827,512
1,848,475
7,979,037
9,827,512
2004
9,365,997
(572,394)
(255,825)
__8,s3JlJL_
2,714,618
5,823,160
8,537,778
Note 6.
Foundation
Pledges
Receivable
Foundation
pledges
receivable at June
30,2005 and2004
are summarized
as
follows:
2005
$
s
$
$
$
$
Pledges
to be
collected
Less
discount for the time value
of
money
Less
allowance
for uncollectible
accounts
Net
Foundation Pledges Receivable
Estimated
current
portion
Estimated
noncurrent
portion
Total
Note 7. Deferred Revenue
Deferred
revenue
consists
of the
following
at June
30,
2005
and20A4:
Prepaid
tuition and
fees
Auxiliary
facilities
Grants
and contracts
Other
Deferred Revenue
2005
2004
2,671,409
488,764
978,679
176,986
2,461,908
507,875
1,626,562
152,160
ILLINOIS STATE
UNIVERSITY
4.315.838
$
4,749,505
25
This is trial version
www.adultpdf.com
Notes
to
Financial
Statements June
30.
2005
Note 8. Capital
Assets
Capital
assets
activity
for
the
year
ended
June
30, 2005 is
summarized as
follows:
$$$$$
239,885,128
$
13,553,122
$
1,460,047
$
_?lg;lg,6q!_
Capital assets
activity
for the
year
ended June
30,2004 is summarized as
follows:
Land
Land Improvements
Infrastructure
Buildings
Equipment
Library Materials
Construction
in Progress
Sub-total
Less
Accumulated Depreciation
for:
Land
Improvements
Infrastructure
Buildings
Equipment
Library Materials
Total Accumulated Depreciation
Capital
Assets, net
Land
Land Improvements
Infrastructure
Buildings
Equipment
Library
Materials
Construction
in Progress
Sub-total
Less Accumulated Depreciation
for:
Land Improvements
Infrastrucfure
Buildings
Equipment
Library Materials
Total
Accumulated Depreciation
Capital
Assets, net
Beginning
Balance
$$$$$
13,667,937
16,374,953
12,692,559
297,309,004
52,621,493
54,531,715
29,054,155
$
476,241,816
$
Additions
564,748
359,517
39,376,989
7,979,538
3,020,661
18,136,036
69,437,489
Retirements
151,927
647,335
1,333,023
36,498,939
38,631,224
234,514
1,225,533
Retirements
767,484
1,905,557
6,606,093
9,279,134
373,761
r,804,290
2,178,051
$
14,080,758
16,734,470
12,682,559
336,038,658
59,268,008
57,552,376
10,691,252
$
507,048,081
Ending
Balance
6,848,297
4,435,518
152,535,917
44,383,719
43,774,752
251,978,203
$
_41092,829_
Ending
Balance
6,481,555
4,141,690
146,063,357
41,321,692
41,876,834
Beginning
Balance
$
13,626,576
12,240,849
12,513,912
291,377,187
50,803,623
51,510,499
14,727,517
$
446,800,163
6,213,734
3,849,259
140,128,812
39,249,530
40,281,402
229,72?,733
$
366,742
293,828
6,707,074
4,287,560
1,897,918
Additions
4t,361
4,134,104
168,647
6,699,301
3,723,427
3,021,216
20,932,731
38,720,787
267,825
292,431
6,308,306
3,876,452
1,595,432
12,340,446
13,667,937
16,374,953
12,682,559
297,309,004
52,621,493
54,531,715
29,054,155
476,241,816
$
217,077,430
Foundation
net
capital assets were
$1,813,491and
$1,868,761
at June
30,
2005 and2004,
respectively.
ILLINOIS STATE
UNIVERSITY
$
6,481,555
4,141,690
146,063,357
41,321,692
41,876,834
$
239,885,128
$
ryJlg,6qq_
26
This is trial version
www.adultpdf.com
Notes to Financial
Statements
June
30
2005
Note
9. Long-term
Liabilities
UNIVERSITY
LONG-TERM
LIABILITIE S
Long-term liabilify
activity at
June 30, 2005 was as follows:
Beginning
Balance
Total
Accrued
compensated
absences
Revenue bonds
payable
Total
Current
portion
Accrued compensated
absences
Revenue
bonds
payable,
net
Total current
portion
Noncurrent
portion
Accrued
compensated absences
Revenue bonds
payable,
net
Total noncurrent
portion
$
__q,6z,0zl
$
19,509,424
58,751,606
s
__28,?q1,039_
2,195,314
4,775,987
___q2r,Jgl_
17,314,710
54,035,619
71,349,729
$
68,226,549
Long-term
liabilify activity at
June 30,2004 was
as follows:
Beginning
Balance
Total
Accrued compensated
absences
Revenue bonds
payable
Total
Current
portion
Accrued compensated
absences
Revenue bonds
payable,
net
Total
current
portion
Noncurrent
portion
Accrued
compensated absences
Revenue bonds
payable,
net
Total noncurrent
portion
ILLINOIS
STATB UNIVERSITY
19,005,384
55,918,240
_JI923,621_
2,001,611
4,695,464
n,a03,773
51,222,776
Additions
r,584,546
1,831,692
3,416,238
Retirements
1,554,958
4,770,000
$
___qgur8
Ending
Balance
19,034,972
52,979,932
_J2,0J4991_
1,905,81I
5,019,221
__6,nIW_
17,129,161
47,960,711
65,089,872
Ending
Balance
19,005,384
55,918,240
*
7
4923,624_
2,001,61I
4,695,464
__9,691,075_*
17,003,773
51,222,776
68,226,549
27
Additions
1,130,1
l7
r,956,634
:986Jsr_
Retirements
1,634,157
4,79A,000
6,424,157
This is trial version
www.adultpdf.com
Notes to Financial
Statements June
30,2005
Revenue
bonds
payable
at June 30,2005
and2004 consists of the
following:
2005
2004
Revenue Bonds,
Series 1989:
Capital Appreciation Bonds
Insured
Revenue
Bonds, Series L992:
Capital Appreciation
Bonds
Insured
Revenue
Bonds,
Series
1993:
Capital
Appreciation Bonds
Revenue Bonds, Series 1996:
Current Interest
Bonds
Capital
Appreciation Bonds
Revenue
Bonds,
Series 2003:
New
Project Bonds
Current Refunding
Bonds
Total revenue bonds
payable
10,062,967
9,034,025
1,126,449
8,478,575
7,120,179
9,364,764
12,125,501
1,060,757
9,333,326
6,720,202
7,359,791
9,797,946
$
52,979,932
7,462,327
9,851,363
$
55,918,240
Maturities and Interest Requirements on revenue bonds
payable
at June
30,2005,
are as
follows:
Year
Ending
June 30
2006
2007
2008
2009
2010
Sub-total
20ll-20r5
20t6-2020
2021-2023
Sub-total
Additions(Deductions) :
Unaccreted
Appreciation
Unamortized
Discounts
Unamortized
Premiums
Total
Principal
$
5,095,000
$
5,150,000
5,205,000
5,265,000
5,330,000
26,045,000
27,920,000
7,770,000
1,465,000
63,200,000
$
(10,671,381)
(56,425)
507,738
$
52,979,932
Interest
1,174,780
r,122,430
1,065,698
1,004,956
938,585
5,306,449
2,875,603
624,130
139,825
_
J246,001*
Total
6,269,780
6,272,430
6,270,698
6,269,956
6,268,585
31,351,449
30,795,603
8,394,130
1,604,825
72,146,007
ILLINOIS
STATE
UNIVBRSITY
28
This is trial version
www.adultpdf.com
Notes to Financial
Statements
June 30
200s
The
Series
1989, 1992,1993,1996
and2003 Bonds are
secured by
a
pledge
of the
net revenue of
auxiliary
facilities, as
well
as the
pledged
portion
of the
health
service and
athletic
&
service fees
charged to students.
On
October l, 1989,
$11,702,450
in
Revenue Bonds,
Series
1989 were issued. The
Series
1989 Bonds consisted
of
57,770,000
in
Cunent
Interest Bonds
and
$3,932,450
in Capital Appreciation
Bonds.
The Current
Interest
Bonds
mature
annually on
April I
,
commencing April l, 2013, through April 1,2014, and
bear
interest at 7
.40Yo.
Interest is
payable
on
April I
and
October
I of
each
year,
commencing
April l, 1990.
The Capital Appreciation
Bonds
have
a
principal
at maturity
of
$17,065,000
and an original
issue
discount
of
$13,132,550.
The
original
issue discount
is
being
accreted
to
interest
expense over the term of the bonds.
The Capital
Appreciation
Bonds mature semi-annually
commencing
April l, 2008, through
October
1,2012.
The Capital
Appreciation
Bonds were
issued
at
prices
to
yield
7 .30%
to
7 .35Yo at
maturity.
On April 9,1992,$27,094,107
in
Insured Revenue Bonds, Series
1992
were
issued.
The Series
1992
Bonds consisted
of
$16,125,000
in Current Interest Bonds and
$10,969,107
in
Capital
Appreciation
Bonds.
The
Current
Interest
Bonds
matured April
1,2001. The
Capital Appreciation
Bonds have
a
principal
at
maturity of
$25,115,000
and an
original
issue discount
of
$14,145,893.
The original issue discount is being accreted
to interest
expense
over
the term
of the
bonds. The
Capital Appreciation Bonds
yield
from
6.55%oto
6.950/o
interest
and mature semi-annually
commencing
October
l, 2001,
through
October
1,2007.
On June
23,
1993,$10,221,971in Insured Revenue Bonds, Series
1993 were
issued.
The Series
1993
Bonds consisted
of
$9,675,000
in
Current Interest Bonds
and
$546,971
inCapital
Appreciation Bonds.
The Current
Interest
Bonds
mature
beginning
April l,1994,
and continuing through
April 1,2014.
These Current
Interest Bonds
bear
interest from
3.00% to
5 .7
5o/o.
Interest is
payable
on
April I
and
October
1 of each
year,
commencing
October
l, 1993.
The Capital
Appreciation
Bonds have a
principal
at maturity of
$1,665,000
and
an original
issue discount
of
$l,l18,029.
The
original issue
discount is being
accreted
to interest expense over
the term
of the bonds.
The
Capital
Appreciation
Bonds
yield
6.10% interest
and
mature
October
l,20ll,
and April
1,2012.
On December 10, 1996,
$18,101,018
in
Revenue
Bonds,
Series 1996
were
issued.
The Series
1996
Bonds
consisted
of
$13,760,000
in Current
Interest
Bonds and
$4,341,018
in
Capital
Appreciation
Bonds.
The
Current
Interest
Bonds
mature
beginning
April 1,
1999, and continuing through
April
l, 2013.
These Current
Interest
Bonds bear
interest
from
4.30%
to 5 .40oh.
Interest is
payable
on April
I
and
October
I
of
each
year,
commencing
April
l,
1997 . The
Capital
Appreciation
Bonds
have a
principal
at
maturity
of
$12,755,000
and an original
issue
discount
of
$8,413,982.
The
original
issue
discount is
being
accreted
to
interest expense over the
term
of the bonds.
The Capital
Appreciation
Bonds
yield
5.80%to
5.90Yo
interest and mature
annually commencing
April
1,2014,
through
April
1,2016.
On March I
l,
2003,
$16,905,000
in Revenue Bonds, Series
2003
were issued.
The
Series
2003 Bonds
consisted
of
$7,570,000
of
New
Project Bonds
and
$9,335,000
in
Current
Refunding
Bonds.
The New
Project
Bonds mature
beginning
April 1,2004,
and continuing
through April 1,2023.
These
New
Project
Bonds bear
interest
from 2.00%oto
4.70%.
Interest is
payable
on April
I and October
I
of each
year,
commencing
October
l,
2003.
The
Current
Refunding Bonds mature beginning April 1,2012, and continuing
through
April 1,2014.
The
Current
Refunding
Bonds bear
interest from 4.00% to 5.00%.
Interest is
payable
on
April I and
October
I of
each
year,
commencing
October
1,2003
,
DEFEASED BONDS
In June l993,the Universify
defeased
a
portion
of the Series 1989
Bonds
by creating
a separate
irrevocable
trust fund.
New debt
(Series
1993
Bonds)
was
issued and the
proceeds
used
to
purchase
U.S.
Treasury
securities
that
were
placed
in
the trust fund.
The investments and fixed earnings
from the investment
are sufficient
to
service
the
defeased
amount
until the
debt
matures. For financial
reporting
purposes,
the debt
has been
considered
defeased
and
removed
as
a
liability on the
Statements
of Net
Assets. The
defeased debt
outstanding
for the
years ended
June
30, 2005
and2004
was
$9,831,584
and
$9,688,020,
respectively.
ILLINOIS STATE
UNIVERSITY
29
This is trial version
www.adultpdf.com
FOT]NDATION
LONG-TERM
LIABILITfES
Long-term
liability
activity at June
30,
2005 was
as follows:
Beginning
Balance
Total
Beneficiary payments
Accrued
compensated
absences
Notes
payable
Total
Current
portion
Beneficiary payments
Notes
payable
Total
current
portion
Noncurrent
portion
Beneficiary
payments
Accrued
compensated
absences
Notes
payable
Total noncurrent
portion
166,890
Long-term liability
activity
at June
30,2A04 was
as follows:
Beginning
Balance
Total
Beneficiary payments
Accrued
compensated
absences
Notes
payable
Total
Current
portion
Beneficiary payments
Notes
payable
Total
current
portion
Noncurrent
portion
Beneficiary
payments
Accrued
compensated
absences
Notes
payable
Total noncurrent
portion
s
__1,221,5n_
$
__122,541
697.040
164,815
22,926
1,000,000
_JJ8U4r
20,951
1,000,000
_1,020,851_
r43,964
22,926
ll9,7lg
l0l,851
1,000,000
Additions
23
l,l 18
726
s
__231,844
Retirements
Ending
Balance
22,545
700,000
373,388
23,652
300,000
Additions Retirements
63,939
18,843
78,925
41,414
41,414
331,974
23,652
300,000
655,626
Ending
Balance
164,915
22,926
1,000,000
l,lg7,74l
20,951
1,000,000
__
1,020,951_
143,964
22,926
$
__€,939_
97,768
18,200
$
___18,200
$
101,519
l0l
,95
I
1,000,000
$
1,203,370
166.890
Foundation
notes
payable
at June
30,
2005
is
comprised
of a
$1,000,000
line of
credit
($300,000
outstanding as of
June
30, 2005)
secured
by all
accounts
on deposit
with
the lender, requiring
monthly interest
payments
at
l.21Younder
the
lender's
prime
rate with
a
maturity
date
of
April2007.
The Foundation's
interest
rate atJune
30,
2005 was
5o4.
ILLINOIS
STATE
UNIVERSITY
30
Notes to
Financial
Statements
June
30 2005
This is trial version
www.adultpdf.com
Notes to
Financial
Statements
June 30
2005
During the
year
ended
June
30, 2005,
the
Foundation
retired
$700,000
of the
note. Proceeds
of
the
original
loan
amount were used
to construct Ewing Theatre.
ACCRUED
COMPENSATED
ABSENCES
Compensated absences
consist
of
accrued
vacation and sick leave.
The
total
for
accrued
vacation
and sick leave
for
the
University and the Foundation
is
shown below:
2005
Vacation Sick
Total
Note
10.
Leases
CAPITALTZED LEASES
Certain
leases in which
the Board of Trustees,
governing
board
of
the University,
is the
lessee are
considered
to be
equivalent to
installment purchases
for
accounting
presentation.
The
assets recorded
under
these leases
have
been
capitalized at the
present
value
of
future
lease
payments,
measured at
lease inception
date as
required by
Financial
Accounting Standards
Board
(FASB)
Statement No. 13. Cost and
accumulated
depreciation
for
these
capital
assets
were
$1,085,424
andS22l,46l
at
June
30,
2005 and
$653,791
and$364,418
at June 30,2004,
respectively.
Obligations under capital leases
activity at June 30,
2005 was
as
follows:
University
Foundation
Obligations
under
capital
leases
Current
portion
Noncurrent
portion
Obligations under
capital
leases
Current
portion
Noncurrent
portion
University
Foundation
2004
$
8,827,382
17,516
Vacation
$
&r4srss
17,235
$
10,207,590
6,136
Sick
10,856,729
5,691
Additions
$
821,943
Additions
19,034,972
23,652
Total
19,005,384
22,926
Reductions
Beginning
Balance
259,020
106,909
l52,lll
$
303,454
$
777,509
227,605
549,904
Reductions
Ending
Balance
Ending
Balance
259,020
106,909
l52,lll
Obligations under
capital
leases
activity at June 30,2004
was as follows:
Beginning
Balance
389,
I
89
47,155
167,353
221,836
177,324
31
ILLINOIS STATE
UNIVERSITY
This is trial version
www.adultpdf.com