Electricity Infrastructures in the Global Marketplace Part 6 pot
Bạn đang xem bản rút gọn của tài liệu. Xem và tải ngay bản đầy đủ của tài liệu tại đây (2.94 MB, 50 trang )
Geothermal Power Generation: Global Perspectives,
Technology, Direct Uses, Plants, Drilling and Sustainability Worldwide 219
To utilize the two-phase heat source in a more efficient manner, a secondary organic loop,
which uses the extra available steam, can be used. The cycle is shown in Figure 5.10. It is
feasible when vapour extraction is possible within the expansion phase of the organic cycle.
The simplest way to perform the extraction is with two turbines in series. In this case, some
vapour is extracted between the high pressure and the low-pressure turbines and is
condensed at an intermediate pressure (and temperature).
Source: Ormat Technologies, Inc., USA
Fig. 5.10. Secondary organic loop cycle
The condensed vapour preheats the main organic fluid stream as it exits the recuperator.
The extracted organic fluid forms a secondary cycle that generates an additional 5 to 8
percent electrical power. When there is extra steam compared to brine (higher enthalpy) the
above cycle is effective and the cooling temperature of the brine plus condensate is limited.
Figure 5.11 is a flow temperature diagram of the higher enthalpy cases. Line A is the simple
two-phase cycle preheating phase. The significant irreversibility is represented by the large
space between the steam and brine lines and line A. Line B shows the preheating phase in a
recuperated two-phase cycle; the irreversibility is reduced and the cycle efficiency is
increased accordingly.
The third line C demonstrates the additional gain in efficiency by using the two-
phase/extraction cycle. The line moves further to the right, thus decreasing the gap between
the heating line and the working fluid line. Another indication of the increase in efficiency
from cycle A to B and to C, is the increasing heat quantity for heating the working fluid, as
presented by points QA, QB, and QC.
Source: Ormat Technologies, Inc., USA
Fig. 5.11. Higher enthalpy
5.8.3.5 Use of a Back Pressure Steam Turbine
Another approach for the higher enthalpy two-phase heat source is use of a back pressure
steam turbine which generates extra power from excess steam not required for the vaporizer
of the ORC.
Part of the preheating of the organic fluid is now done with low-pressure steam exiting the
backpressure steam turbine (Figure. 5.12).
Source: Ormat Technologies, Inc., USA
Fig. 5.12. Pre-heating using exhaust in a backpressure steam turbine
Electricity Infrastructures in the Global Marketplace220
The gap between the steam and the preheating line of the organic fluid could be filled even
more efficiently by a multi-stage (two or more) backpressure steam turbine, with extraction
of steam between the stages. But the decision on the number of stages is based on
consideration of trade-off in process optimization between higher efficiency and
complication (and cost) of the system.
5.8.3.6 Geothermal Combined Cycle [38]
For high enthalpy fluids with very high steam content a solution is the geothermal
combined cycle configuration where the steam flows through the back pressure turbine to
the vaporizer, while the separated brine is used for preheating or in a separated ORC
(Figure 5.13) [38].
Vaporizer
Preheater
Condenser
GG
Separator
Steam Turbine
Organic Fluid Turbine
Production well
Injection well
To Brine Unit
Source: Ormat Technologies, Inc., USA
Fig. 5.13. Geothermal combined cycle
5.8.4 Deployment
As of 2007, the capacity of geothermal plants using advanced power cycles worldwide is close
to 1,000 MW, approximately 10% of the total geothermal capacity installed in the last 50 years.
A breakdown of the 1,000 MW of plants in commercial operation is as follows: 60 MW of
ORC plants designed or built by Ben Holt, Turboden and Barber-Nichols; one 2 MW of
Kalina cycle plant and more than 900 MW of ORC and combined cycle plants.
5.8.5 Enhancing Sustainability and Cost Effectiveness
Geothermal resources are complex geological structures that provide conduits for natural
heat of the earth to heat underground waters that may then be utilised to convey heat to the
surface. Technology to assess the heat content of geothermal resources is available, along
with drilling technologies to access this heat and mature proven power technologies to
convert this heat to commercial electricity.
The key to sustainability of this power generation lies in not depleting the waters that
convey this energy to the surface.
The use of the field-proven air-cooled Organic Rankine Cycle based geothermal power plant
enables these objectives to be achieved by extending the lifespan of the wells and reducing
emissions.
Hence cost-effective power is generated with enhanced sustainability, mitigating depletion
of geothermal resources. This element is particularly important in proposed Engineering
Geothermal Systems.
5.9 Iceland Deep Drilling Project, Exploration of
Deep Unconventional Geothermal Resources
The Iceland Deep Drilling Project (IDDP) is a long-term research and development program
aimed to improve the efficiency and economics of geothermal power generation by
harnessing deep natural supercritical hydrous fluids obtained at drillable depths. Producing
supercritical fluids will require drilling wells and sampling fluids and rocks to depths of 3.5
to 5 km, and at temperatures of 450-600°C. The current plan is to drill and test a series of
such deep boreholes in Iceland at the Krafla, the Hengill, and the Reykjanes high
temperature geothermal fields. Investigations have indicated that the hydrothermal system
extends beyond the three already developed target zones, to depths where temperatures
should exceed 550-650°C. A deep well producing 0.67m
3
/sec steam (~2400m
3
/h) from a
reservoir with a temperature significantly above 450°C could yield enough high-enthalpy
steam to generate 40-50 MW
el
of electric power. This exceeds by an order of magnitude the
power typically obtained from conventional geothermal wells.
The Project was initiated in 2000 by an Icelandic energy consortium, consisting of Hitaveita
Sudurnesja Ltd. (HS), Landsvirkjun (LV), Orkuveita Reykjavikur (OR) and the Icelandic
National Energy Authority Orkustofnun (OS). In 2007, Alcoa Inc. joined the IDDP
consortium. The principal aim of the IDDP is to enhance the economics of high temperature
geothermal resources by producing from deep reservoirs at supercritical conditions.
5.9.1 Supercritical Geothermal Fluids
Large changes in physical properties of fluids occur near the critical point in dilute systems.
Orders of magnitude increases in the ratio of buoyancy forces to viscous forces occur that can
lead to extremely high rates of mass and energy transport. Because of major changes in the
solubility of minerals above and below the critical state, supercritical phenomena can play a
major role in high temperature water/rock reaction and the transport of dissolved metals.
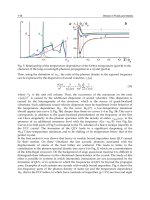
At temperatures and pressures above the critical point, which for pure water is at 221 bars
and 374°C, only a single-phase supercritical fluid exists. Figure 5.14 shows the pressure-
enthalpy diagram for pure water, showing selected isotherms. Steam turbines in geothermal
plants generate electricity by condensing the steam separated from the two phase field
(liquid and steam field in Figure 5.14) which, depending upon the enthalpy and pressure at
which steam separation occurs, is often only 20-30% of the total mass flow. The concept
behind the Deep Drilling program is to bring supercritical fluid to the surface in such a way
that it transitions directly to superheated steam along a path like F-G in Figure 5.14,
resulting in a much greater power output than from a typical geothermal well.
Geothermal Power Generation: Global Perspectives,
Technology, Direct Uses, Plants, Drilling and Sustainability Worldwide 221
The gap between the steam and the preheating line of the organic fluid could be filled even
more efficiently by a multi-stage (two or more) backpressure steam turbine, with extraction
of steam between the stages. But the decision on the number of stages is based on
consideration of trade-off in process optimization between higher efficiency and
complication (and cost) of the system.
5.8.3.6 Geothermal Combined Cycle [38]
For high enthalpy fluids with very high steam content a solution is the geothermal
combined cycle configuration where the steam flows through the back pressure turbine to
the vaporizer, while the separated brine is used for preheating or in a separated ORC
(Figure 5.13) [38].
Vaporizer
Preheater
Condenser
GG
Separator
Steam Turbine
Organic Fluid Turbine
Production well
Injection well
To Brine Unit
Source: Ormat Technologies, Inc., USA
Fig. 5.13. Geothermal combined cycle
5.8.4 Deployment
As of 2007, the capacity of geothermal plants using advanced power cycles worldwide is close
to 1,000 MW, approximately 10% of the total geothermal capacity installed in the last 50 years.
A breakdown of the 1,000 MW of plants in commercial operation is as follows: 60 MW of
ORC plants designed or built by Ben Holt, Turboden and Barber-Nichols; one 2 MW of
Kalina cycle plant and more than 900 MW of ORC and combined cycle plants.
5.8.5 Enhancing Sustainability and Cost Effectiveness
Geothermal resources are complex geological structures that provide conduits for natural
heat of the earth to heat underground waters that may then be utilised to convey heat to the
surface. Technology to assess the heat content of geothermal resources is available, along
with drilling technologies to access this heat and mature proven power technologies to
convert this heat to commercial electricity.
The key to sustainability of this power generation lies in not depleting the waters that
convey this energy to the surface.
The use of the field-proven air-cooled Organic Rankine Cycle based geothermal power plant
enables these objectives to be achieved by extending the lifespan of the wells and reducing
emissions.
Hence cost-effective power is generated with enhanced sustainability, mitigating depletion
of geothermal resources. This element is particularly important in proposed Engineering
Geothermal Systems.
5.9 Iceland Deep Drilling Project, Exploration of
Deep Unconventional Geothermal Resources
The Iceland Deep Drilling Project (IDDP) is a long-term research and development program
aimed to improve the efficiency and economics of geothermal power generation by
harnessing deep natural supercritical hydrous fluids obtained at drillable depths. Producing
supercritical fluids will require drilling wells and sampling fluids and rocks to depths of 3.5
to 5 km, and at temperatures of 450-600°C. The current plan is to drill and test a series of
such deep boreholes in Iceland at the Krafla, the Hengill, and the Reykjanes high
temperature geothermal fields. Investigations have indicated that the hydrothermal system
extends beyond the three already developed target zones, to depths where temperatures
should exceed 550-650°C. A deep well producing 0.67m
3
/sec steam (~2400m
3
/h) from a
reservoir with a temperature significantly above 450°C could yield enough high-enthalpy
steam to generate 40-50 MW
el
of electric power. This exceeds by an order of magnitude the
power typically obtained from conventional geothermal wells.
The Project was initiated in 2000 by an Icelandic energy consortium, consisting of Hitaveita
Sudurnesja Ltd. (HS), Landsvirkjun (LV), Orkuveita Reykjavikur (OR) and the Icelandic
National Energy Authority Orkustofnun (OS). In 2007, Alcoa Inc. joined the IDDP
consortium. The principal aim of the IDDP is to enhance the economics of high temperature
geothermal resources by producing from deep reservoirs at supercritical conditions.
5.9.1 Supercritical Geothermal Fluids
Large changes in physical properties of fluids occur near the critical point in dilute systems.
Orders of magnitude increases in the ratio of buoyancy forces to viscous forces occur that can
lead to extremely high rates of mass and energy transport. Because of major changes in the
solubility of minerals above and below the critical state, supercritical phenomena can play a
major role in high temperature water/rock reaction and the transport of dissolved metals.
At temperatures and pressures above the critical point, which for pure water is at 221 bars
and 374°C, only a single-phase supercritical fluid exists. Figure 5.14 shows the pressure-
enthalpy diagram for pure water, showing selected isotherms. Steam turbines in geothermal
plants generate electricity by condensing the steam separated from the two phase field
(liquid and steam field in Figure 5.14) which, depending upon the enthalpy and pressure at
which steam separation occurs, is often only 20-30% of the total mass flow. The concept
behind the Deep Drilling program is to bring supercritical fluid to the surface in such a way
that it transitions directly to superheated steam along a path like F-G in Figure 5.14,
resulting in a much greater power output than from a typical geothermal well.
Electricity Infrastructures in the Global Marketplace222
The conditions under which steam and water coexist is shown by the shaded area, bounded
by the boiling point curve to the left and the dew point curve to the right. The arrows show
different possible cooling paths (from Fournier
1
, 1999).
Fig. 5.14. Pressure enthalpy diagram for pure H
2
O with selected isotherms
Supercritical conditions have been encountered during drilling in a small number of
geothermal fields, like in Larderello in Italy, Kakkonda in Japan, and at Nesjavellir in
Iceland, where they have presented problems for commercial exploitation and were sealed
off from the conventional part of the systems. Apart from the high P-T conditions where
underground blowout was involved, like at Nesjavellir [39] (Steingrimsson et al., 1990), the
problems include low permeability, hole instability due to thermal creep, and the presence
of acid volcanic gases. However, the drilling technology used in these cases was not
designed to handle the conditions encountered when supercritical hydrous fluids were
unexpectedly penetrated.
1
Fournier, R. Hydrothermal Processes Related to Moment of Fluid Flow
from Plastic into Brittle Rock in the Magmatic-Epithermal
Environment, Economic Geology, Vol. 94, (8), 1999, pp. 1193-1211.
The IDDP intends to meet the hostile conditions expected in supercritical geothermal
reservoirs by a conservative well design and by adopting the necessary safety measures.
The safety casing will be cemented down to 2.4 km before drilling down to 3.5 km depth or
deeper to reach the critical point. Once beyond that, the production casing will be cemented
in order to produce only the supercritical fluid. By releasing the pressure, the supercritical
fluid will expand and move upwards to the surface through the well bore as a superheated
dry steam, following a path like F-G in Figure 5.14. The deep casings will prevent the fluid
from mixing with the two-phase zone and as the pressure decreases, condensation is less
likely to occur. A pilot study for harnessing the fluid will need to be undertaken, especially
with respect to the fluid chemistry that will only be known after drilling.
5.9.2 Drilling in IDDP Wells
5.9.2.1 Design
Conventional geothermal drilling techniques will be used in drilling the IDDP wells. The
first well was designed as a dual-purpose hole. To meet the engineering goals of the power
companies, it is designed as an exploration/production well, and to meet the scientific goals
of understanding the supercritical environment, some spot cores will be taken in the lowest
part of the drill hole, which hopefully will be the supercritical zone.
5.9.2.2 Potential Drill Sites
Geothermal reservoirs at supercritical conditions are potentially to be found worldwide in
any active volcanic complex. However, the depth to such reservoirs may vary greatly from
shallow to deep, and the simplest approach would be to seek supercritical reservoirs in
active high-temperature geothermal fields, closest to the earth’s surface, in both sub aerial
and submarine settings. Each high temperature hydrothermal system requires site-specific
attention to target drill sites for reaching deep unconventional geothermal resource (DUGR)
reservoirs with supercritical conditions and permeable rocks at drillable depths.
All active volcanic complexes are potential targets for finding deep geothermal systems at
supercritical conditions. These volcanic complexes are of different ages and at different
stages in their evolution; some are at infancy, others are mature and some are close to
extinction.
The three Icelandic fields deemed to be prime targets for DUGR exploration, the Reykjanes,
Hengill and Krafla geothermal systems, demonstrate different stages in the evolution of
their magma-hydrothermal evolution, the first being at infancy, the second being “middle
aged” and the third being mature. Deep drilling at all three will permit studying different
stages in the development of supercritical conditions at depth. Additionally, they exhibit
different fluid compositions, the first involving modified seawater, but the other two dilute
fluids of meteoric origin. Extensive production in all three-drill fields has led to the hottest
parts of the hydrothermal up-flow zones. However, the nature of their heat sources is
poorly known except in the mature case of the Krafla system where a magna chamber has
been identified at only 3-4 km depth [40].
Geothermal Power Generation: Global Perspectives,
Technology, Direct Uses, Plants, Drilling and Sustainability Worldwide 223
The conditions under which steam and water coexist is shown by the shaded area, bounded
by the boiling point curve to the left and the dew point curve to the right. The arrows show
different possible cooling paths (from Fournier
1
, 1999).
Fig. 5.14. Pressure enthalpy diagram for pure H
2
O with selected isotherms
Supercritical conditions have been encountered during drilling in a small number of
geothermal fields, like in Larderello in Italy, Kakkonda in Japan, and at Nesjavellir in
Iceland, where they have presented problems for commercial exploitation and were sealed
off from the conventional part of the systems. Apart from the high P-T conditions where
underground blowout was involved, like at Nesjavellir [39] (Steingrimsson et al., 1990), the
problems include low permeability, hole instability due to thermal creep, and the presence
of acid volcanic gases. However, the drilling technology used in these cases was not
designed to handle the conditions encountered when supercritical hydrous fluids were
unexpectedly penetrated.
1
Fournier, R. Hydrothermal Processes Related to Moment of Fluid Flow
from Plastic into Brittle Rock in the Magmatic-Epithermal
Environment, Economic Geology, Vol. 94, (8), 1999, pp. 1193-1211.
The IDDP intends to meet the hostile conditions expected in supercritical geothermal
reservoirs by a conservative well design and by adopting the necessary safety measures.
The safety casing will be cemented down to 2.4 km before drilling down to 3.5 km depth or
deeper to reach the critical point. Once beyond that, the production casing will be cemented
in order to produce only the supercritical fluid. By releasing the pressure, the supercritical
fluid will expand and move upwards to the surface through the well bore as a superheated
dry steam, following a path like F-G in Figure 5.14. The deep casings will prevent the fluid
from mixing with the two-phase zone and as the pressure decreases, condensation is less
likely to occur. A pilot study for harnessing the fluid will need to be undertaken, especially
with respect to the fluid chemistry that will only be known after drilling.
5.9.2 Drilling in IDDP Wells
5.9.2.1 Design
Conventional geothermal drilling techniques will be used in drilling the IDDP wells. The
first well was designed as a dual-purpose hole. To meet the engineering goals of the power
companies, it is designed as an exploration/production well, and to meet the scientific goals
of understanding the supercritical environment, some spot cores will be taken in the lowest
part of the drill hole, which hopefully will be the supercritical zone.
5.9.2.2 Potential Drill Sites
Geothermal reservoirs at supercritical conditions are potentially to be found worldwide in
any active volcanic complex. However, the depth to such reservoirs may vary greatly from
shallow to deep, and the simplest approach would be to seek supercritical reservoirs in
active high-temperature geothermal fields, closest to the earth’s surface, in both sub aerial
and submarine settings. Each high temperature hydrothermal system requires site-specific
attention to target drill sites for reaching deep unconventional geothermal resource (DUGR)
reservoirs with supercritical conditions and permeable rocks at drillable depths.
All active volcanic complexes are potential targets for finding deep geothermal systems at
supercritical conditions. These volcanic complexes are of different ages and at different
stages in their evolution; some are at infancy, others are mature and some are close to
extinction.
The three Icelandic fields deemed to be prime targets for DUGR exploration, the Reykjanes,
Hengill and Krafla geothermal systems, demonstrate different stages in the evolution of
their magma-hydrothermal evolution, the first being at infancy, the second being “middle
aged” and the third being mature. Deep drilling at all three will permit studying different
stages in the development of supercritical conditions at depth. Additionally, they exhibit
different fluid compositions, the first involving modified seawater, but the other two dilute
fluids of meteoric origin. Extensive production in all three-drill fields has led to the hottest
parts of the hydrothermal up-flow zones. However, the nature of their heat sources is
poorly known except in the mature case of the Krafla system where a magna chamber has
been identified at only 3-4 km depth [40].
Electricity Infrastructures in the Global Marketplace224
5.9.3 Potential Benefits
5.9.3.1 Power Generation
The high-temperature fluids expected from the IDDP wells offer two advantages over fluids
from conventional wells for generation of electric power, (i) higher enthalpy, which
promises high power output per unit mass, and (ii) higher pressure which keeps the fluid
density high and thus contributes to a high mass-flow rate.
The electric power output that can be expected from an IDDP well compared with that from
a conventional has been estimated by Albertsson et. Al. [41,42].
The choice of technology to be applied for the power generation cannot be decided until the
physical and chemical properties of the fluid are determined. Nonetheless, it appears likely
that the fluid will be used indirectly, in a heat exchange circuit of some kind. In such a
process the fluid from the well would be cooled and condensed in a heat exchanger and
then injected back into the field. This heat exchanger would act as an evaporator in a
conventional closed power-generating cycle.
5.9.3.2 Scientific Studies
In addition to investigations and sampling of fluids at supercritical conditions the IDDP will
permit scientific studies of a broad range of important geological issues, such as
investigation of the development of a large igneous province, and the nature of magma-
hydrothermal fluid circulation on the landward extension of the Mid-Atlantic Ridge in
Iceland. In addition, the IDDP will require use of techniques for high-temperature drilling,
well completion, logging, and sampling, techniques that will have a potential for
widespread applications in drilling into oceanic and continental high-temperature
hydrothermal systems.
5.9.3.3 Economic Benefits
The potential economic benefits of the IDDP project may be listed as follows:
1) Increased power output per well, perhaps by an order of magnitude, and production
of higher-value, high-pressure, high-temperature steam.
2) Development of an environmentally benign, high-enthalpy energy source beneath
currently producing geothermal fields.
3) Extended lifetime of the exploited geothermal reservoirs and power generation
facilities.
4) Re-evaluation of the geothermal resource base.
5) Industrial, educational, and economic spin-off.
6) Knowledge of permeability within drill fields deeper than 2-3 km depth.
7) Knowledge of heat transfer from magma to water.
8) Heat sweeping by injection of water into hot, deep wells.
9) Possible extraction of valuable chemical products.
10) Advances in research on ocean floor hydrothermal systems (the Reykjanes field).
Amongst approaches to improve the economics of the geothermal industry, three of the
most significant are: (i) to reduce the cost of drilling and completing geothermal production
wells as far as possible, (ii) to cascade the usage of thermal energy by using the effluent
water for domestic heating and for industrial processes, and (iii) to reduce the number of
wells needed by increasing the power output of each well, by producing supercritical fluids.
Accordingly, the completion of the IDDP project is of considerable importance for the
geothermal industry at large.
5.9.3.4 Environmental Issues
Developing environmentally benign high-enthalpy energy sources below the depth of
currently producing geothermal fields is not only of economic value in relation to the
already installed infrastructures, but it is also of environmental value by diminishing
environmental impact of geothermal utilization. Producing more power without increasing
the footprint of the exploited drill field is a significant benefit.
5.9.4 Potential Impacts
5.9.4.1 Global Impacts
Potential impact of utilizing geothermal resources at supercritical conditions could become
quite significant. Not only would this call for re-evaluation of the geothermal energy resource
base on a local scale, but also on a global scale. If producing supercritical fluids became
widespread it would lead to a major enlargement of the accessible geothermal resource base.
It is conceivable that, in the more distant future, utilization of ocean floor geothermal
systems might become viable. Submarine geothermal systems are abundant along the
world’s mid-ocean ridge systems and some of them (the black smokers) expel ~400°C hot
seawater direct into the deep oceans, and precipitate chimneys of sulphide-ore deposits. The
pressure of 2.5-3 km deep seawater results in supercritical hydrostatic pressures, and allows
almost supercritical fluids to be expelled directly into the oceans. Tapping energy through
shallow drill holes on the mid-ocean ridges using techniques initially developed by the
international IDDP program is an exciting prospect.
5.9.4.2 Potential Impact on Greenhouse Gases
In the Stern Review to the British Government 2006 [43] (www.sternreview.org.uk) it is
reported that since industrialization, greenhouse gas (GHG) levels have risen from 280 ppm
CO
2
equivalent (CO
2
e) to 430 ppm CO
2
e today, and they increase by 2 ppm each year. The
risks of the worst impacts of climate change can be substantially reduced, according to the
review, if the GHG levels can be stabilized between 450 and 550 ppm CO
2
e. Stabilization in this
range would require emissions to be at least 25% below current levels by 2050, and perhaps
much more. According to the Review, three measures need be taken, (1) taxation on GHG
emission, (2) new techniques, and (3) removal of hindrances against economic energy usage.
According to the Stern Report the main sources of the polluting greenhouse gases are 24% in
the Power Sector, 14% in the Industry sector, another 14% in the Transport sector, and 5% in
other energy related activities, altogether some 57%. Attempting to decrease CO
2
e emission in
any of these sectors would be a logical step to respond to the Stern Review.
Geothermal Power Generation: Global Perspectives,
Technology, Direct Uses, Plants, Drilling and Sustainability Worldwide 225
5.9.3 Potential Benefits
5.9.3.1 Power Generation
The high-temperature fluids expected from the IDDP wells offer two advantages over fluids
from conventional wells for generation of electric power, (i) higher enthalpy, which
promises high power output per unit mass, and (ii) higher pressure which keeps the fluid
density high and thus contributes to a high mass-flow rate.
The electric power output that can be expected from an IDDP well compared with that from
a conventional has been estimated by Albertsson et. Al. [41,42].
The choice of technology to be applied for the power generation cannot be decided until the
physical and chemical properties of the fluid are determined. Nonetheless, it appears likely
that the fluid will be used indirectly, in a heat exchange circuit of some kind. In such a
process the fluid from the well would be cooled and condensed in a heat exchanger and
then injected back into the field. This heat exchanger would act as an evaporator in a
conventional closed power-generating cycle.
5.9.3.2 Scientific Studies
In addition to investigations and sampling of fluids at supercritical conditions the IDDP will
permit scientific studies of a broad range of important geological issues, such as
investigation of the development of a large igneous province, and the nature of magma-
hydrothermal fluid circulation on the landward extension of the Mid-Atlantic Ridge in
Iceland. In addition, the IDDP will require use of techniques for high-temperature drilling,
well completion, logging, and sampling, techniques that will have a potential for
widespread applications in drilling into oceanic and continental high-temperature
hydrothermal systems.
5.9.3.3 Economic Benefits
The potential economic benefits of the IDDP project may be listed as follows:
1) Increased power output per well, perhaps by an order of magnitude, and production
of higher-value, high-pressure, high-temperature steam.
2) Development of an environmentally benign, high-enthalpy energy source beneath
currently producing geothermal fields.
3) Extended lifetime of the exploited geothermal reservoirs and power generation
facilities.
4) Re-evaluation of the geothermal resource base.
5) Industrial, educational, and economic spin-off.
6) Knowledge of permeability within drill fields deeper than 2-3 km depth.
7) Knowledge of heat transfer from magma to water.
8) Heat sweeping by injection of water into hot, deep wells.
9) Possible extraction of valuable chemical products.
10) Advances in research on ocean floor hydrothermal systems (the Reykjanes field).
Amongst approaches to improve the economics of the geothermal industry, three of the
most significant are: (i) to reduce the cost of drilling and completing geothermal production
wells as far as possible, (ii) to cascade the usage of thermal energy by using the effluent
water for domestic heating and for industrial processes, and (iii) to reduce the number of
wells needed by increasing the power output of each well, by producing supercritical fluids.
Accordingly, the completion of the IDDP project is of considerable importance for the
geothermal industry at large.
5.9.3.4 Environmental Issues
Developing environmentally benign high-enthalpy energy sources below the depth of
currently producing geothermal fields is not only of economic value in relation to the
already installed infrastructures, but it is also of environmental value by diminishing
environmental impact of geothermal utilization. Producing more power without increasing
the footprint of the exploited drill field is a significant benefit.
5.9.4 Potential Impacts
5.9.4.1 Global Impacts
Potential impact of utilizing geothermal resources at supercritical conditions could become
quite significant. Not only would this call for re-evaluation of the geothermal energy resource
base on a local scale, but also on a global scale. If producing supercritical fluids became
widespread it would lead to a major enlargement of the accessible geothermal resource base.
It is conceivable that, in the more distant future, utilization of ocean floor geothermal
systems might become viable. Submarine geothermal systems are abundant along the
world’s mid-ocean ridge systems and some of them (the black smokers) expel ~400°C hot
seawater direct into the deep oceans, and precipitate chimneys of sulphide-ore deposits. The
pressure of 2.5-3 km deep seawater results in supercritical hydrostatic pressures, and allows
almost supercritical fluids to be expelled directly into the oceans. Tapping energy through
shallow drill holes on the mid-ocean ridges using techniques initially developed by the
international IDDP program is an exciting prospect.
5.9.4.2 Potential Impact on Greenhouse Gases
In the Stern Review to the British Government 2006 [43] (www.sternreview.org.uk) it is
reported that since industrialization, greenhouse gas (GHG) levels have risen from 280 ppm
CO
2
equivalent (CO
2
e) to 430 ppm CO
2
e today, and they increase by 2 ppm each year. The
risks of the worst impacts of climate change can be substantially reduced, according to the
review, if the GHG levels can be stabilized between 450 and 550 ppm CO
2
e. Stabilization in this
range would require emissions to be at least 25% below current levels by 2050, and perhaps
much more. According to the Review, three measures need be taken, (1) taxation on GHG
emission, (2) new techniques, and (3) removal of hindrances against economic energy usage.
According to the Stern Report the main sources of the polluting greenhouse gases are 24% in
the Power Sector, 14% in the Industry sector, another 14% in the Transport sector, and 5% in
other energy related activities, altogether some 57%. Attempting to decrease CO
2
e emission in
any of these sectors would be a logical step to respond to the Stern Review.
Electricity Infrastructures in the Global Marketplace226
The World Energy Council (WEC) has presented several scenarios for meeting future energy
requirements with varying emphasis on economic growth rates, technological progress,
environmental protection and international equity [44] (Nakicenovic et al., 1998). In all WEC´s
scenarios, the peak of the fossil fuel era has already passed (Nakicenovic et al., 1998). Oil and
gas are expected to continue to be important sources of energy in all cases, but the role of
renewable energy sources and nuclear energy vary highly in the scenarios and the level to
which these energy sources replace coal. In all the scenarios, the renewables are expected to
become very significant contributors to the world primary energy consumption, providing 20-
40% of the primary energy in 2050 (UK 80%) and 30-80% in 2100. They are expected to cover a
large part of the increase in energy consumption and to replace coal.
Evidently, a large opportunity to cut GHG emission exists with the geothermal energy
sector. However this estimate did not include innovations such as IDDP.
In summary, the long-term program to improve efficiency and economics of geothermal
energy by harnessing deep unconventional geothermal resources is an ambitious project to
produce electricity from natural supercritical hydrous fluids from drillable depths.
Producing higher-temperature fluids for generation of electric power offers two advantages
over using the fluids from conventional wells: (i) higher enthalpy, which promises high
power output and higher efficiency per unit mass, and (ii) higher pressure, which keeps the
fluid density high and thus contributes to higher mass-flow rates. The choice of technology
to be applied for power generation from these high-temperature fluids will be decided after
determining the physical and chemical properties of the fluids that are produced.
There are three approaches to improve the economics of the geothermal industry worldwide:
(i) cascading the usage of geothermal energy by using the effluent water from electricity
production for industrial processes and for domestic heating, (ii) reducing the cost of drilling
and completing geothermal production wells, and (iii) reducing the number of wells needed by
increasing the power output of each. The best way to achieve the latter is to produce
supercritical fluids. Successful completion of the IDDP project is of considerable importance for
the geothermal industry at large. A successful outcome would be a major step forward for the
geothermal industry on a global scale, which in turn, could help counterbalance the threat of
global warming by increased use of sustainable, non-polluting energy resources.
5.10 Geothermal Power Plants in Iceland in the Hengill Area
Geothermal plants in Iceland are now discussed. The Hengill area in SW-Iceland is one of the
most extensive geothermal areas in Iceland. It is located 25 km east of Reykjavik. It has an area
of approximately 110 km² and is estimated to sustain 700 MW
el
power production in several
power plants [45]. Two power plants operate in the area. Environmental impact assessment for
two new power plants is being worked on. Power plants in the Hengill area will produce at
least 600 MW
el
and 433 MW
th
by end of 2011. Research projects connected with the power
plant project: (i) the Carb-Fix project, and (ii) the IDDP project, is being worked on.
Research drilling started at Nesjavellir in the north of the Hengill area in 1965. Hot water
production for district heating in Reykjavík started at the Nesajvellir plant in 1990. Power
production started there in 1998. Today, the Nesjavellir power plant produces 120 MW
el
and
300 MW
th
. The Nesjavelir plant was built in several stages.
To meet increasing demand for electricity and hot water for space heating in the industrial and
domestic sectors, Orkuveita Reykjavíkur (OR) is currently building a CHP geothermal power
plant at Hellisheiði. The approach for the Hellisheiði plant is the same as for Nesjavellir, i.e., it
will be built in several stages. The first stage, which came on line in 2006, consist of two 45
MW
el
units. The second stage of the Hellisheiði power plant, which consists of a 33 MW
el
Low
Pressure unit, started operating in November 2007. Construction of the third stage of the plant
is in progress, that is the erection of a two additional high-pressure units, 45 MW
el
each.
Erection of the thermal plant, the fourth stage, started at the beginning of 2008.
At least two new geothermal power plants are planned for the Hengill area, at Hverahlíð
and Bitra.
An environmental impact assessment (EIA) for the power plants at Hverahlíð and Bitra was
published towards end 2007.
The capacity of the Hellisheiði power plant will be 300 MW
el
electric and 400 MW
th
thermal.
Estimated capacity of the power plants in Hverahlíð and Bitra will be 90 MW
el
and 135
MW
el
, respectively.
With more knowledge of the Hengill geothermal area accumulated through running the
Nesjavellir and Hellisheiði power plants and research drilling, new opportunities arise
which can be utilized both in future power plants in the area and in other projects.
5.10.1 The Hengill Area
The Hengill area is a rural mountainous area in the middle of the western volcanic zone of
Iceland that runs from Reykjanes in a northerly direction to Langjökull (Figure. 5.14). The
Hengill region is one of the most extensive geothermal areas in Iceland. Surface
measurements and the heat distribution estimate that the region will sustain 690 MW
el
power production in several power plants [45]. The high temperature geothermal area at
Hengill covers three central volcanoes and their surroundings. The youngest one is the most
active, whereas the oldest one is eroded but still geothermal active.
5.10.2 Nesjavellir Power Plant
The first geothermal power plant in the Hengill area is the Nesjavellir power plant.
Construction of the power plant began in early 1987, with the first stage being completed in
May 1990. Four holes, generating about 100 MW
th
, were then connected to the processing
cycle, The next stage of power harnessing was brought online in 1995 when the fifth hole
was connected; heat exchangers and a deaerator were added; and the production capacity
was increased to 150 MW
th
of geothermal power [46].
In fall 1998, the first steam turbine was commissioned and the second at the end of the year,
producing total of 60 MW
el
. Five additional holes were put online, increasing the total
processing power of the power station to 200 MW
th
, In June 2001 the third turbine was put
into operation. The turbines are 30 MW
el
each, making the total production of electricity 90
MW
el
[19].
Geothermal Power Generation: Global Perspectives,
Technology, Direct Uses, Plants, Drilling and Sustainability Worldwide 227
The World Energy Council (WEC) has presented several scenarios for meeting future energy
requirements with varying emphasis on economic growth rates, technological progress,
environmental protection and international equity [44] (Nakicenovic et al., 1998). In all WEC´s
scenarios, the peak of the fossil fuel era has already passed (Nakicenovic et al., 1998). Oil and
gas are expected to continue to be important sources of energy in all cases, but the role of
renewable energy sources and nuclear energy vary highly in the scenarios and the level to
which these energy sources replace coal. In all the scenarios, the renewables are expected to
become very significant contributors to the world primary energy consumption, providing 20-
40% of the primary energy in 2050 (UK 80%) and 30-80% in 2100. They are expected to cover a
large part of the increase in energy consumption and to replace coal.
Evidently, a large opportunity to cut GHG emission exists with the geothermal energy
sector. However this estimate did not include innovations such as IDDP.
In summary, the long-term program to improve efficiency and economics of geothermal
energy by harnessing deep unconventional geothermal resources is an ambitious project to
produce electricity from natural supercritical hydrous fluids from drillable depths.
Producing higher-temperature fluids for generation of electric power offers two advantages
over using the fluids from conventional wells: (i) higher enthalpy, which promises high
power output and higher efficiency per unit mass, and (ii) higher pressure, which keeps the
fluid density high and thus contributes to higher mass-flow rates. The choice of technology
to be applied for power generation from these high-temperature fluids will be decided after
determining the physical and chemical properties of the fluids that are produced.
There are three approaches to improve the economics of the geothermal industry worldwide:
(i) cascading the usage of geothermal energy by using the effluent water from electricity
production for industrial processes and for domestic heating, (ii) reducing the cost of drilling
and completing geothermal production wells, and (iii) reducing the number of wells needed by
increasing the power output of each. The best way to achieve the latter is to produce
supercritical fluids. Successful completion of the IDDP project is of considerable importance for
the geothermal industry at large. A successful outcome would be a major step forward for the
geothermal industry on a global scale, which in turn, could help counterbalance the threat of
global warming by increased use of sustainable, non-polluting energy resources.
5.10 Geothermal Power Plants in Iceland in the Hengill Area
Geothermal plants in Iceland are now discussed. The Hengill area in SW-Iceland is one of the
most extensive geothermal areas in Iceland. It is located 25 km east of Reykjavik. It has an area
of approximately 110 km² and is estimated to sustain 700 MW
el
power production in several
power plants [45]. Two power plants operate in the area. Environmental impact assessment for
two new power plants is being worked on. Power plants in the Hengill area will produce at
least 600 MW
el
and 433 MW
th
by end of 2011. Research projects connected with the power
plant project: (i) the Carb-Fix project, and (ii) the IDDP project, is being worked on.
Research drilling started at Nesjavellir in the north of the Hengill area in 1965. Hot water
production for district heating in Reykjavík started at the Nesajvellir plant in 1990. Power
production started there in 1998. Today, the Nesjavellir power plant produces 120 MW
el
and
300 MW
th
. The Nesjavelir plant was built in several stages.
To meet increasing demand for electricity and hot water for space heating in the industrial and
domestic sectors, Orkuveita Reykjavíkur (OR) is currently building a CHP geothermal power
plant at Hellisheiði. The approach for the Hellisheiði plant is the same as for Nesjavellir, i.e., it
will be built in several stages. The first stage, which came on line in 2006, consist of two 45
MW
el
units. The second stage of the Hellisheiði power plant, which consists of a 33 MW
el
Low
Pressure unit, started operating in November 2007. Construction of the third stage of the plant
is in progress, that is the erection of a two additional high-pressure units, 45 MW
el
each.
Erection of the thermal plant, the fourth stage, started at the beginning of 2008.
At least two new geothermal power plants are planned for the Hengill area, at Hverahlíð
and Bitra.
An environmental impact assessment (EIA) for the power plants at Hverahlíð and Bitra was
published towards end 2007.
The capacity of the Hellisheiði power plant will be 300 MW
el
electric and 400 MW
th
thermal.
Estimated capacity of the power plants in Hverahlíð and Bitra will be 90 MW
el
and 135
MW
el
, respectively.
With more knowledge of the Hengill geothermal area accumulated through running the
Nesjavellir and Hellisheiði power plants and research drilling, new opportunities arise
which can be utilized both in future power plants in the area and in other projects.
5.10.1 The Hengill Area
The Hengill area is a rural mountainous area in the middle of the western volcanic zone of
Iceland that runs from Reykjanes in a northerly direction to Langjökull (Figure. 5.14). The
Hengill region is one of the most extensive geothermal areas in Iceland. Surface
measurements and the heat distribution estimate that the region will sustain 690 MW
el
power production in several power plants [45]. The high temperature geothermal area at
Hengill covers three central volcanoes and their surroundings. The youngest one is the most
active, whereas the oldest one is eroded but still geothermal active.
5.10.2 Nesjavellir Power Plant
The first geothermal power plant in the Hengill area is the Nesjavellir power plant.
Construction of the power plant began in early 1987, with the first stage being completed in
May 1990. Four holes, generating about 100 MW
th
, were then connected to the processing
cycle, The next stage of power harnessing was brought online in 1995 when the fifth hole
was connected; heat exchangers and a deaerator were added; and the production capacity
was increased to 150 MW
th
of geothermal power [46].
In fall 1998, the first steam turbine was commissioned and the second at the end of the year,
producing total of 60 MW
el
. Five additional holes were put online, increasing the total
processing power of the power station to 200 MW
th
, In June 2001 the third turbine was put
into operation. The turbines are 30 MW
el
each, making the total production of electricity 90
MW
el
[19].
Electricity Infrastructures in the Global Marketplace228
Early 2008, Nesjavellir power plant generates 300 MW
th
and 120 MW
el
. The Nesjavellir area
is being researched to see if it is possible to add one more turbine to the power plant.
5.10.3 Hellisheiði Power Plant
The first research drilling for the Hellisheiði power plant was in 1985 and then again in
1994. These boreholes indicated that the geothermal fields could sustain power production
but more drilling was needed before decisions could be made. In 2001 and 2002 five
boreholes were drilled. Based on the results from these boreholes it was decided to start
preparations for a power plant with total capacity of 120 MW
el
and 400 MW
th
with the
objective to meet increasing demand for electricity and hot water for space heating in the
industrial and the domestic sectors.
Fig. 5.14. Detailed map of the Hengill area.
Drilling continued and by end of 2005 18 new boreholes had been drilled. In light of the
results of these drillings it was decided to enlarge the development area further north
towards the main volcano. With this new area, estimated capacity of the geothermal area
was increased by 120 MW
el
. The first stage from this new area is 90MW
el
to be ready in 2008.
With this enlarged potential more geothermal water was available than initially estimated
and more than is needed for the thermal plant. It was decided to add one low-pressure unit
to increase utilization of the geothermal energy. Its size ended as 33 MW
el.
The first stage started operating in 2006 and comprises two 45 MW
el
units. The second stage,
a 33 MW
el
Low Pressure unit, started operating in November 2007. The construction of the
third stage, the erection of two additional high-pressure units rated at 45 MW
el
each, is in
progress. Erection of the thermal plant started at beginning 2008.
5.10.3.1 Construction Plan
The Hellisheiði power plant is being constructed similar to the Nesjavellir power plant. It is
a cogeneration plant and will be comprised of modular units. The power plant capacity can
expand as market demand increases, and can utilize greater knowledge of the geothermal
capacity of the area that is being provided by drilling.
Table 5.13. Main Construction Stages for Hellisheiði Power Plant
The power production capacity of each electric unit will be 45 MW
el
and 33 MW
el
for the
Low Pressure unit. For each thermal unit the capacity will be 133 MW
th
. Table 5.13 shows
the main construction stages for the Hellisheiði power plant and when each stage is
scheduled to start operating.
5.10.3.2 Technical Description
The total development area of the Hellisheiði power plant is 820 ha. The development consists
of geothermal utilization, access roads, service roads, production wells, the water supply
system, steam transmission pipes, steam separator stations, power house, cooling towers,
steam exhaust stacks, a fresh groundwater supply system, water tanks, hot-water transmission
pipes, quarrying, discharge system, injection areas, and connection to the power grid.
Commis-
sioning
2006
MW
el
2007
MW
el
2008
MW
el
2009
MW
th
2910
MW
el
>2011
MW
el
Electricity
High
Pressure
1
st.
90
3
rd.
90
5
th
90
.
Low
Pressure
2
nd.
33
Thermal
unit
4
th
133
267
Geothermal Power Generation: Global Perspectives,
Technology, Direct Uses, Plants, Drilling and Sustainability Worldwide 229
Early 2008, Nesjavellir power plant generates 300 MW
th
and 120 MW
el
. The Nesjavellir area
is being researched to see if it is possible to add one more turbine to the power plant.
5.10.3 Hellisheiði Power Plant
The first research drilling for the Hellisheiði power plant was in 1985 and then again in
1994. These boreholes indicated that the geothermal fields could sustain power production
but more drilling was needed before decisions could be made. In 2001 and 2002 five
boreholes were drilled. Based on the results from these boreholes it was decided to start
preparations for a power plant with total capacity of 120 MW
el
and 400 MW
th
with the
objective to meet increasing demand for electricity and hot water for space heating in the
industrial and the domestic sectors.
Fig. 5.14. Detailed map of the Hengill area.
Drilling continued and by end of 2005 18 new boreholes had been drilled. In light of the
results of these drillings it was decided to enlarge the development area further north
towards the main volcano. With this new area, estimated capacity of the geothermal area
was increased by 120 MW
el
. The first stage from this new area is 90MW
el
to be ready in 2008.
With this enlarged potential more geothermal water was available than initially estimated
and more than is needed for the thermal plant. It was decided to add one low-pressure unit
to increase utilization of the geothermal energy. Its size ended as 33 MW
el.
The first stage started operating in 2006 and comprises two 45 MW
el
units. The second stage,
a 33 MW
el
Low Pressure unit, started operating in November 2007. The construction of the
third stage, the erection of two additional high-pressure units rated at 45 MW
el
each, is in
progress. Erection of the thermal plant started at beginning 2008.
5.10.3.1 Construction Plan
The Hellisheiði power plant is being constructed similar to the Nesjavellir power plant. It is
a cogeneration plant and will be comprised of modular units. The power plant capacity can
expand as market demand increases, and can utilize greater knowledge of the geothermal
capacity of the area that is being provided by drilling.
Table 5.13. Main Construction Stages for Hellisheiði Power Plant
The power production capacity of each electric unit will be 45 MW
el
and 33 MW
el
for the
Low Pressure unit. For each thermal unit the capacity will be 133 MW
th
. Table 5.13 shows
the main construction stages for the Hellisheiði power plant and when each stage is
scheduled to start operating.
5.10.3.2 Technical Description
The total development area of the Hellisheiði power plant is 820 ha. The development consists
of geothermal utilization, access roads, service roads, production wells, the water supply
system, steam transmission pipes, steam separator stations, power house, cooling towers,
steam exhaust stacks, a fresh groundwater supply system, water tanks, hot-water transmission
pipes, quarrying, discharge system, injection areas, and connection to the power grid.
Commis-
sioning
2006
MW
el
2007
MW
el
2008
MW
el
2009
MW
th
2910
MW
el
>2011
MW
el
Electricity
High
Pressure
1
st.
90
3
rd.
90
5
th
90
.
Low
Pressure
2
nd.
33
Thermal
unit
4
th
133
267
Electricity Infrastructures in the Global Marketplace230
5.10.3.3 Production Wells and Directional Drilling
Production wells are drilled both vertically and directionally, up to five wells per drilling
site. With directional drilling it is possible to reach under valleys and in the direction of the
mountain Hengill, without disrupting the valleys. Production wells can be up to 3.000 m
and with directional drilling it is possible to drill 1,200 m from the center.
Production wells are grouped on drilling sites, up to five wells on predefined areas. The
mean number of production wells per drill site is four with an area of about 12,000 m
2
. The
location of drill sites depends on geothermal and geophysics researches. Visual appearance
of drill sites on the landscape has impact on where the drill sites are positioned. Minimum
distance between production wells on a drill site is around 10m.
5.10.4 Hverahlíð and Bitra
Because of a growing demand for electricity in the industrial sectors, for example aluminum
smelters, planning for two new power plants at the Hengill area has started, the Bitra power
plant and the Hverahlíð power plant.
5.10.4.1 Environmental Policy
Construction of new geothermal power plants are subject to Environmental Impact
Assessment (EIA) according to Article 5 and item 2 of Annex 1 of the Icelandic EIA Act No.
106/2000. Preliminary EIA proposals for the project at Bitra and Hverahlíð were presented
in August 2006, and work on the EIA has been in progress since then. It was expected that
the Planning Agency would issue their conclusion regarding the EIA early 2008.
5.10.4.2 Power Plant at Bitra
The development area is located about 8 km northeast of the Hellisheiði power plant. The
development area of the plant was reduced from its original size on account of
environmental reasons. Because of reduction of the development area and environmental
policy, the effect of the Bitra power plant on its surroundings has been minimized [47].
Three research boreholes have been drilled in the area. The size of the power plant was
estimated from information gathered from those boreholes and from results from a model of
the geothermal area [48]. Estimated capacity of power plant at Bitra is 135 MW
el
.
5.10.4.3 Power Plant at Hverahlíð
The development is located about 3 km southeast of the Hellisheiði power plant. The
development area of the power plant was also reduced from its original size because of
environmental reason. Like at Bitra, reduction of the development area and environmental
policy will result in a minimal effect of the Hverahlíð plant on its surroundings [49].
Three research boreholes have been drilled in the area. The size of the power plant was
estimated from information gathered from those boreholes and the results from a model of
the geothermal area [48]. Estimated capacity of the power plant in that area is 90 MW
el
.
5.10.5 Research Projects in the Hengill Area
5.10.5.1 New research Areas in the Hengill Area
Research boreholes have been drilled south of the Hellisheiði power plant. It was thought
that these should be on the edge of the defined geothermal area. Results from the research
drilling showed that the geothermal area extends further south. Because of this, it was
decided to research the areas that are called Gráuhnúkar and Meitill. If research drilling
gives positive results, it will be possible to extend the operation area of the Hellisheiði
power plant to those sites or construct new smaller power plants in those areas. Ether way
an EIA will be necessary.
5.10.5.2 Carb-Fix Nature Imitated in Permanent CO
2
Storage Project
In fall 2007 a project was launched with the aim at storing CO
2
in Iceland’s lavas by injecting
greenhouse gases into basaltic bedrock where it literally turns to stone. CO
2
turning into
calcite is a well-known natural process in volcanic areas. Now scientists of the University of
Iceland, Columbia University N.Y. and the CNRS in Toulouse, France are developing
methods to imitate and speed up this transformation of CO
2 into
calcite that is a prevalent
contributor to global warming.
Injecting CO
2
at carefully selected geological sites with large potential storage capacity can
be a long lasting and environmentally benign storage solution. To date, CO
2
is stored as gas
in association with major gas production facilities. The uniqueness of the Icelandic project is
that whereas other projects store CO
2
mainly in gas form, where it could potentially leak
back into the atmosphere, the current project seeks to store CO
2
by creating calcite in the
subsurface. Calcite, a major component of limestone, is a common and stable mineral in the
Earth that is known to persist for tens of millions of years.
In the project at the Hengill area, a mixture of water and steam is harnessed from 2000 m
deep wells at the Hellisheidi power plant. The steam contains geothermal gases, i.e. CO
2
. It
is planned to dissolve the CO
2
from the plant in water at elevated pressure and then inject it
through wells down to 400-800 m just outside the boundary of the geothermal system
It is estimated that the project will take three to five years. It was scheduled to start a full-
scale CO
2
injecting end 2008 or beginning 2009.
At least 600 MW
el
and 433 MW
th
are planned at power plants in the Hengill area by end of 2011.
5.11 A Perspective on the Future of Geothermal Energy in USA
Geothermal production began in USA at The Geysers field about 140 km north of San
Francisco, California at what is now the world’s largest geothermal field. USA continues to
be the world leader in online capacity of geothermal energy and generation of electric
power from geothermal energy. According to US Energy Information Agency, geothermal
energy in 2005 generated approximately 16,010 GWh of electricity or about 0.36% of US
annual electricity generation. Generation capacity is about 2850 MW.
Geothermal Power Generation: Global Perspectives,
Technology, Direct Uses, Plants, Drilling and Sustainability Worldwide 231
5.10.3.3 Production Wells and Directional Drilling
Production wells are drilled both vertically and directionally, up to five wells per drilling
site. With directional drilling it is possible to reach under valleys and in the direction of the
mountain Hengill, without disrupting the valleys. Production wells can be up to 3.000 m
and with directional drilling it is possible to drill 1,200 m from the center.
Production wells are grouped on drilling sites, up to five wells on predefined areas. The
mean number of production wells per drill site is four with an area of about 12,000 m
2
. The
location of drill sites depends on geothermal and geophysics researches. Visual appearance
of drill sites on the landscape has impact on where the drill sites are positioned. Minimum
distance between production wells on a drill site is around 10m.
5.10.4 Hverahlíð and Bitra
Because of a growing demand for electricity in the industrial sectors, for example aluminum
smelters, planning for two new power plants at the Hengill area has started, the Bitra power
plant and the Hverahlíð power plant.
5.10.4.1 Environmental Policy
Construction of new geothermal power plants are subject to Environmental Impact
Assessment (EIA) according to Article 5 and item 2 of Annex 1 of the Icelandic EIA Act No.
106/2000. Preliminary EIA proposals for the project at Bitra and Hverahlíð were presented
in August 2006, and work on the EIA has been in progress since then. It was expected that
the Planning Agency would issue their conclusion regarding the EIA early 2008.
5.10.4.2 Power Plant at Bitra
The development area is located about 8 km northeast of the Hellisheiði power plant. The
development area of the plant was reduced from its original size on account of
environmental reasons. Because of reduction of the development area and environmental
policy, the effect of the Bitra power plant on its surroundings has been minimized [47].
Three research boreholes have been drilled in the area. The size of the power plant was
estimated from information gathered from those boreholes and from results from a model of
the geothermal area [48]. Estimated capacity of power plant at Bitra is 135 MW
el
.
5.10.4.3 Power Plant at Hverahlíð
The development is located about 3 km southeast of the Hellisheiði power plant. The
development area of the power plant was also reduced from its original size because of
environmental reason. Like at Bitra, reduction of the development area and environmental
policy will result in a minimal effect of the Hverahlíð plant on its surroundings [49].
Three research boreholes have been drilled in the area. The size of the power plant was
estimated from information gathered from those boreholes and the results from a model of
the geothermal area [48]. Estimated capacity of the power plant in that area is 90 MW
el
.
5.10.5 Research Projects in the Hengill Area
5.10.5.1 New research Areas in the Hengill Area
Research boreholes have been drilled south of the Hellisheiði power plant. It was thought
that these should be on the edge of the defined geothermal area. Results from the research
drilling showed that the geothermal area extends further south. Because of this, it was
decided to research the areas that are called Gráuhnúkar and Meitill. If research drilling
gives positive results, it will be possible to extend the operation area of the Hellisheiði
power plant to those sites or construct new smaller power plants in those areas. Ether way
an EIA will be necessary.
5.10.5.2 Carb-Fix Nature Imitated in Permanent CO
2
Storage Project
In fall 2007 a project was launched with the aim at storing CO
2
in Iceland’s lavas by injecting
greenhouse gases into basaltic bedrock where it literally turns to stone. CO
2
turning into
calcite is a well-known natural process in volcanic areas. Now scientists of the University of
Iceland, Columbia University N.Y. and the CNRS in Toulouse, France are developing
methods to imitate and speed up this transformation of CO
2 into
calcite that is a prevalent
contributor to global warming.
Injecting CO
2
at carefully selected geological sites with large potential storage capacity can
be a long lasting and environmentally benign storage solution. To date, CO
2
is stored as gas
in association with major gas production facilities. The uniqueness of the Icelandic project is
that whereas other projects store CO
2
mainly in gas form, where it could potentially leak
back into the atmosphere, the current project seeks to store CO
2
by creating calcite in the
subsurface. Calcite, a major component of limestone, is a common and stable mineral in the
Earth that is known to persist for tens of millions of years.
In the project at the Hengill area, a mixture of water and steam is harnessed from 2000 m
deep wells at the Hellisheidi power plant. The steam contains geothermal gases, i.e. CO
2
. It
is planned to dissolve the CO
2
from the plant in water at elevated pressure and then inject it
through wells down to 400-800 m just outside the boundary of the geothermal system
It is estimated that the project will take three to five years. It was scheduled to start a full-
scale CO
2
injecting end 2008 or beginning 2009.
At least 600 MW
el
and 433 MW
th
are planned at power plants in the Hengill area by end of 2011.
5.11 A Perspective on the Future of Geothermal Energy in USA
Geothermal production began in USA at The Geysers field about 140 km north of San
Francisco, California at what is now the world’s largest geothermal field. USA continues to
be the world leader in online capacity of geothermal energy and generation of electric
power from geothermal energy. According to US Energy Information Agency, geothermal
energy in 2005 generated approximately 16,010 GWh of electricity or about 0.36% of US
annual electricity generation. Generation capacity is about 2850 MW.
Electricity Infrastructures in the Global Marketplace232
Numerous exploration and development projects are underway which, if successful, would
double this capacity. Beyond this growth there is still untapped potential for development
of additional hydrothermal resources. The US Geological Survey (USGS) [50] estimated
about 23,000 MWe capacity for 30 years of identified hydrothermal resources suitable for
generation of electricity in USA and suggested that another 100,000 MWe of resources may
be present but not yet identified. A more recent estimate prepared by a panel of experts
hosted by the US. Department of Energy National Renewable Energy Laboratory [51]
estimated that the identified accessible hydrothermal resource suitable for electrical
generation is 30,000 MWe for 30 years with an additional 120,000 MWe unidentified. In
addition, the US coastal region of Texas and Louisiana contains a significant amount of hot
water nearly saturated with methane and with high wellhead pressures. A recent study by
the Massachusetts Institute of Technology [52] reported that the thermal energy and energy
in the methane may represent as much as 1,000 MWe capacity for 100 years.
5.11.1 Future Resources
Although these numbers are significant, they represent only a small fraction of the thermal
energy underlying the USA. Current geothermal development is limited to geothermal
systems driven by the convective flow of hot water associated with active volcanoes or with
deep circulation of fluids. However, the majority of the earth’s thermal energy is contained
in areas where heat is transferred by conduction. It is this energy that is truly the future of
geothermal energy in USA.
Researchers throughout the world have looked since the 1970s for ways to tap the
conductive heat in the earth. The conceptual model, termed enhanced geothermal systems
(EGS), is to drill wells and create or enhance subsurface fractures by use of reservoir
stimulation practices pioneered by the petroleum industry. Such technology offers the
promise of tapping the enormous amount of heat contained within the earth.
The US Department of Energy (USDOE) is working with private developers to investigate
stimulation technology in poorly productive areas of commercial geothermal fields. They
commissioned a study of the potential for enhanced geothermal systems in USA. The
Massachusetts Institute of Technology lead team published their findings in December 2006
[52]. Report is available at or
.The study found that
EGS represents a large, indigenous resource that could provide 100 GWe of electrical
generation in the next 50 years with a reasonable investment in R&D. The report estimates
that the EGS resource base is more than 13 million exajoules of which about 200,000
exajoules may be extractable. That represents 2,000 times the annual consumption of
primary energy in the United States.
The USDOE is evaluating the findings of the report and comments from the geothermal and
petroleum industries.
5.12 Acknowledgements
This Chapter has been prepared and coordinated by T. J. Hammons, Chair of International
Practices for Energy Development and Power Generation IEEE; University of Glasgow, UK.
Contributors included Valgardur Stefansson (Orkustofnun, National Energy Authority of
Iceland, Iceland); Arni Gunnarsson (Landsvirkjun, National Power Company, Iceland); Jay
Nathwani (Department of Energy, Idaho Operations Office, USA); R. Gordon Bloomquist
(Washington State University Cooperative Extension Energy Program, Washington, USA);
Luciem Y. Bronicki and Daniel N. Schochet (ORMAT Technologies, Inc., USA); R. Gerald
Nix (National Renewable Energy Laboratory, USA); Ed Hoover (Sandia National
Laboratory, USA); Karl Urbank (Calpine Corporation, USA); Kenneth H. Williamson
(UNOCAL Corporation, CA, USA); William E. Lewis (Power Engineers, USA), Björn
Stefánsson and Bjarni Pálsson (Landsvirkjun, Iceland), Guðmundur Ómar Friðleifsson
(Hitaveita Suournesja, Iceland); Ingólfur Hrólfsson and Sigurgeir Bjorn Geirsson (Orkuveita
Reykjavikur, Iceland); and Allan Jelacic and Joel L. Renner (Idaho National Laboratory, US
Department of Energy, USA). The Chapter is primarily based on an up-date of the invited
panel session summary papers presented at the Panel Session on Harnessing Untapped
Geothermal Power; and on Developments in Geothermal and Hydro Power in Iceland,
Europe and Worldwide at the IEEE-PES 2008 General Meeting (GM2008) organized and
chaired by T. J. Hammons and A. Gunnarsson [53].
5.13 References
[1] IEA 2001: Key World Energy Statistics from the IEA. 2001 Edition.
[2] Bruntland, Gro Harlem, Chairman of the World Commission on Environment and
Development, 1987: Our Common Future, Oxford University Press, Oxford, 400 p.
[3] WEA 2000: World energy assessment: energy and the challenge of sustainability. Ed. by
J. Goldemberg. United Nation Development Programme, United Nations
Department of Economic and Social Affairs, World Energy Council, 2000, 508
pages.
[4] Huttrer, G.W., 2001: The status of world geothermal power generation 1995-2000.
Geothermics, Vol. 30, no.1, pp. 1-27.
[5] Lund, J.W. and Freeston, D.H., 2001: Worldwide direct uses of geothermal energy 2000.
Geothermics, Vol. 30, no.1, pp. 29-68.
[6] WEC 1998: Survey of Energy Resources 1998. 18
th
Edition, World Energy Council.
[7] P. Keary and F. J. Vine, Global Tectonics, 2
nd
Edition, Blackwell Science Ltd., London,
1996.
[8] L. J. P. Muffler, ed., “Assessment of Geothermal Resources of the United States—1978,”
U.S. Geological Survey Circular 790, 1979.
[9] D. E. White and D. L. Williams, “Assessment of Geothermal Resources of the United
States—1975,” U.S. Geological Survey Circular 726, 1975.
[10] M. J. Reed, “Assessment of Low-Temperature Geothermal Resources of the United
Sates—1982,” U.S. Geological Survey Circular 892, 1983.
[11] G. W. Huttrer, “The Status of World Geothermal Power Generation 1995–2000,”
Proceedings of the World Geothermal Congress 2000, Kyushu-Tohoku, Japan,
International Geothermal Association, Auckland, N.Z., pp. 23–38, May 28–June 10,
2000.
[12] J. W. Lund and D. H. Freeston, “Worldwide Direct Uses of Geothermal Energy 2000,”
Proceedings of the World Geothermal Congress 2000, Kyushu-Tohoku, Japan,
International Geothermal Association, Auckland, N.Z., pp. 1–22, May 28–June 10,
2000.
Geothermal Power Generation: Global Perspectives,
Technology, Direct Uses, Plants, Drilling and Sustainability Worldwide 233
Numerous exploration and development projects are underway which, if successful, would
double this capacity. Beyond this growth there is still untapped potential for development
of additional hydrothermal resources. The US Geological Survey (USGS) [50] estimated
about 23,000 MWe capacity for 30 years of identified hydrothermal resources suitable for
generation of electricity in USA and suggested that another 100,000 MWe of resources may
be present but not yet identified. A more recent estimate prepared by a panel of experts
hosted by the US. Department of Energy National Renewable Energy Laboratory [51]
estimated that the identified accessible hydrothermal resource suitable for electrical
generation is 30,000 MWe for 30 years with an additional 120,000 MWe unidentified. In
addition, the US coastal region of Texas and Louisiana contains a significant amount of hot
water nearly saturated with methane and with high wellhead pressures. A recent study by
the Massachusetts Institute of Technology [52] reported that the thermal energy and energy
in the methane may represent as much as 1,000 MWe capacity for 100 years.
5.11.1 Future Resources
Although these numbers are significant, they represent only a small fraction of the thermal
energy underlying the USA. Current geothermal development is limited to geothermal
systems driven by the convective flow of hot water associated with active volcanoes or with
deep circulation of fluids. However, the majority of the earth’s thermal energy is contained
in areas where heat is transferred by conduction. It is this energy that is truly the future of
geothermal energy in USA.
Researchers throughout the world have looked since the 1970s for ways to tap the
conductive heat in the earth. The conceptual model, termed enhanced geothermal systems
(EGS), is to drill wells and create or enhance subsurface fractures by use of reservoir
stimulation practices pioneered by the petroleum industry. Such technology offers the
promise of tapping the enormous amount of heat contained within the earth.
The US Department of Energy (USDOE) is working with private developers to investigate
stimulation technology in poorly productive areas of commercial geothermal fields. They
commissioned a study of the potential for enhanced geothermal systems in USA. The
Massachusetts Institute of Technology lead team published their findings in December 2006
[52]. Report is available at or
.The study found that
EGS represents a large, indigenous resource that could provide 100 GWe of electrical
generation in the next 50 years with a reasonable investment in R&D. The report estimates
that the EGS resource base is more than 13 million exajoules of which about 200,000
exajoules may be extractable. That represents 2,000 times the annual consumption of
primary energy in the United States.
The USDOE is evaluating the findings of the report and comments from the geothermal and
petroleum industries.
5.12 Acknowledgements
This Chapter has been prepared and coordinated by T. J. Hammons, Chair of International
Practices for Energy Development and Power Generation IEEE; University of Glasgow, UK.
Contributors included Valgardur Stefansson (Orkustofnun, National Energy Authority of
Iceland, Iceland); Arni Gunnarsson (Landsvirkjun, National Power Company, Iceland); Jay
Nathwani (Department of Energy, Idaho Operations Office, USA); R. Gordon Bloomquist
(Washington State University Cooperative Extension Energy Program, Washington, USA);
Luciem Y. Bronicki and Daniel N. Schochet (ORMAT Technologies, Inc., USA); R. Gerald
Nix (National Renewable Energy Laboratory, USA); Ed Hoover (Sandia National
Laboratory, USA); Karl Urbank (Calpine Corporation, USA); Kenneth H. Williamson
(UNOCAL Corporation, CA, USA); William E. Lewis (Power Engineers, USA), Björn
Stefánsson and Bjarni Pálsson (Landsvirkjun, Iceland), Guðmundur Ómar Friðleifsson
(Hitaveita Suournesja, Iceland); Ingólfur Hrólfsson and Sigurgeir Bjorn Geirsson (Orkuveita
Reykjavikur, Iceland); and Allan Jelacic and Joel L. Renner (Idaho National Laboratory, US
Department of Energy, USA). The Chapter is primarily based on an up-date of the invited
panel session summary papers presented at the Panel Session on Harnessing Untapped
Geothermal Power; and on Developments in Geothermal and Hydro Power in Iceland,
Europe and Worldwide at the IEEE-PES 2008 General Meeting (GM2008) organized and
chaired by T. J. Hammons and A. Gunnarsson [53].
5.13 References
[1] IEA 2001: Key World Energy Statistics from the IEA. 2001 Edition.
[2] Bruntland, Gro Harlem, Chairman of the World Commission on Environment and
Development, 1987: Our Common Future, Oxford University Press, Oxford, 400 p.
[3] WEA 2000: World energy assessment: energy and the challenge of sustainability. Ed. by
J. Goldemberg. United Nation Development Programme, United Nations
Department of Economic and Social Affairs, World Energy Council, 2000, 508
pages.
[4] Huttrer, G.W., 2001: The status of world geothermal power generation 1995-2000.
Geothermics, Vol. 30, no.1, pp. 1-27.
[5] Lund, J.W. and Freeston, D.H., 2001: Worldwide direct uses of geothermal energy 2000.
Geothermics, Vol. 30, no.1, pp. 29-68.
[6] WEC 1998: Survey of Energy Resources 1998. 18
th
Edition, World Energy Council.
[7] P. Keary and F. J. Vine, Global Tectonics, 2
nd
Edition, Blackwell Science Ltd., London,
1996.
[8] L. J. P. Muffler, ed., “Assessment of Geothermal Resources of the United States—1978,”
U.S. Geological Survey Circular 790, 1979.
[9] D. E. White and D. L. Williams, “Assessment of Geothermal Resources of the United
States—1975,” U.S. Geological Survey Circular 726, 1975.
[10] M. J. Reed, “Assessment of Low-Temperature Geothermal Resources of the United
Sates—1982,” U.S. Geological Survey Circular 892, 1983.
[11] G. W. Huttrer, “The Status of World Geothermal Power Generation 1995–2000,”
Proceedings of the World Geothermal Congress 2000, Kyushu-Tohoku, Japan,
International Geothermal Association, Auckland, N.Z., pp. 23–38, May 28–June 10,
2000.
[12] J. W. Lund and D. H. Freeston, “Worldwide Direct Uses of Geothermal Energy 2000,”
Proceedings of the World Geothermal Congress 2000, Kyushu-Tohoku, Japan,
International Geothermal Association, Auckland, N.Z., pp. 1–22, May 28–June 10,
2000.
Electricity Infrastructures in the Global Marketplace234
[13] K. Rafferty, K., “A Century of Service: The Boise Warm Springs Water District System,”
Geothermal Resources Council Bulletin, v. 21, no.10, pp.339–344, 1992.
[14] J. W. Lund and T. L. Boyd, “Geothermal Direct Use in the United States Update,”
Proceedings of the World Geothermal Congress 2000, Kyushu-Tohoku, Japan,
International Geothermal Association, Auckland, N.Z., pp. 297–305, May 28–June
10, 2000.
[15] M. L’Ecuyer, C. Zoi, and J. S. Hoffman, “Space Conditioning: The Next Frontier,” U.S.
Environmental Protection Agency, EPA430-R-93-004, Washington, D.C., 1993.
[16] K. K. Bloomfield and J. N. Moore, “Production of Greenhouse Gases from Geothermal
Power Plants,” Geothermal Resource Council Transactions, V. 23, pp. 221–223, 1999.
[17] S. A. Bedell and C. A. Hammond, “Chelation Chemistry in Geothermal H
2
S
Abatement,” Geothermal Resources Council Bulletin, v. 16, no. 8, pp. 3–6, 1987.
[18] J. G. Colligan, “U.S. Electric Utility Environmental Statistics, Electric Power Annual
1991,” U.S. Department of Energy, Energy Information Administration,
DOE/EIA-0348 (91), Washington, D.C., 1993.
[19]
[20]
[21]
[22]
[23]
[26] Mariusson, J.M. 2001, Iceland’s Power Potential, Landsvirkjun.
[24] Lund, J.W., 2002. Direct Heat Utilization of Geothermal Resources. Geothermal Energy
Resources for Developing Countries. D. Chandrasekharam & J. Bundschuh, 2002.
[25] Chandrasekharam and Bundschuh (eds), 2002. Direct Heat Utilization of Geothermal
Resources, Geothermal Energy Resources for Developing Countries, Swets and
Zeitlinger, Lisse, Netherlands, pp 129-147.
[26] Mariusson, J.M. 2001, Iceland’s Power Potential, Landsvirkjun.
[27] Bloomquist, R. Gordon, 1988. District Heating Development Guide. Washington State
Energy Office.
[28] Ragnarsson, A., 2000. Iceland Country Update. Proc. World Geothermal Congress, 2000,
Japan.
[29] Glowka, D., The Role of R&D in Geothermal Drilling Cost Reduction, Geothermal
Resources Council Transactions, Vol. 21, 1997, pp. 405-410.
[30] Bronicki, L.Y. Geothermal Power Stations, Encyclopedia of Physical Science and
Technology, third edition, vol. 6, 2002.
[31] Bronicki, L. Innovative Geothermal Power Plants, Fifteen Years of Experience, World
Geothermal Conf., Florence, 1995.
[32] Blaydes, Paula E. Environmental Advantages of Binary Power Plants can Enhance
Development Opportunities, Trans. Geothermal Resources Council, vol. 18, October
1994.
[33] Flynn, Tom. Geothermal Sustainability, Heat Utilization and Advanced Organic Rankine
Cycle, Trans.Geothermal Resources Council, vol. 26, Number 9, September/October
1997.
[34] Wilson, S.S. and Radwan, M.S. Appropriate Thermodynamics for Heat Engine Analysis and
Design, Int. J. Mech. Eng. Educ., vol.5, 1977.
[35] Sanyal, Subir K. Sustainability and Renewability of Geothermal Power Capacity, Proc. World
Geothermal Congress 2005, Antalya, Turkey, 24-29 April 2005.
[36] Krieger, Z and Moritz, A. Cascaded Power Plant using Low and Medium Temperature Source
Fluid, U.S. Patent. 4 578 953, April 1, 1986.
[37] Tabor, H and Bronicki, L. Y. Vapor Turbines, U.S. Patent. 3 040 528, June 26, 1962.
[38] Krieger, Z and Kaplan, U. Apparatus and Method for Producing Power using Geothermal
Fluid, U.S. Patent. 6 009 711, January 4, 2000.
[39] Steingrímsson, B., Guðmundsson, Á., Franzson, H. and Gunnlaugsson, E. Evidence of a
Supercritical Fluid at Depth in the Nesjavellir Field. Proc. Fifteenth Workshop on
Geothermal Reservoir Engineering, Stanford University, Stanford California,
January 23-25 1990, SGP-TR-130, pp. 81-88.
[40] Einarsson, P. and Brandsdottor, B., The Krafla Magma tic and Tectonic Episode of 1974-1989
at the Divergent Plate Boundary in North Iceland. . Eos Trans.AGU 87 (52) Fall Meet.
Suppl., 2006, Abstract T33E-07.
[41] Albertsson, A., Bjarnason, J.Ö., Gunnarsson, T., Ballzus C. and Ingason, K., Fluid
Handling and Evaluation, Part III, 33 p. In: Iceland Deep Drilling Project, Feasibility
Report, ed. G.O.Fridleifsson. Orkustofnun Report OS-2003-007.
[42] Albertson, A., Bjarnason, J.Ö, Gunnarsson, T., Ballzus, C. and Ingason, K., The Iceland
Deep Drilling Project: Fluid Handling, Evaluation, and Utilization. Proceedings of the
International Geothermal Conference IGC-2003 Reykjavik, September 2003, Session
6, pp. 23-30.
[43] Stern Review, Stern Review on the Economics of Climate Change, Cambridge University Press,
October 2006. www.cambridge.org/9780521700801.
[44] Nakicenovic, N., Grübler, A., and McDonald, A. (editors), Global Energy Perspectives.
Cambridge Univ. Press, 1998, 299 pp.
[45] Iðnaðarráðuneytið, Innlendar Orkulindir til Vinnslu Raforku. Iðnaðarráðuneytið,1994
[46] Orkuveita Reykjavíkur, Nesjavellir Power Plant. Orkuveita Reykjavíkur, 2003
[47] VSÓ, Bitruvirkjun, allt að 135 MW
e
jarðvarmavirkjun. Frummatsskýrsla. VSÓ for Orkuveita
Reykjavíkur, 2007.
[48] Grímur Björnsson, Endurskoðað hugmyndalíkan af jarðhiakerfum í Hengli og einfalt mat á
vinnslugetu nýrra borsvæða. Orkuveita Reykjavíkur, 2007
[49] VSÓ, Hverahlíðarvirkjun, allt að 90 MW
e
jarðvarmavirkjun. Frummatsskýrsla. VSÓ for
Orkuveita Reykjavíkur, 2007.
[50] Muffler, L. J. P. ed., Assessment of Geothermal Resources of the United States – 1978, U. S.
Geological Survey Circular 790, 163 p., 1979. Available:
[51] Green, B. D. and Nix, R. G., Geothermal – The Energy under our Feet, National Renewable
Energy Laboratory Technical Report NREL/TP-840-40665, Golden, Colorado, 16 p.,
2006. Available: .
[52] Tester, J. W., Anderson, B. J., Batchelor, A. S., Blackwell, D. B., Di Pippo, Ronald, Drake,
E.L., Garnish, J., Livesay, B., Moore, M. C., Nichols, K., Petty, S., Toksöz, M. N.,
and. Veatch, R. W. Jr., The Future of Geothermal Energy, Idaho National Laboratory
External Report INL/EXT-06-11746, Idaho Falls, ID, 396p., 2006.
Available: or
[53] T. J. Hammons and A. Gunnarsson. Geothermal Power Developments and Sustainability in
Iceland and Worldwide, International Journal of Power and Energy Systems, ACTA
Press, Vol. 30, (2), 2010, pp. 94-107.
Geothermal Power Generation: Global Perspectives,
Technology, Direct Uses, Plants, Drilling and Sustainability Worldwide 235
[13] K. Rafferty, K., “A Century of Service: The Boise Warm Springs Water District System,”
Geothermal Resources Council Bulletin, v. 21, no.10, pp.339–344, 1992.
[14] J. W. Lund and T. L. Boyd, “Geothermal Direct Use in the United States Update,”
Proceedings of the World Geothermal Congress 2000, Kyushu-Tohoku, Japan,
International Geothermal Association, Auckland, N.Z., pp. 297–305, May 28–June
10, 2000.
[15] M. L’Ecuyer, C. Zoi, and J. S. Hoffman, “Space Conditioning: The Next Frontier,” U.S.
Environmental Protection Agency, EPA430-R-93-004, Washington, D.C., 1993.
[16] K. K. Bloomfield and J. N. Moore, “Production of Greenhouse Gases from Geothermal
Power Plants,” Geothermal Resource Council Transactions, V. 23, pp. 221–223, 1999.
[17] S. A. Bedell and C. A. Hammond, “Chelation Chemistry in Geothermal H
2
S
Abatement,” Geothermal Resources Council Bulletin, v. 16, no. 8, pp. 3–6, 1987.
[18] J. G. Colligan, “U.S. Electric Utility Environmental Statistics, Electric Power Annual
1991,” U.S. Department of Energy, Energy Information Administration,
DOE/EIA-0348 (91), Washington, D.C., 1993.
[19]
[20]
[21]
[22]
[23]
[26] Mariusson, J.M. 2001, Iceland’s Power Potential, Landsvirkjun.
[24] Lund, J.W., 2002. Direct Heat Utilization of Geothermal Resources. Geothermal Energy
Resources for Developing Countries. D. Chandrasekharam & J. Bundschuh, 2002.
[25] Chandrasekharam and Bundschuh (eds), 2002. Direct Heat Utilization of Geothermal
Resources, Geothermal Energy Resources for Developing Countries, Swets and
Zeitlinger, Lisse, Netherlands, pp 129-147.
[26] Mariusson, J.M. 2001, Iceland’s Power Potential, Landsvirkjun.
[27] Bloomquist, R. Gordon, 1988. District Heating Development Guide. Washington State
Energy Office.
[28] Ragnarsson, A., 2000. Iceland Country Update. Proc. World Geothermal Congress, 2000,
Japan.
[29] Glowka, D., The Role of R&D in Geothermal Drilling Cost Reduction, Geothermal
Resources Council Transactions, Vol. 21, 1997, pp. 405-410.
[30] Bronicki, L.Y. Geothermal Power Stations, Encyclopedia of Physical Science and
Technology, third edition, vol. 6, 2002.
[31] Bronicki, L. Innovative Geothermal Power Plants, Fifteen Years of Experience, World
Geothermal Conf., Florence, 1995.
[32] Blaydes, Paula E. Environmental Advantages of Binary Power Plants can Enhance
Development Opportunities, Trans. Geothermal Resources Council, vol. 18, October
1994.
[33] Flynn, Tom. Geothermal Sustainability, Heat Utilization and Advanced Organic Rankine
Cycle, Trans.Geothermal Resources Council, vol. 26, Number 9, September/October
1997.
[34] Wilson, S.S. and Radwan, M.S. Appropriate Thermodynamics for Heat Engine Analysis and
Design, Int. J. Mech. Eng. Educ., vol.5, 1977.
[35] Sanyal, Subir K. Sustainability and Renewability of Geothermal Power Capacity, Proc. World
Geothermal Congress 2005, Antalya, Turkey, 24-29 April 2005.
[36] Krieger, Z and Moritz, A. Cascaded Power Plant using Low and Medium Temperature Source
Fluid, U.S. Patent. 4 578 953, April 1, 1986.
[37] Tabor, H and Bronicki, L. Y. Vapor Turbines, U.S. Patent. 3 040 528, June 26, 1962.
[38] Krieger, Z and Kaplan, U. Apparatus and Method for Producing Power using Geothermal
Fluid, U.S. Patent. 6 009 711, January 4, 2000.
[39] Steingrímsson, B., Guðmundsson, Á., Franzson, H. and Gunnlaugsson, E. Evidence of a
Supercritical Fluid at Depth in the Nesjavellir Field. Proc. Fifteenth Workshop on
Geothermal Reservoir Engineering, Stanford University, Stanford California,
January 23-25 1990, SGP-TR-130, pp. 81-88.
[40] Einarsson, P. and Brandsdottor, B., The Krafla Magma tic and Tectonic Episode of 1974-1989
at the Divergent Plate Boundary in North Iceland. . Eos Trans.AGU 87 (52) Fall Meet.
Suppl., 2006, Abstract T33E-07.
[41] Albertsson, A., Bjarnason, J.Ö., Gunnarsson, T., Ballzus C. and Ingason, K., Fluid
Handling and Evaluation, Part III, 33 p. In: Iceland Deep Drilling Project, Feasibility
Report, ed. G.O.Fridleifsson. Orkustofnun Report OS-2003-007.
[42] Albertson, A., Bjarnason, J.Ö, Gunnarsson, T., Ballzus, C. and Ingason, K., The Iceland
Deep Drilling Project: Fluid Handling, Evaluation, and Utilization. Proceedings of the
International Geothermal Conference IGC-2003 Reykjavik, September 2003, Session
6, pp. 23-30.
[43] Stern Review, Stern Review on the Economics of Climate Change, Cambridge University Press,
October 2006. www.cambridge.org/9780521700801.
[44] Nakicenovic, N., Grübler, A., and McDonald, A. (editors), Global Energy Perspectives.
Cambridge Univ. Press, 1998, 299 pp.
[45] Iðnaðarráðuneytið, Innlendar Orkulindir til Vinnslu Raforku. Iðnaðarráðuneytið,1994
[46] Orkuveita Reykjavíkur, Nesjavellir Power Plant. Orkuveita Reykjavíkur, 2003
[47] VSÓ, Bitruvirkjun, allt að 135 MW
e
jarðvarmavirkjun. Frummatsskýrsla. VSÓ for Orkuveita
Reykjavíkur, 2007.
[48] Grímur Björnsson, Endurskoðað hugmyndalíkan af jarðhiakerfum í Hengli og einfalt mat á
vinnslugetu nýrra borsvæða. Orkuveita Reykjavíkur, 2007
[49] VSÓ, Hverahlíðarvirkjun, allt að 90 MW
e
jarðvarmavirkjun. Frummatsskýrsla. VSÓ for
Orkuveita Reykjavíkur, 2007.
[50] Muffler, L. J. P. ed., Assessment of Geothermal Resources of the United States – 1978, U. S.
Geological Survey Circular 790, 163 p., 1979. Available:
[51] Green, B. D. and Nix, R. G., Geothermal – The Energy under our Feet, National Renewable
Energy Laboratory Technical Report NREL/TP-840-40665, Golden, Colorado, 16 p.,
2006. Available: .
[52] Tester, J. W., Anderson, B. J., Batchelor, A. S., Blackwell, D. B., Di Pippo, Ronald, Drake,
E.L., Garnish, J., Livesay, B., Moore, M. C., Nichols, K., Petty, S., Toksöz, M. N.,
and. Veatch, R. W. Jr., The Future of Geothermal Energy, Idaho National Laboratory
External Report INL/EXT-06-11746, Idaho Falls, ID, 396p., 2006.
Available: or
[53] T. J. Hammons and A. Gunnarsson. Geothermal Power Developments and Sustainability in
Iceland and Worldwide, International Journal of Power and Energy Systems, ACTA
Press, Vol. 30, (2), 2010, pp. 94-107.
Electricity Infrastructures in the Global Marketplace236
Reliability Modelling and Assessment of Power
System Operation in the Competitive Electric Energy Market 237
Reliability Modelling and Assessment of Power System Operation in the
Competitive Electric Energy Market
Author Name
X
Reliability Modelling and Assessment of
Power System Operation in the Competitive
Electric Energy Market
This Chapter describes the main concepts and features of appropriate computational
methodologies that have been developed for assessing the overall reliability and operational
performance of electric power systems operating under the framework of the competitive
electric energy market. These methodologies are based on the Monte – Carlo sequential
simulation approach and are used for conducting the appropriate assessment studies on the
composite generation and transmission power systems. A special attention is given to the
impact of renewable energy sources while appropriate case studies are presented and
examined thoroughly in order to describe more effectively the basic features of the
developed methodologies.
6.1 Introduction
In recent years, electric power systems are adopting new technologies in their structure in
order to achieve better performance and efficiency in the electricity production,
transmission and distribution [1]. One of the most important aspects of the competitive
electric energy market is the operation of independent power producers that can be
connected at any system voltage level. This fact together with additional financial incentives
being developed in many countries has increased considerably the number of power
generating units using renewable energy sources [2].
Additionally, the role of transmission networks receives a great attention under the
framework of this new environment being applied. Their role is to enable the competition
by allowing an open access of all participants while keeping the system reliability and
operational performance within appropriate standards [1,2].
An increased need for simulating the operation of power systems has emerged in order to
take into consideration all the special operating features and procedures that are being
incorporated as a result of this new environment. For this purpose, appropriate
computational methods are being developed to be used for examining alternative
operational schemes of power systems and investigating the impact of certain features (such
as the penetration level of renewable energy sources) to their overall reliability and
operational performance. These methods are mainly based on the Monte – Carlo sequential
simulation approach and it was proved that they are very useful for comparing thoroughly
different planning and operational schemes of power systems in order to deduce the
optimal one.
6
Electricity Infrastructures in the Global Marketplace238
6.2 Monte–Carlo Sequential Simulation Approach
The Monte – Carlo sequential simulation approach is a stochastic simulation procedure and
can be used for calculating the operational and reliability indices of a power system by
simulating its actual behavior [3–6]. The problem is treated as a series of real experiments
conducted in simulated time steps of one hour. A series of system scenarios is obtained by
hourly random drawings on the status of each system component and the determination of
the hourly load demand. The operational and reliability indices are calculated for each hour
with the process repeated for the remaining hours in the year (8760 hours). The annual
reliability indices are calculated from the year’s accumulation of data generated by the
simulation process. The year continues to be simulated with new sets of random events until
obtaining statistical convergence of the indices. The sequential simulation approach steps
through time chronologically, by recognising that the status of a system component is not
independent of its status in adjacent hours. Any event occurring within a particular time
step is considered to occur at the end of the time step and the system state and statistical
counters are updated accordingly. This approach can model any issues of concern that
involve time correlations and can be used to calculate frequency and duration reliability
indices. One very important advantage of the sequential simulation is the simplification of a
particular system state simulation by considering information obtained from the analysis of
the previous system states. This can only be applied when the system states change very
little from one time step to the next. Such an assumption can be made for the transmission
system that does not suffer large changes very often.
An efficient computational methodology has been developed at the National Technical
University of Athens (NTUA) for the operational and reliability assessment of power
systems applying the above principles of the Monte – Carlo sequential simulation approach.
This methodology has the following main features [6]:
The random events are determined by using appropriate pseudo-random numbers that
are generated applying the mixed multiplicative congruent method. The antithetic
sampling technique is also used for variance reduction.
The classical two-state Markovian model is generally used to represent the operation of
the system generating units. The generating units of certain thermal plants (for example,
combined cycle plants) or the large thermal units may be represented by a multiple state
model in order to recognise their derated states.
The generating units may be taken out for scheduled maintenance during certain time
periods of the year by using their appropriate data being specified.
The prime objective of the above computational methodology is to calculate appropriate
indices that quantify the operational and reliability performance of a power system. It is
generally considered that the following indices are the most important system and load-
point indices while they have the corresponding units and acronyms in parentheses:
Loss Of Load Expectation (LOLE) in hours/year.
Loss Of Energy Expectation (LOEE) in MWh/year.
Frequency of Loss Of Load (FLOL) in occurrences/year.
Expected Demand Not Supplied (EDNS) in MW.
Average Duration of Loss of Load (ADLL) in hours.
6.3 Reliability Modelling and Operational Performance of Isolated Power Systems with
an Increased Penetration of Renewable Energy Sources
6.3.1 General
An important aspect of power generation systems operating under the framework of the
competitive electric energy market is the increased use of renewable energy sources. However,
their integration into the existing and future power systems represents an enormous
technological challenge since there are serious limitations to the use of renewable energy
sources due to the uncertainty of the weather conditions that constitute the main features of
their operation. For this purpose, during the recent years, additional research effort has been
devoted concerning the impact of the respective generating units on the operational
performance of these systems. Wind has proven to be the most successful of all available
renewable sources, since it offers relatively high capacities with generation costs that are
becoming competitive with conventional energy sources. However, a major problem to its
effective use as a power source is the fact that it is both intermittent and diffuse as wind speed
is highly variable and site specific [7]. Additionally, an increased use of small hydroelectric
plants that operate continuously throughout a year has also been identified.
The isolated power systems face specific problems that are related to their planning and
operation when they are compared with the interconnected systems. In general, the
customers of these systems face higher costs and poorer quality of supply than the
customers of large interconnected systems. The main problems being identified concern the
security and reliability of the systems while additional difficulties are expected due to high
wind power penetration. Therefore, the introduction of high wind power penetration in the
generation system of isolated power systems may reduce their operational reliability and
dynamic security. A common aspect to all these problems is the requirement to ensure that
sufficient reserve capacity exists within the system to compensate for sudden loss of
generation. It is therefore evident that generation planning and operation is very critical on
isolated systems.
6.3.2 General Features of Isolated Power System Operation
The reliability and operational assessment studies of isolated power systems require
appropriate modeling of their features that affect their operation. These basic features are
the following:
The generation system mainly consists of thermal generating units of various types
while hydroelectric power plants may exist that consist of appropriate generating
units and reservoirs. Additionally, wind parks may be connected to the system
busbars and they consist of appropriate units.
The existing steam turbines and the internal combustion engines mainly supply the
base-load demand. The combustion turbines have high production cost and they
normally supply the daily peak load demand or the load demand that cannot be
supplied by the other system units in outage conditions.
The thermal generating units are called on to operate in order to supply the relevant
load demand of the system according to a priority order that is determined by their
production cost. Additionally, a level of spinning reserve capacity must be available
Reliability Modelling and Assessment of Power
System Operation in the Competitive Electric Energy Market 239
6.2 Monte–Carlo Sequential Simulation Approach
The Monte – Carlo sequential simulation approach is a stochastic simulation procedure and
can be used for calculating the operational and reliability indices of a power system by
simulating its actual behavior [3–6]. The problem is treated as a series of real experiments
conducted in simulated time steps of one hour. A series of system scenarios is obtained by
hourly random drawings on the status of each system component and the determination of
the hourly load demand. The operational and reliability indices are calculated for each hour
with the process repeated for the remaining hours in the year (8760 hours). The annual
reliability indices are calculated from the year’s accumulation of data generated by the
simulation process. The year continues to be simulated with new sets of random events until
obtaining statistical convergence of the indices. The sequential simulation approach steps
through time chronologically, by recognising that the status of a system component is not
independent of its status in adjacent hours. Any event occurring within a particular time
step is considered to occur at the end of the time step and the system state and statistical
counters are updated accordingly. This approach can model any issues of concern that
involve time correlations and can be used to calculate frequency and duration reliability
indices. One very important advantage of the sequential simulation is the simplification of a
particular system state simulation by considering information obtained from the analysis of
the previous system states. This can only be applied when the system states change very
little from one time step to the next. Such an assumption can be made for the transmission
system that does not suffer large changes very often.
An efficient computational methodology has been developed at the National Technical
University of Athens (NTUA) for the operational and reliability assessment of power
systems applying the above principles of the Monte – Carlo sequential simulation approach.
This methodology has the following main features [6]:
The random events are determined by using appropriate pseudo-random numbers that
are generated applying the mixed multiplicative congruent method. The antithetic
sampling technique is also used for variance reduction.
The classical two-state Markovian model is generally used to represent the operation of
the system generating units. The generating units of certain thermal plants (for example,
combined cycle plants) or the large thermal units may be represented by a multiple state
model in order to recognise their derated states.
The generating units may be taken out for scheduled maintenance during certain time
periods of the year by using their appropriate data being specified.
The prime objective of the above computational methodology is to calculate appropriate
indices that quantify the operational and reliability performance of a power system. It is
generally considered that the following indices are the most important system and load-
point indices while they have the corresponding units and acronyms in parentheses:
Loss Of Load Expectation (LOLE) in hours/year.
Loss Of Energy Expectation (LOEE) in MWh/year.
Frequency of Loss Of Load (FLOL) in occurrences/year.
Expected Demand Not Supplied (EDNS) in MW.
Average Duration of Loss of Load (ADLL) in hours.
6.3 Reliability Modelling and Operational Performance of Isolated Power Systems with
an Increased Penetration of Renewable Energy Sources
6.3.1 General
An important aspect of power generation systems operating under the framework of the
competitive electric energy market is the increased use of renewable energy sources. However,
their integration into the existing and future power systems represents an enormous
technological challenge since there are serious limitations to the use of renewable energy
sources due to the uncertainty of the weather conditions that constitute the main features of
their operation. For this purpose, during the recent years, additional research effort has been
devoted concerning the impact of the respective generating units on the operational
performance of these systems. Wind has proven to be the most successful of all available
renewable sources, since it offers relatively high capacities with generation costs that are
becoming competitive with conventional energy sources. However, a major problem to its
effective use as a power source is the fact that it is both intermittent and diffuse as wind speed
is highly variable and site specific [7]. Additionally, an increased use of small hydroelectric
plants that operate continuously throughout a year has also been identified.
The isolated power systems face specific problems that are related to their planning and
operation when they are compared with the interconnected systems. In general, the
customers of these systems face higher costs and poorer quality of supply than the
customers of large interconnected systems. The main problems being identified concern the
security and reliability of the systems while additional difficulties are expected due to high
wind power penetration. Therefore, the introduction of high wind power penetration in the
generation system of isolated power systems may reduce their operational reliability and
dynamic security. A common aspect to all these problems is the requirement to ensure that
sufficient reserve capacity exists within the system to compensate for sudden loss of
generation. It is therefore evident that generation planning and operation is very critical on
isolated systems.
6.3.2 General Features of Isolated Power System Operation
The reliability and operational assessment studies of isolated power systems require
appropriate modeling of their features that affect their operation. These basic features are
the following:
The generation system mainly consists of thermal generating units of various types
while hydroelectric power plants may exist that consist of appropriate generating
units and reservoirs. Additionally, wind parks may be connected to the system
busbars and they consist of appropriate units.
The existing steam turbines and the internal combustion engines mainly supply the
base-load demand. The combustion turbines have high production cost and they
normally supply the daily peak load demand or the load demand that cannot be
supplied by the other system units in outage conditions.
The thermal generating units are called on to operate in order to supply the relevant
load demand of the system according to a priority order that is determined by their
production cost. Additionally, a level of spinning reserve capacity must be available
Electricity Infrastructures in the Global Marketplace240
for use in emergency conditions that is usually determined by using an appropriate
deterministic security criterion. It can be equal to either a certain percentage of the
system load demand (e.g. 10%) or the capacity of the largest unit in operation or a
constant value.
A hydro chain may exist that consists of hydroelectric plants being located on the
same river or water flow. The respective topographical sites or the construction
facilities mainly determine the storage capability of reservoirs. Pump storage
facilities may also exist.
A variety of operating and water management policies can be implemented and they
have a significant impact on the reliability and operational performance of the
systems that have limitations in the energy being produced by the hydroelectric
power plants.
Several factors affecting the actual dispatch of generating units must be considered
such as fuel costs, energy states of reservoirs, restrictions in use of water, energy used
to pump water and irrigation requirements.
Isolated power systems with a large wind penetration margin might face large
voltage and frequency excursions and dynamically unstable situations when fast
wind power changes and very high wind speeds result in sudden loss of wind power
generation. This loss can be compensated with additional production from the
system conventional generating units that are in a spinning reserve mode of
operation. These system operational features determine the wind penetration margin
that is expressed as a fraction of the wind power generation to the respective load
demand. This penetration margin can be increased by considering the operation of
hydroelectric plants that incorporate pumping facilities.
6.3.3 Computational Methodology
An efficient computational methodology has been developed at NTUA for the reliability
and cost assessment of isolated power systems. This methodology integrates the operating
aspects of wind parks and small hydroelectric power plants and evaluates their impact on
the reliability and production cost of the system. These aspects are the following:
The system conventional generating units are divided into two groups (fast, slow)
according to their technical characteristics to change their power output. Additionally,
these units are divided into two groups that can either supply the base-load demand or
not supply it respectively.
A number of wind parks can be installed at various geographical sites and each wind
park consists of a certain number of groups of identical wind generating units. These
wind parks are connected to the appropriate system busbars applying the existing
connection rules of the system.
The hourly wind speed of a geographical site is represented by an appropriate normal
distribution which means that the values of the mean and standard deviation need to be
given as input data for each hour of the year (8760 points). For simplicity reasons, the
standard deviation may be assumed constant (e.g. 5%). The available power output of a
wind-generating unit at any time point is calculated by using either a linear or nonlinear
relationship between the power output and the wind speed of the respective
geographical site.
The classical two-state Markovian model simulates the operation of wind generating
units.
The total wind power generation of the system at any simulation time period of the year
is not allowed to exceed a certain fraction of the respective system load demand. This
fraction expresses the wind penetration constraint (margin) being assumed in order to
retain acceptable service reliability, security and efficient operation of the conventional
generating units. If the total wind power generation of the system is higher than the
limiting value, it is necessary to reduce this generation level. For this purpose, the
system control center will send appropriate orders to each wind park to reduce its total
power output by a certain amount. This amount of power output is calculated so that the
same percentage reduction will be applied for each wind park being in operation. As a
result, it is assumed that a certain number of wind generating units in each wind park
will be either disconnected from the system or decrease their power output by using
appropriate procedures that take into account the technical characteristics of the
respective units.
A number of small hydroelectric power plants can be connected at appropriate system
busbars and each plant consists of a certain number of identical generating units. It is
considered that these units operate continuously throughout the year and their hourly
power output is calculated by taking into account the respective monthly production
and a typical curve for the hourly production of one day.
The operational performance of wind and hydroelectric generating units is quantified by
taking into account the events which occur when they fail to produce their available
output capacity due to their existing limitations (failure, maintenance).
The available spinning reserve of the system for each simulation time period is
calculated by taking into account the operational features of system generation during
the previous time period. For this purpose, two criteria are used. Criterion 1 assumes
that the spinning reserve is equal to a certain percentage of the total wind power
generation in order to compensate a sudden loss of this generation output in the cases of
very fast wind speed changes. Criterion 2 assumes that the spinning reserve is equal to a
certain percentage of total system loads in order to compensate for a sudden loss of the
generation provided by the system conventional generating units (reliability criterion).
The actual value for the spinning reserve is calculated as the greatest value being
obtained by the two criteria. For this purpose, only the fast conventional generating
units are taken into account.
An appropriate algorithm was developed and incorporated in the above methodology in
order to simulate the dispatch procedures of system generating units for supplying the
respective load demand in each simulation time period. This algorithm takes into account
only the generating units of the system that are available (not being either in a repair or
maintenance state) and has the following basic steps:
1. The small hydroelectric generating units are called on to operate and their power output
is calculated according to their technical characteristics.
2. The conventional generating units, that are assigned to supply the base-load demand,
are called on to operate at their minimum output capacity according to their priority
order.
Reliability Modelling and Assessment of Power
System Operation in the Competitive Electric Energy Market 241
for use in emergency conditions that is usually determined by using an appropriate
deterministic security criterion. It can be equal to either a certain percentage of the
system load demand (e.g. 10%) or the capacity of the largest unit in operation or a
constant value.
A hydro chain may exist that consists of hydroelectric plants being located on the
same river or water flow. The respective topographical sites or the construction
facilities mainly determine the storage capability of reservoirs. Pump storage
facilities may also exist.
A variety of operating and water management policies can be implemented and they
have a significant impact on the reliability and operational performance of the
systems that have limitations in the energy being produced by the hydroelectric
power plants.
Several factors affecting the actual dispatch of generating units must be considered
such as fuel costs, energy states of reservoirs, restrictions in use of water, energy used
to pump water and irrigation requirements.
Isolated power systems with a large wind penetration margin might face large
voltage and frequency excursions and dynamically unstable situations when fast
wind power changes and very high wind speeds result in sudden loss of wind power
generation. This loss can be compensated with additional production from the
system conventional generating units that are in a spinning reserve mode of
operation. These system operational features determine the wind penetration margin
that is expressed as a fraction of the wind power generation to the respective load
demand. This penetration margin can be increased by considering the operation of
hydroelectric plants that incorporate pumping facilities.
6.3.3 Computational Methodology
An efficient computational methodology has been developed at NTUA for the reliability
and cost assessment of isolated power systems. This methodology integrates the operating
aspects of wind parks and small hydroelectric power plants and evaluates their impact on
the reliability and production cost of the system. These aspects are the following:
The system conventional generating units are divided into two groups (fast, slow)
according to their technical characteristics to change their power output. Additionally,
these units are divided into two groups that can either supply the base-load demand or
not supply it respectively.
A number of wind parks can be installed at various geographical sites and each wind
park consists of a certain number of groups of identical wind generating units. These
wind parks are connected to the appropriate system busbars applying the existing
connection rules of the system.
The hourly wind speed of a geographical site is represented by an appropriate normal
distribution which means that the values of the mean and standard deviation need to be
given as input data for each hour of the year (8760 points). For simplicity reasons, the
standard deviation may be assumed constant (e.g. 5%). The available power output of a
wind-generating unit at any time point is calculated by using either a linear or nonlinear
relationship between the power output and the wind speed of the respective
geographical site.
The classical two-state Markovian model simulates the operation of wind generating
units.
The total wind power generation of the system at any simulation time period of the year
is not allowed to exceed a certain fraction of the respective system load demand. This
fraction expresses the wind penetration constraint (margin) being assumed in order to
retain acceptable service reliability, security and efficient operation of the conventional
generating units. If the total wind power generation of the system is higher than the
limiting value, it is necessary to reduce this generation level. For this purpose, the
system control center will send appropriate orders to each wind park to reduce its total
power output by a certain amount. This amount of power output is calculated so that the
same percentage reduction will be applied for each wind park being in operation. As a
result, it is assumed that a certain number of wind generating units in each wind park
will be either disconnected from the system or decrease their power output by using
appropriate procedures that take into account the technical characteristics of the
respective units.
A number of small hydroelectric power plants can be connected at appropriate system
busbars and each plant consists of a certain number of identical generating units. It is
considered that these units operate continuously throughout the year and their hourly
power output is calculated by taking into account the respective monthly production
and a typical curve for the hourly production of one day.
The operational performance of wind and hydroelectric generating units is quantified by
taking into account the events which occur when they fail to produce their available
output capacity due to their existing limitations (failure, maintenance).
The available spinning reserve of the system for each simulation time period is
calculated by taking into account the operational features of system generation during
the previous time period. For this purpose, two criteria are used. Criterion 1 assumes
that the spinning reserve is equal to a certain percentage of the total wind power
generation in order to compensate a sudden loss of this generation output in the cases of
very fast wind speed changes. Criterion 2 assumes that the spinning reserve is equal to a
certain percentage of total system loads in order to compensate for a sudden loss of the
generation provided by the system conventional generating units (reliability criterion).
The actual value for the spinning reserve is calculated as the greatest value being
obtained by the two criteria. For this purpose, only the fast conventional generating
units are taken into account.
An appropriate algorithm was developed and incorporated in the above methodology in
order to simulate the dispatch procedures of system generating units for supplying the
respective load demand in each simulation time period. This algorithm takes into account
only the generating units of the system that are available (not being either in a repair or
maintenance state) and has the following basic steps:
1. The small hydroelectric generating units are called on to operate and their power output
is calculated according to their technical characteristics.
2. The conventional generating units, that are assigned to supply the base-load demand,
are called on to operate at their minimum output capacity according to their priority
order.
Electricity Infrastructures in the Global Marketplace242
3. The power output of wind generating units is calculated by using the relevant wind
speed data in each geographic site.
4. The wind penetration level is taken into account and, if it is necessary, appropriate
reduction orders are applied to the power output of wind generating units.
5. The remaining load demand to be supplied is allocated to the conventional generating
units. Firstly, the units supplying the base-load demand are called on to operate with the
appropriate power output by using their priority order. If additional power generation is
required, the other available conventional generating units are called on to operate by
using their priority order.
It must be noted that the criteria for the system spinning reserve are also taken into account.
These criteria determine the power output of the conventional generating units and the
operation of additional units if it is required.
Using the developed computational methodology, the following additional system indices
are calculated which have the corresponding units and acronyms in parentheses:
a) Four indices quantifying the system generation capability and production cost:
Expected total energy supplied by conventional generating units (EGSM) in
GWh/year.
Expected energy supplied by wind generating units (EWSM) in GWh/year.
Expected energy supplied by small hydroelectric power plants (EHSM) in
GWh/year.
Expected production cost of the generation system (PCSM) in Euro/MWh.
b) Four indices quantifying the operational performance of wind generating units by taking
into account the events that may occur (failures, maintenance):
Frequency of events being occurred (FNSWS) in occurrences/year.
Expected annual duration of events being occurred (DNSWS) in hours/year.
Expected load demand not supplied during the events being occurred (PNSWS) in
MW.
Expected energy not supplied during the events being occurred (ENSWS, ENSWM)
in MWh/year.
c) Three indices quantifying the operational performance of the wind generation system by
taking into account the events that occur when an order is issued for wind power reduction:
Frequency of such events (AVPRF) in hours/year.
Expected energy not supplied (AVPRE) in MWh/year.
Expected wind power output not produced (AVPRL) in MW.
d) Four indices quantifying the operational performance of the small hydroelectric
generating units by taking into account the events that may occur (failures,
maintenance):
Frequency of events being occurred (FNSHS) in occurrences/year.
Expected annual duration of events being occurred (DNSHS) in hours/year.
Expected load demand not supplied during the events being occurred (PNSHS) in MW.
Expected energy not supplied during the events being occurred (ENSHS, ENSHM) in
MWh/year.
e) Three indices quantifying the available spinning reserve by applying the respective
criterion:
Available spinning reserve (AVSPRES) as a percentage of the respective load
demand.
Percentages of applying Criteria 1 and 2 for evaluating spinning reserve (FWIND,
FLOAD).
6.3.4 Assessment Studies
The developed computational methodology was applied for conducting reliability
assessment studies on a typical isolated power system that is based on the power system of
a Greek island. The main features of the system are the following:
The installed generating capacity of the conventional units is equal to 522.6 MW. The
system peak load demand is equal to 430 MW and occurs on a winter day while the
overnight loads are approximately equal to 25% of the corresponding daily peak load
demands.
There are twenty conventional generating units of four different types that are
installed in two power plants (I and II). These plants are located near to the major
load points of the island for various reasons such as electrical design, environmental
issues, etc. The complete characteristics of the generating units are shown in Table
6.1.
There are six wind parks being installed at five different geographic sites of the
island with 131 generating units having various power output capacities and their
total generating capacity is equal to 66.85MW. The wind parks are usually installed
in geographic sites with favorable wind conditions and their major characteristics are
shown in Table 6.2.
There are eight small hydroelectric power plants with eight generating units having
various power output capacities and their total installed capacity is equal to 10.05
MW. The main characteristics of these units are shown in Table 6.3.
The power generation system is only considered since it is assumed that the
transmission network of the isolated system is fully reliable with an unlimited
transmission capacity during any outages.
The prices used for the calculation of the production cost for the generation system
are only the supply prices of fuel.
The available spinning reserve is calculated assuming that reserves are either equal
to 100% of total wind power generation according to Criterion 1 or they are equal to
10% of the system load demand according to Criterion 2.
The typical curve for the hourly production of hydroelectric plants for one day is a
constant straight line.
This system provides a good example for illustrating the different operating features of
isolated power systems. The full set of system indices was evaluated for the following eight
alternative case studies:
Case 1: Base case study assuming a wind penetration margin of 20%.
Case 2: As in Case 1 but the wind penetration margin is decreased to 10%.
Reliability Modelling and Assessment of Power
System Operation in the Competitive Electric Energy Market 243
3. The power output of wind generating units is calculated by using the relevant wind
speed data in each geographic site.
4. The wind penetration level is taken into account and, if it is necessary, appropriate
reduction orders are applied to the power output of wind generating units.
5. The remaining load demand to be supplied is allocated to the conventional generating
units. Firstly, the units supplying the base-load demand are called on to operate with the
appropriate power output by using their priority order. If additional power generation is
required, the other available conventional generating units are called on to operate by
using their priority order.
It must be noted that the criteria for the system spinning reserve are also taken into account.
These criteria determine the power output of the conventional generating units and the
operation of additional units if it is required.
Using the developed computational methodology, the following additional system indices
are calculated which have the corresponding units and acronyms in parentheses:
a) Four indices quantifying the system generation capability and production cost:
Expected total energy supplied by conventional generating units (EGSM) in
GWh/year.
Expected energy supplied by wind generating units (EWSM) in GWh/year.
Expected energy supplied by small hydroelectric power plants (EHSM) in
GWh/year.
Expected production cost of the generation system (PCSM) in Euro/MWh.
b) Four indices quantifying the operational performance of wind generating units by taking
into account the events that may occur (failures, maintenance):
Frequency of events being occurred (FNSWS) in occurrences/year.
Expected annual duration of events being occurred (DNSWS) in hours/year.
Expected load demand not supplied during the events being occurred (PNSWS) in
MW.
Expected energy not supplied during the events being occurred (ENSWS, ENSWM)
in MWh/year.
c) Three indices quantifying the operational performance of the wind generation system by
taking into account the events that occur when an order is issued for wind power reduction:
Frequency of such events (AVPRF) in hours/year.
Expected energy not supplied (AVPRE) in MWh/year.
Expected wind power output not produced (AVPRL) in MW.
d) Four indices quantifying the operational performance of the small hydroelectric
generating units by taking into account the events that may occur (failures,
maintenance):
Frequency of events being occurred (FNSHS) in occurrences/year.
Expected annual duration of events being occurred (DNSHS) in hours/year.
Expected load demand not supplied during the events being occurred (PNSHS) in MW.
Expected energy not supplied during the events being occurred (ENSHS, ENSHM) in
MWh/year.
e) Three indices quantifying the available spinning reserve by applying the respective
criterion:
Available spinning reserve (AVSPRES) as a percentage of the respective load
demand.
Percentages of applying Criteria 1 and 2 for evaluating spinning reserve (FWIND,
FLOAD).
6.3.4 Assessment Studies
The developed computational methodology was applied for conducting reliability
assessment studies on a typical isolated power system that is based on the power system of
a Greek island. The main features of the system are the following:
The installed generating capacity of the conventional units is equal to 522.6 MW. The
system peak load demand is equal to 430 MW and occurs on a winter day while the
overnight loads are approximately equal to 25% of the corresponding daily peak load
demands.
There are twenty conventional generating units of four different types that are
installed in two power plants (I and II). These plants are located near to the major
load points of the island for various reasons such as electrical design, environmental
issues, etc. The complete characteristics of the generating units are shown in Table
6.1.
There are six wind parks being installed at five different geographic sites of the
island with 131 generating units having various power output capacities and their
total generating capacity is equal to 66.85MW. The wind parks are usually installed
in geographic sites with favorable wind conditions and their major characteristics are
shown in Table 6.2.
There are eight small hydroelectric power plants with eight generating units having
various power output capacities and their total installed capacity is equal to 10.05
MW. The main characteristics of these units are shown in Table 6.3.
The power generation system is only considered since it is assumed that the
transmission network of the isolated system is fully reliable with an unlimited
transmission capacity during any outages.
The prices used for the calculation of the production cost for the generation system
are only the supply prices of fuel.
The available spinning reserve is calculated assuming that reserves are either equal
to 100% of total wind power generation according to Criterion 1 or they are equal to
10% of the system load demand according to Criterion 2.
The typical curve for the hourly production of hydroelectric plants for one day is a
constant straight line.
This system provides a good example for illustrating the different operating features of
isolated power systems. The full set of system indices was evaluated for the following eight
alternative case studies:
Case 1: Base case study assuming a wind penetration margin of 20%.
Case 2: As in Case 1 but the wind penetration margin is decreased to 10%.