Electricity Infrastructures in the Global Marketplace Part 14 potx
Bạn đang xem bản rút gọn của tài liệu. Xem và tải ngay bản đầy đủ của tài liệu tại đây (2.95 MB, 50 trang )
Power Markets of Asian Countries in the International Markets Environment 619
3) Support for the operation of interconnected transmission lines (management of ATC,
maintenance work coordination, and congestion management)
4) Provision of information about transmission systems.
As shown in Figure 16.7, the ESCJ is composed of a governing board and various expert
committees, such as a rule-making committee and a rule monitoring committee under the
control of a general meeting of members who are the general power utilities, PPSs, whole-
sale electricity suppliers and neutral parties, each having an equal voting right. A consulta-
tive board conveys the views of non-members to the Council.
Figure 16.7. Structure of the ESCJ
16.4.2.2 The Japan Electric Power Exchange
The Japan Electric Power Exchange (JEPX) is a privately managed voluntary institution that
was founded as Japan’s first nationwide power exchange. The JEPX performs risk manage-
ment functions, including the formation of a benchmark price, and the provision of selling
and procurement means in the event of a mismatch of supply and demand.
Anyone who is capable of handling the generation and has assets worth 10 million yen or
more can participate in the trading market. The JEPX deals in the following types of market.
1) Day-ahead market (spot deals):
Spot deals are deals for selling and buying electricity in units of 30 minutes to be used the
next day and for 48 different commodities of electricity. Contracts are closed on the single-
price auction basis.
In Japan, in order to fully consider the characteristics of electricity and perform public welfare
tasks, an electricity deregulation model designed to achieve structural reforms within the
framework of electric power companies’ integrated power generation and transmission system
has been adopted. This is instead of the vertically unbundled electric utility model prevailing
in the United States and European countries. The changes made in the third step are described
in more detail as these represent the salient features of Japan’s structural reforms.
16.4.2 Outline of the Institutional Revisions Effective in 2005
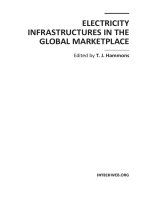
Figure 16.6 outlines the institutional revisions made since April 2005. The main measures
implemented include:
Figure 16.6. Institutional revisions made since April 2005.
1) Establishment of a neutral organization and the enforcement of activity regulations in
order to secure fairness and transparency in the network sector within the integrated power
generation/transmission framework
2) Creation of the Japan Electric Power Exchange
3) Expansion of retail electricity deregulation to cover all high voltage customers
4) Elimination of the pancake rate system in order to facilitate the use of power grids across
the country.
16.4.2.1 Neutral Agency
The neutral agency is called the Electric Power System Council of Japan (ESCJ), and its main
functions are:
1) Rule making for using power grids
2) Rule monitoring (settlement of disputes)
Low-voltage custome
r
Generating
Retail
PPS
Electric Utility
(Vertically Integrated)
High-Voltage and Special high-voltage customer
Retail Customers
Expansion of range of retail
customer
Wholesale electricity
market
(
JEPX
)
IPPs
Power transmission
service
Transmission
and
distribution
Neutral
Organization
(ESCJ)
(securing equity and
transparency of
power transmission
and distribution )
PPS: Power Producers and Suppliers
Electricity Infrastructures in the Global Marketplace620
Ob
j
ectives Issues
Areas of Assessment
Items of Assessment
E
n
hanced
efficien-cy
of electric
power
supply
service
Retail elec-
tricity
market
-
Chan
g
es in electrici-
ty rates
- Factors contributing
to cost reductions and
rate cuts
- Initiatives other than
electricity rates
1) Electricit
y
rates
- Changes in the levels of electricity
rates
- Quantitative analyses of the effects
of institutional reforms on electrici-
ty rates
2) Factors other than electricity rates
- Efforts in terms of services
- Initiatives designed to strengthen
business bases, including technolo-
gical innovation and development
of overseas business operations
3) Options for customers
- Number of suppliers and shares
- Customer satisfaction
Wholesale
electricity
market
-
Robustness of the
power generation and
wholesale electricity
markets
- Performance of
JEPX’s initial purpos-
es
1) Wholesale electricit
y
market
- Trading volume by electric power
companies and PPSs, and prices
- Trade channels (cross trading with
JEPX, self-supply and purchase
from other companies, etc.)
- Correlation among wholesale elec-
tricity prices, generation costs and
retail prices
2) JEPX
- Position of JEPX in the wholesale
market
- Trading volume and prices in spot
market and forward market, and
liquidity compared with bilateral
trading
Suppl
y
Reliability
Construc-
tion, main-
tenance
and re-
newal of
facilities
-
Facilit
y
i
n
vestment
- Maintenance and
renewal of facilities
- Attainment of suita-
ble generating mix
-
Suppl
y
reliabilit
y
- Changes in the amount of facility
investment
- Facility maintenance levels and
measures for extension of life of
facilities
- A future power generation mix,
transmission line construction
plans, and electric power develop-
ment
p
lans b
y
PPSs, etc.
Intercon-
nected
transmis-
sion line
- Limitation of line
capacity
- Construction of interconnected
lines
- Maintenance and operation of in-
terconnected lines
Table 16.4. Assessment of the Macroscopic Policy Objectives (continued on next page)
2) Forward market:
Forward market deals sell and buy electricity for one year ahead from the following month
in one-month units. Contracts for 24-hour delivery and for daytime delivery from 8 a.m. to
10 p.m. on weekdays are traded. Transactions are performed on a continuous session (price-
oriented, time-oriented) basis.
16.4.3 Assessment of Institutional Reforms
A study on deregulating retail electricity for all customers started in fiscal 2007. The institu-
tional reforms implemented so far are now being assessed and verified. The assessment
looks at:
1) How macroeconomic policy objectives, such as enhanced efficiency, stable supply and
environmental protection, have been achieved; and
2) What kind of results have the implications of individual institutional reforms, such as the
elimination of pancake rates and the establishment of a neutral agency and an electric power
exchange brought?
The results of the assessment were made available by the summer of 2006. This section
summarizes the areas of assessment and the items assessed.
Regarding the macroeconomic policy objectives in 1) above, as shown in Table 16.4, the ef-
fects of the current institutional reforms on enhancement of the efficiency of electric power
supply services, supply stability, and environmental protection is verified. Essential points
in the assessment include the robustness of the electricity rate and trading market, capital
spending, congestion of interconnected transmission lines, investment in the development
of technologies, and investment without consideration of the environment.
On the other hand, the effects of individual institutional reforms are assessed in terms of the
objectives mentioned in Table 16.5.
Power Markets of Asian Countries in the International Markets Environment 621
Ob
j
ectives Issues
Areas of Assessment
Items of Assessment
E
n
hanced
efficien-cy
of electric
power
supply
service
Retail elec-
tricity
market
-
Chan
g
es in electrici-
ty rates
- Factors contributing
to cost reductions and
rate cuts
- Initiatives other than
electricity rates
1) Electricit
y
rates
- Changes in the levels of electricity
rates
- Quantitative analyses of the effects
of institutional reforms on electrici-
ty rates
2) Factors other than electricity rates
- Efforts in terms of services
- Initiatives designed to strengthen
business bases, including technolo-
gical innovation and development
of overseas business operations
3) Options for customers
- Number of suppliers and shares
- Customer satisfaction
Wholesale
electricity
market
-
Robustness of the
power generation and
wholesale electricity
markets
- Performance of
JEPX’s initial purpos-
es
1) Wholesale electricit
y
market
- Trading volume by electric power
companies and PPSs, and prices
- Trade channels (cross trading with
JEPX, self-supply and purchase
from other companies, etc.)
- Correlation among wholesale elec-
tricity prices, generation costs and
retail prices
2) JEPX
- Position of JEPX in the wholesale
market
- Trading volume and prices in spot
market and forward market, and
liquidity compared with bilateral
trading
Suppl
y
Reliability
Construc-
tion, main-
tenance
and re-
newal of
facilities
-
Facilit
y
i
n
vestment
- Maintenance and
renewal of facilities
- Attainment of suita-
ble generating mix
-
Suppl
y
reliabilit
y
- Changes in the amount of facility
investment
- Facility maintenance levels and
measures for extension of life of
facilities
- A future power generation mix,
transmission line construction
plans, and electric power develop-
ment
p
lans b
y
PPSs, etc.
Intercon-
nected
transmis-
sion line
- Limitation of line
capacity
- Construction of interconnected
lines
- Maintenance and operation of in-
terconnected lines
Table 16.4. Assessment of the Macroscopic Policy Objectives (continued on next page)
2) Forward market:
Forward market deals sell and buy electricity for one year ahead from the following month
in one-month units. Contracts for 24-hour delivery and for daytime delivery from 8 a.m. to
10 p.m. on weekdays are traded. Transactions are performed on a continuous session (price-
oriented, time-oriented) basis.
16.4.3 Assessment of Institutional Reforms
A study on deregulating retail electricity for all customers started in fiscal 2007. The institu-
tional reforms implemented so far are now being assessed and verified. The assessment
looks at:
1) How macroeconomic policy objectives, such as enhanced efficiency, stable supply and
environmental protection, have been achieved; and
2) What kind of results have the implications of individual institutional reforms, such as the
elimination of pancake rates and the establishment of a neutral agency and an electric power
exchange brought?
The results of the assessment were made available by the summer of 2006. This section
summarizes the areas of assessment and the items assessed.
Regarding the macroeconomic policy objectives in 1) above, as shown in Table 16.4, the ef-
fects of the current institutional reforms on enhancement of the efficiency of electric power
supply services, supply stability, and environmental protection is verified. Essential points
in the assessment include the robustness of the electricity rate and trading market, capital
spending, congestion of interconnected transmission lines, investment in the development
of technologies, and investment without consideration of the environment.
On the other hand, the effects of individual institutional reforms are assessed in terms of the
objectives mentioned in Table 16.5.
Electricity Infrastructures in the Global Marketplace622
Areas of Assessment
Items of Assessment
Wheelin
g
service sys-
tem
-
Elimination of pa
n
cake
rates and revitalization of
wide-area power transaction
- Functions of the new im-
balance charging system
-
Effects on wide-area transactions and
on JEPX trade
- Recovery of transmission line costs, an
appropriate cost reimbursement mechan-
ism, and restrictions on the siting of
power sources in remote places
- The incidence of imbalances and the
shouldering of charges
Activit
y
re
g
u-
lations
-
Securin
g
of fairness and
transparency in the trans-
mission/distribution seg-
ment through activity regu-
lations
(a) Information firewall
- Management of information related to
wheeling service, and formulation and
announcement of internal rules
(b) Prohibition of discriminatory treat-
ment
- A survey of cases of discriminatory
treatment in access to wheeling service
for specific power suppliers
(c) Prohibition of cross-subsidization
(keeping of different account books)
- Preparation and disclosure of docu-
ments needed to verify an income and
expenditure account statement and the
process of preparing the statement
Neutral
agency
-Securin
g
of fairness and
transparency in access to
power grids, construction of
facilities and disclosure of
information
-
Establishment of an or
g
anization and a
mechanism designed to achieve fairness,
transparency and neutrality
- Rule-making procedures securing fair-
ness, transparency and neutrality
- Consistency of load dispatching com-
munication and system information dis-
closure systems (OASIS) with the neutral
agency’s rules
- Fairness and transparency in the
scheme for rule monitoring
- Current situation of rule monitoring
- Implementation of load dispatching
communications
- Appropriateness and security of the
information disclosure
s
y
stems
(
OASIS
)
Table 16.5. Assessment of Individual Institutional Reforms
16.4.4.1 Electricity Rates
The wide gap between electricity rates in Japan and in foreign countries, which triggered the
structural reforms in the Japanese electric power industry, has narrowed compared with
before restructuring of this industry was started, as shown in Figure 16.8.
Ob
j
ectives Issues
Areas of Assessment
Items of Assessment
Supply
Reliability
Load dispatchin
g
control and sys-
tem management
-
Burden on load dis-
patchers
- Appropriateness of
ancillary services
-
Chan
g
es in electric power
companies’ load dispatching
control and system man-
agement activities following
institutional reforms
- Harmony between protec-
tion systems such as special
protection schemes and
short-circuit relays and new-
comers’ facilities
- Provision and operation of
ancillar
y
services
Safety and disas-
ter restoration
-
Chan
g
es in the fu
n
c-
tions of safety and
disaster prevention
s
y
stems
-
Response to safet
y
and dis-
aster restoration needs
Technology de-
velopment and
succession of
skills
-
Necessit
y
of devel-
opment of new tech-
nologies in the power
transmission and
distribution sector,
etc.
-
Implementation of technol-
ogy development projects in
response to institutional re-
forms
Environ-
mental
protection
Choice of power
sources
-
Orientation toward
a generation mix at-
taching importance to
economic efficiency
onl
y
-
Chan
g
es in the
g
eneration
mix and CO2 emissions in
the power sector
Development of
environment-
related technolo-
gies
-
Efforts toward envi-
ronmental develop-
ment that have no
direct contribution to
p
rofits
-
Investment in the devel-
opment of environment-
related technologies
Interco
n
nected
transmission line
-
Limitation of line
capacity
-
Construction of intercon-
nected lines
- Maintenance and operation
of interco
n
nected lines
Table 16.4. Assessment of the Macroscopic Policy Objectives (continuation)
16.4.4 Evaluation of Institutional Reforms in the Early Stage
Institutional reforms are now being systematically evaluated from the above mentioned
perspectives. This section evaluates the institutional reforms in their early stage based on
currently available data. Note that some factors, such as electricity rates, can be accurately
evaluated as the result of institutional reforms as sufficient time has passed since the early
stage of the reforms, while it may be too early to evaluate other factors such as the robust-
ness of transactions on the electric power exchange that were commenced in the third step
of the reforms.
Power Markets of Asian Countries in the International Markets Environment 623
Areas of Assessment
Items of Assessment
Wheelin
g
service sys-
tem
-
Elimination of pa
n
cake
rates and revitalization of
wide-area power transaction
- Functions of the new im-
balance charging system
-
Effects on wide-area transactions and
on JEPX trade
- Recovery of transmission line costs, an
appropriate cost reimbursement mechan-
ism, and restrictions on the siting of
power sources in remote places
- The incidence of imbalances and the
shouldering of charges
Activit
y
re
g
u-
lations
-
Securin
g
of fairness and
transparency in the trans-
mission/distribution seg-
ment through activity regu-
lations
(a) Information firewall
- Management of information related to
wheeling service, and formulation and
announcement of internal rules
(b) Prohibition of discriminatory treat-
ment
- A survey of cases of discriminatory
treatment in access to wheeling service
for specific power suppliers
(c) Prohibition of cross-subsidization
(keeping of different account books)
- Preparation and disclosure of docu-
ments needed to verify an income and
expenditure account statement and the
process of preparing the statement
Neutral
agency
-Securin
g
of fairness and
transparency in access to
power grids, construction of
facilities and disclosure of
information
-
Establishment of an or
g
anization and a
mechanism designed to achieve fairness,
transparency and neutrality
- Rule-making procedures securing fair-
ness, transparency and neutrality
- Consistency of load dispatching com-
munication and system information dis-
closure systems (OASIS) with the neutral
agency’s rules
- Fairness and transparency in the
scheme for rule monitoring
- Current situation of rule monitoring
- Implementation of load dispatching
communications
- Appropriateness and security of the
information disclosure
s
y
stems
(
OASIS
)
Table 16.5. Assessment of Individual Institutional Reforms
16.4.4.1 Electricity Rates
The wide gap between electricity rates in Japan and in foreign countries, which triggered the
structural reforms in the Japanese electric power industry, has narrowed compared with
before restructuring of this industry was started, as shown in Figure 16.8.
Ob
j
ectives Issues
Areas of Assessment
Items of Assessment
Supply
Reliability
Load dispatchin
g
control and sys-
tem management
-
Burden on load dis-
patchers
- Appropriateness of
ancillary services
-
Chan
g
es in electric power
companies’ load dispatching
control and system man-
agement activities following
institutional reforms
- Harmony between protec-
tion systems such as special
protection schemes and
short-circuit relays and new-
comers’ facilities
- Provision and operation of
ancillar
y
services
Safety and disas-
ter restoration
-
Chan
g
es in the fu
n
c-
tions of safety and
disaster prevention
s
y
stems
-
Response to safet
y
and dis-
aster restoration needs
Technology de-
velopment and
succession of
skills
-
Necessit
y
of devel-
opment of new tech-
nologies in the power
transmission and
distribution sector,
etc.
-
Implementation of technol-
ogy development projects in
response to institutional re-
forms
Environ-
mental
protection
Choice of power
sources
-
Orientation toward
a generation mix at-
taching importance to
economic efficiency
onl
y
-
Chan
g
es in the
g
eneration
mix and CO2 emissions in
the power sector
Development of
environment-
related technolo-
gies
-
Efforts toward envi-
ronmental develop-
ment that have no
direct contribution to
p
rofits
-
Investment in the devel-
opment of environment-
related technologies
Interco
n
nected
transmission line
-
Limitation of line
capacity
-
Construction of intercon-
nected lines
- Maintenance and operation
of interco
n
nected lines
Table 16.4. Assessment of the Macroscopic Policy Objectives (continuation)
16.4.4 Evaluation of Institutional Reforms in the Early Stage
Institutional reforms are now being systematically evaluated from the above mentioned
perspectives. This section evaluates the institutional reforms in their early stage based on
currently available data. Note that some factors, such as electricity rates, can be accurately
evaluated as the result of institutional reforms as sufficient time has passed since the early
stage of the reforms, while it may be too early to evaluate other factors such as the robust-
ness of transactions on the electric power exchange that were commenced in the third step
of the reforms.
Electricity Infrastructures in the Global Marketplace624
ly 17%. As the graph shows, residential charges, which are not liberalized, have declined to
sufficiently lower levels. In the liberalized segment, a simple comparison between electricity
rates in 2000 and in 2004 revealed a significant drop of nearly 26% in electricity rates for
commercial customers.
16.4.4.2 Situation of Newcomers
A look at newcomers (PPSs) in the liberalized sector shows that although their share is still
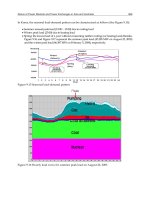
small at around 2%, PPSs have been steadily increasing their power sales (Figure 16.10).
PPSs’ shares vary according to electric power companies. In Tokyo Electric Power Compa-
ny’s service area, where the utility meets an immense demand for power, newcomers hold a
share of more than 5%, whereas PPSs account for no more than 1% in the service areas of
some local electric power companies.
Figure 16.10. Share of power producers and suppliers (PPSs)
16.4.4.3 The Japan Electric Power Exchange
The Japan Electric Power Exchange is still immature as it was opened only in April 2005. As
shown in Figure 16.11, over the five months following its opening, the exchange has had thin
trading and prices are relatively high in summer, but subsequently transactions have increased
gradually and prices have become steady. Reasons for this tendency include the emergence of
relatively large sellers, a rise in oil prices, and the suspension of large power sources.
At the time of the exchange’s opening, an outlook for trading volume was provided as
shown in Figure 16.12. The actual volume of transactions already surpassed the estimate for
the first year in mid November.
Challenges that the exchange must tackle in the years ahead include:
Measures to increase the trading volume: Increase in the number of exchange members,
such as in-house power generation facility owners.
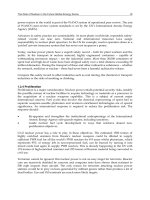
Figure 16.8. Comparison of electricity charge before and after the institutional reform
Figure 16.9. Changes in electricity rates over the past decade
Changes in electricity rates over the past decade are shown in Figure 16.9: electricity rates
dropped by 1.8% annually on average from fiscal 1994 to fiscal 2004 and a simple compari-
son between electricity rates in fiscal 1994 and in fiscal 2004 shows a decline of approximate-
residential ($/kWh)
electricit
y
rate (VkWh)
a
Power Markets of Asian Countries in the International Markets Environment 625
ly 17%. As the graph shows, residential charges, which are not liberalized, have declined to
sufficiently lower levels. In the liberalized segment, a simple comparison between electricity
rates in 2000 and in 2004 revealed a significant drop of nearly 26% in electricity rates for
commercial customers.
16.4.4.2 Situation of Newcomers
A look at newcomers (PPSs) in the liberalized sector shows that although their share is still
small at around 2%, PPSs have been steadily increasing their power sales (Figure 16.10).
PPSs’ shares vary according to electric power companies. In Tokyo Electric Power Compa-
ny’s service area, where the utility meets an immense demand for power, newcomers hold a
share of more than 5%, whereas PPSs account for no more than 1% in the service areas of
some local electric power companies.
Figure 16.10. Share of power producers and suppliers (PPSs)
16.4.4.3 The Japan Electric Power Exchange
The Japan Electric Power Exchange is still immature as it was opened only in April 2005. As
shown in Figure 16.11, over the five months following its opening, the exchange has had thin
trading and prices are relatively high in summer, but subsequently transactions have increased
gradually and prices have become steady. Reasons for this tendency include the emergence of
relatively large sellers, a rise in oil prices, and the suspension of large power sources.
At the time of the exchange’s opening, an outlook for trading volume was provided as
shown in Figure 16.12. The actual volume of transactions already surpassed the estimate for
the first year in mid November.
Challenges that the exchange must tackle in the years ahead include:
Measures to increase the trading volume: Increase in the number of exchange members,
such as in-house power generation facility owners.
Figure 16.8. Comparison of electricity charge before and after the institutional reform
Figure 16.9. Changes in electricity rates over the past decade
Changes in electricity rates over the past decade are shown in Figure 16.9: electricity rates
dropped by 1.8% annually on average from fiscal 1994 to fiscal 2004 and a simple compari-
son between electricity rates in fiscal 1994 and in fiscal 2004 shows a decline of approximate-
residential ($/kWh)
electricit
y
rate (VkWh)
a
Electricity Infrastructures in the Global Marketplace626
12000
5300
1470
64300
551
0
27500
33060
5930
17060
6000
300
5570
16660
2400
1400
5570
A
TC (MW)
Peak demand
(
2001
)
(
MW
)
0
100
2700
370
950
1410
20
200
580
0
420
330
770
1930
1230
850
0
0
1200
3000
Figure 16.13. ATC of the interconnected line (from 2005 to 2014)
The frequency and duration of transmission line congestion are shown in Table 16.6.
Congestion occurs several times a month. In September and October 2005, transmission
congestion occurred due to a decrease in the counter power flow (a power flow in the
opposite direction) resulting from the extended period of repairs on large power sources.
The ESCJ has undertaken a technical study on ways of managing interconnected transmis-
sion lines, including reinforcements.
Month
Frequency Duration
Planned Emergency Planned Emergency
April 0 1 0 10.82 h
May 1 0 130 h 0
June 4 2 90 h 26.5 h
July 3 3 123.5 h 56.97 h
August 1 1 80 h 744 h
September 20 2 660 h 257 h
October 31 0 824 h 0
November 3 1 123.5h 39.6h
Table 16.6. Congestion of Interconnected Lines (2005)
Introduction of new commodities meeting needs: Introduction of short-term forward deli-
very contracts.
yy/mm/dd
Figure 16.11. Price and traded energy in day-ahead market of JEPX
16.4.4.4 ATC and Transmission Line Congestion
Available transmission capacity (ATC) for the next ten years in Japan is shown in Figure
16.13 [22]. In Japan, due to the geographical conditions and historical background, intercon-
nections between electric power companies are loosely connected and transmission conges-
tion poses a problem in domestic interconnected lines. ATC is therefore presented for each
interconnected line.
Figure 16.12. Prospect of trading volume (at the opening time of JEPX)
traded ener
gy
s
p
ot
p
rice
(
en
/
kWh
)
traded ener
gy
05/4/1
05/4/16
05/5/1
05/5/16
05/5/31
05/6/15
05/7/15
05/7/30
05/8/14
05/8/29
05/9/13
05/9/28
05/10/13
05/10/28
05/11/12
05/11/27
05/12/12
Power Markets of Asian Countries in the International Markets Environment 627
12000
5300
1470
64300
551
0
27500
33060
5930
17060
6000
300
5570
16660
2400
1400
5570
A
TC (MW)
Peak demand
(
2001
)
(
MW
)
0
100
2700
370
950
1410
20
200
580
0
420
330
770
1930
1230
850
0
0
1200
3000
Figure 16.13. ATC of the interconnected line (from 2005 to 2014)
The frequency and duration of transmission line congestion are shown in Table 16.6.
Congestion occurs several times a month. In September and October 2005, transmission
congestion occurred due to a decrease in the counter power flow (a power flow in the
opposite direction) resulting from the extended period of repairs on large power sources.
The ESCJ has undertaken a technical study on ways of managing interconnected transmis-
sion lines, including reinforcements.
Month
Frequency Duration
Planned Emergency Planned Emergency
April 0 1 0 10.82 h
May 1 0 130 h 0
June 4 2 90 h 26.5 h
July 3 3 123.5 h 56.97 h
August 1 1 80 h 744 h
September 20 2 660 h 257 h
October 31 0 824 h 0
November 3 1 123.5h 39.6h
Table 16.6. Congestion of Interconnected Lines (2005)
Introduction of new commodities meeting needs: Introduction of short-term forward deli-
very contracts.
yy/mm/dd
Figure 16.11. Price and traded energy in day-ahead market of JEPX
16.4.4.4 ATC and Transmission Line Congestion
Available transmission capacity (ATC) for the next ten years in Japan is shown in Figure
16.13 [22]. In Japan, due to the geographical conditions and historical background, intercon-
nections between electric power companies are loosely connected and transmission conges-
tion poses a problem in domestic interconnected lines. ATC is therefore presented for each
interconnected line.
Figure 16.12. Prospect of trading volume (at the opening time of JEPX)
traded ener
gy
s
p
ot
p
rice
(
en
/
kWh
)
traded ener
gy
05/4/1
05/4/16
05/5/1
05/5/16
05/5/31
05/6/15
05/7/15
05/7/30
05/8/14
05/8/29
05/9/13
05/9/28
05/10/13
05/10/28
05/11/12
05/11/27
05/12/12
Electricity Infrastructures in the Global Marketplace628
Thus, this Section has outlined the institutional reforms in the Japanese electric power in-
dustry and an assessment of the reforms already made. The structural reform of the Japa-
nese electric power industry is characterized by a step-by-step approach as well as by re-
forms being implemented within the framework of electric power companies’ vertically in-
tegrated power generation and transmission structure. Although it is still premature to
draw conclusions about the results of the structural reforms, electricity rates have dropped
and the differential between electricity rates at home and abroad has narrowed considera-
bly. A national-level assessment of the institutional reforms was made and the results were
produced in the summer of 2006. Based on these results, discussion has commenced in order
to establish a Japanese-style electricity liberalization system.
16.5 Pricing for Transmission Services in Korean Electricity Market
In Korea, the trend of heavier real power flows into densely populated load centers from
several vast power plants in remote locations will continue or become profound, leading to
their national-interest in transmission bottlenecks during some periods of the year. The first
step toward increasing the role of market forces in managing transmission system opera-
tions is to develop the role of location price signals to direct the actions of market partici-
pants toward outcomes that improve operations when congestion occurs on the bulk power
grid. In this overall perspective, we need to thoroughly investigate how best it would be to
send an adequately accurate location price signal with the congestion costs incorporated
into the transmission pricing rule when the electricity market is not unduly maintained. This
Section attempts to make a supportive and self-explanatory proposal that it could fit the
Korean Cost-Based Pool (CBP) that satisfactorily sharpens the location price signal.
16.5.1 General Characteristics
16.5.1.1 The Evolution of Competition in Korean Electricity Industry
It used to be assumed that electricity generation, transmission, distribution and supply en-
joyed significant vertical economies that would be lost if the functions were placed under
the control of different companies. Such long-held belief made it possible that the Korea
Electric Power Corporation (KEPCO) had monopoly power – supported by legal protection.
Since the 1997 financial crisis, economic policy in Korea has aimed to remove barriers to
trade and competition. Network industries like electricity and natural gas, which were his-
torically sheltered from competition and operated within national or regional boundaries,
have experienced radical change as a consequence. National pressure to liberalize electricity
markets reflected the perceived benefits of introducing market forces into the electricity in-
dustry previously viewed as a natural monopoly with substantial vertical economies. In the
meantime, the generation sector was split into six subsidiaries that will be privatized. Still,
the KEPCO is being engaged in monopolistic business activities of the transmission and
distribution systems alike. In an attempt to help mitigate potential negative prospects about
which the hasty reform drive could bring, a new transitional electricity market, dubbed
‘Cost-Based Pool (CBP)’, was set up in 2001.
16.4.4.5 Adequacy of Generation Capacity
One of the ESCJ’s functions is to assess reliability of the power system. An assessment of the
adequacy of generation capacity is given in Table 16.7. The adequacy of power sources is
expected to be maintained at an appropriate level for the next ten years or so.
Demand/Supply Balance
2009 (August) 2014 (August)
Peak demand 18,200 19,246
Planned capacity 19,838 21,268
Reserve ratio 1.09 1.11
Table 16.7. Prospect of Generation Adequacy
16.4.4.6 Capital Investment by Electric Power Companies
Capital investment by electric power companies has fallen sharply over the past several
years as shown in Figure 16.14. This decline has occurred partly because demand growth
has slowed down as shown in the Figure and partly because electric power companies have
virtually completed their bulk power transmission systems through investments made over
the years. In fact, reductions in capital spending have released financial resources that have
allowed the electric utilities to lower electricity rates.
Figure 16.14. Trend of capital investment in utilities
The population of Japan began to decline in 2005, much earlier than expected, and so electric
power demand cannot be expected to increase significantly in future. Still, the facilities that
were constructed during the growth period will have to be renewed by around 2010. How
the facilities should be managed within the context of electricity deregulation is an
important question that remains to be answered.
ca
p
ital investment
estimated of
p
eak demand in-
Power Markets of Asian Countries in the International Markets Environment 629
Thus, this Section has outlined the institutional reforms in the Japanese electric power in-
dustry and an assessment of the reforms already made. The structural reform of the Japa-
nese electric power industry is characterized by a step-by-step approach as well as by re-
forms being implemented within the framework of electric power companies’ vertically in-
tegrated power generation and transmission structure. Although it is still premature to
draw conclusions about the results of the structural reforms, electricity rates have dropped
and the differential between electricity rates at home and abroad has narrowed considera-
bly. A national-level assessment of the institutional reforms was made and the results were
produced in the summer of 2006. Based on these results, discussion has commenced in order
to establish a Japanese-style electricity liberalization system.
16.5 Pricing for Transmission Services in Korean Electricity Market
In Korea, the trend of heavier real power flows into densely populated load centers from
several vast power plants in remote locations will continue or become profound, leading to
their national-interest in transmission bottlenecks during some periods of the year. The first
step toward increasing the role of market forces in managing transmission system opera-
tions is to develop the role of location price signals to direct the actions of market partici-
pants toward outcomes that improve operations when congestion occurs on the bulk power
grid. In this overall perspective, we need to thoroughly investigate how best it would be to
send an adequately accurate location price signal with the congestion costs incorporated
into the transmission pricing rule when the electricity market is not unduly maintained. This
Section attempts to make a supportive and self-explanatory proposal that it could fit the
Korean Cost-Based Pool (CBP) that satisfactorily sharpens the location price signal.
16.5.1 General Characteristics
16.5.1.1 The Evolution of Competition in Korean Electricity Industry
It used to be assumed that electricity generation, transmission, distribution and supply en-
joyed significant vertical economies that would be lost if the functions were placed under
the control of different companies. Such long-held belief made it possible that the Korea
Electric Power Corporation (KEPCO) had monopoly power – supported by legal protection.
Since the 1997 financial crisis, economic policy in Korea has aimed to remove barriers to
trade and competition. Network industries like electricity and natural gas, which were his-
torically sheltered from competition and operated within national or regional boundaries,
have experienced radical change as a consequence. National pressure to liberalize electricity
markets reflected the perceived benefits of introducing market forces into the electricity in-
dustry previously viewed as a natural monopoly with substantial vertical economies. In the
meantime, the generation sector was split into six subsidiaries that will be privatized. Still,
the KEPCO is being engaged in monopolistic business activities of the transmission and
distribution systems alike. In an attempt to help mitigate potential negative prospects about
which the hasty reform drive could bring, a new transitional electricity market, dubbed
‘Cost-Based Pool (CBP)’, was set up in 2001.
16.4.4.5 Adequacy of Generation Capacity
One of the ESCJ’s functions is to assess reliability of the power system. An assessment of the
adequacy of generation capacity is given in Table 16.7. The adequacy of power sources is
expected to be maintained at an appropriate level for the next ten years or so.
Demand/Supply Balance
2009 (August) 2014 (August)
Peak demand 18,200 19,246
Planned capacity 19,838 21,268
Reserve ratio 1.09 1.11
Table 16.7. Prospect of Generation Adequacy
16.4.4.6 Capital Investment by Electric Power Companies
Capital investment by electric power companies has fallen sharply over the past several
years as shown in Figure 16.14. This decline has occurred partly because demand growth
has slowed down as shown in the Figure and partly because electric power companies have
virtually completed their bulk power transmission systems through investments made over
the years. In fact, reductions in capital spending have released financial resources that have
allowed the electric utilities to lower electricity rates.
Figure 16.14. Trend of capital investment in utilities
The population of Japan began to decline in 2005, much earlier than expected, and so electric
power demand cannot be expected to increase significantly in future. Still, the facilities that
were constructed during the growth period will have to be renewed by around 2010. How
the facilities should be managed within the context of electricity deregulation is an
important question that remains to be answered.
ca
p
ital investment
estimated of
p
eak demand in-
Electricity Infrastructures in the Global Marketplace630
Transmission
usage charge
Common
components
Locational
components
Connection assets
Connection assets
Access
charge
Figure 16.15. The basic structure of Korean transmission pricing
Access charge: All the market participants who would likely use the transmission system
should pay the charge for the connection assets that directly interconnect them with the
substation. As is well known, a ‘deep’ basis is better rather than a ‘shallow’ basis in case of
the access charge. From a practical standpoint, the CBP comes to have a clear preference for
a “shallow” basis since it is a relatively good tool for elaborating the stringent criteria.
Transmission usage charge: The electricity passing the connection assets is transmitted from
generators to loads through the core of transmission system. Two components, i.e. the loca-
tion and the common service components, are included hereof. In principle, the common
component is made up of facilities related to the reactive power, non-operational land hold-
ings, communication equipment, whereas the location component encompasses transmis-
sion lines and circuit breakers, etc. In the CBP of Korea, postage-stamp rate method is tradi-
tionally used for the common component, while the power tracing method associated with
the location component is poised to give a location price signal to the participants. In Figure
16.16, the transmission charges in the CBP are represented for better understanding.
16.5.2.2 Power Tracing Method
The gist of the tracing method is to evaluate the contribution of transmission users to trans-
mission usage of location components. This method may be employed to determine which
generators are supplying corresponding loads, how much use each load is making of specif-
ic transmission lines and what are the annual costs of individual network elements to be
recovered.
Especially, the cost of substation with which several branches are connected is actually di-
vided into each line. In this method, more detailed load flow analysis of the system and its
operation at the peak time are usually required to allocate the estimated annual costs of
network elements to all the participants who use them. In an early stage, the fault current
based power tracing method in the Victoria pool was scrutinized, but at this time, the me-
thodology set forth by Felix Wu is in popular use [26].
16.5.1.2 The Distinctive Feature of CBP
The characteristics of the Korean CBP market can be briefly summarized as follows:
The Korea Electric Power Corporation (KEPCO) is the single purchaser. Exceptionally,
large consumers (above 50MVA) and district electricity businesses can either buy elec-
tricity directly from the Pool or KEPCO.
The generators added at peak load are given the short-term marginal price (SMP) and
the capacity payment, 7.17 won/kW as the fixed cost, while the base-load power plants
receive both the base-load marginal price (BLMP) and the capacity payment, 21.49
won/kW as the fixed cost. When the CBP was first designed, greater portions of the
windfall profits from the high SMP for each generation company were envisaged be-
cause of the shortage of base generation capacity. Thus, the so-called BLMP was
adopted to evade the excessive revenues of the base-load generators.
As such, there is no location price signal. If the generators inevitably change their output
due to the congestion, they have been paid the uplift to make up for their generation cost.
The generation cost is a priori known by the committee’s actual test. Individual genera-
tion companies offer their available capacities alone, not prices. Then the Korea Power
Exchange (KPX) performs economic dispatch based on the generation fuel costs.
Indeed, the transmission price seems to be nominal in that it is published every year but
not really applied to the market participants. In the CBP, the KEPCO collects the elec-
tricity price from the customers on a regulated tariff and provides the variable costs
(SMP and BLMP) plus the capacity payment for the generation companies.
Originally, the futuristic model, namely Two Way Bidding Pool (TWBP) in which the market-
clearing price would be determined from the bids of customers and the offers of generation
companies in the unconstrained dispatch, was supposed to commence in 2004 in order to
overcome the shortcomings of the current CBP. However, the government halted it and ac-
cordingly the CBP is expected to continue for the time being.
16.5.2 Pricing for Transmission Services under the Cost-Based Pool
Now, the main drawback in the CBP is an essential absence of the location price signal.
Though either nodal pricing that recognizes different prices at every location or zonal pric-
ing that creates administrative aggregations to reallocate costs is a nearly dominant answer
to the prospective price signal in energy markets [23,24], it would be really time-consuming
to rectify the current uniform pricing regime and, at the same time, redesign the market in
terms of future network infrastructure costs. The access charge such as license plate or post-
age-stamp method is widely accepted to meet revenue expectations. In some European elec-
tricity markets, the power tracing method has been introduced for full cost recovery and
location price signal [25].
16.5.2.1 The Basic Structure of Pricing for Transmission Services
In general, the overall equipments of transmission system are grouped into connection as-
sets, common and location components, respectively. The pricing for transmission services
in the CBP mainly consists of the access charge and the transmission usage charge as seen in
Figure 16.15.
Power Markets of Asian Countries in the International Markets Environment 631
Transmission
usage charge
Common
components
Locational
components
Connection assets
Connection assets
Access
charge
Figure 16.15. The basic structure of Korean transmission pricing
Access charge: All the market participants who would likely use the transmission system
should pay the charge for the connection assets that directly interconnect them with the
substation. As is well known, a ‘deep’ basis is better rather than a ‘shallow’ basis in case of
the access charge. From a practical standpoint, the CBP comes to have a clear preference for
a “shallow” basis since it is a relatively good tool for elaborating the stringent criteria.
Transmission usage charge: The electricity passing the connection assets is transmitted from
generators to loads through the core of transmission system. Two components, i.e. the loca-
tion and the common service components, are included hereof. In principle, the common
component is made up of facilities related to the reactive power, non-operational land hold-
ings, communication equipment, whereas the location component encompasses transmis-
sion lines and circuit breakers, etc. In the CBP of Korea, postage-stamp rate method is tradi-
tionally used for the common component, while the power tracing method associated with
the location component is poised to give a location price signal to the participants. In Figure
16.16, the transmission charges in the CBP are represented for better understanding.
16.5.2.2 Power Tracing Method
The gist of the tracing method is to evaluate the contribution of transmission users to trans-
mission usage of location components. This method may be employed to determine which
generators are supplying corresponding loads, how much use each load is making of specif-
ic transmission lines and what are the annual costs of individual network elements to be
recovered.
Especially, the cost of substation with which several branches are connected is actually di-
vided into each line. In this method, more detailed load flow analysis of the system and its
operation at the peak time are usually required to allocate the estimated annual costs of
network elements to all the participants who use them. In an early stage, the fault current
based power tracing method in the Victoria pool was scrutinized, but at this time, the me-
thodology set forth by Felix Wu is in popular use [26].
16.5.1.2 The Distinctive Feature of CBP
The characteristics of the Korean CBP market can be briefly summarized as follows:
The Korea Electric Power Corporation (KEPCO) is the single purchaser. Exceptionally,
large consumers (above 50MVA) and district electricity businesses can either buy elec-
tricity directly from the Pool or KEPCO.
The generators added at peak load are given the short-term marginal price (SMP) and
the capacity payment, 7.17 won/kW as the fixed cost, while the base-load power plants
receive both the base-load marginal price (BLMP) and the capacity payment, 21.49
won/kW as the fixed cost. When the CBP was first designed, greater portions of the
windfall profits from the high SMP for each generation company were envisaged be-
cause of the shortage of base generation capacity. Thus, the so-called BLMP was
adopted to evade the excessive revenues of the base-load generators.
As such, there is no location price signal. If the generators inevitably change their output
due to the congestion, they have been paid the uplift to make up for their generation cost.
The generation cost is a priori known by the committee’s actual test. Individual genera-
tion companies offer their available capacities alone, not prices. Then the Korea Power
Exchange (KPX) performs economic dispatch based on the generation fuel costs.
Indeed, the transmission price seems to be nominal in that it is published every year but
not really applied to the market participants. In the CBP, the KEPCO collects the elec-
tricity price from the customers on a regulated tariff and provides the variable costs
(SMP and BLMP) plus the capacity payment for the generation companies.
Originally, the futuristic model, namely Two Way Bidding Pool (TWBP) in which the market-
clearing price would be determined from the bids of customers and the offers of generation
companies in the unconstrained dispatch, was supposed to commence in 2004 in order to
overcome the shortcomings of the current CBP. However, the government halted it and ac-
cordingly the CBP is expected to continue for the time being.
16.5.2 Pricing for Transmission Services under the Cost-Based Pool
Now, the main drawback in the CBP is an essential absence of the location price signal.
Though either nodal pricing that recognizes different prices at every location or zonal pric-
ing that creates administrative aggregations to reallocate costs is a nearly dominant answer
to the prospective price signal in energy markets [23,24], it would be really time-consuming
to rectify the current uniform pricing regime and, at the same time, redesign the market in
terms of future network infrastructure costs. The access charge such as license plate or post-
age-stamp method is widely accepted to meet revenue expectations. In some European elec-
tricity markets, the power tracing method has been introduced for full cost recovery and
location price signal [25].
16.5.2.1 The Basic Structure of Pricing for Transmission Services
In general, the overall equipments of transmission system are grouped into connection as-
sets, common and location components, respectively. The pricing for transmission services
in the CBP mainly consists of the access charge and the transmission usage charge as seen in
Figure 16.15.
Electricity Infrastructures in the Global Marketplace632
5) The zonal price, or a weighted average of the node price against the corresponding load-
demand within the same zone, is derived.
16.5.3 Case Study
Data from Korea electric power system is used to calculate transmission prices. Figure 16.18
is a schematic showing locations of major generation and transmission facilities in the Korea
electric power system. From the geographical point of view, the system can be characterized
in the following [27]
Island system
Concentration of load demand in the metropolitan region
Location of major generation plants in non-metropolitan regions
Environmental concerns and restrictions on regional transmission siting.
Figure 16.18. Schematic of major transmission facilities in Korean electric power system
Metropolitan Region
Requirement revenue
(100 %)
Generation
(50 %)
Load
(50 %)
Usage price
(25 %)
Basic price
(25%)
Usage price
(25%)
Basic price
(25%)
Locational Difference
(power trace method) [won/kWh]
Postage stamp method
[won/kW/mo.]
Figure 16.16. Illustration of transmission charges in the CBP
Figure 16.17. Procedure of usage price calculation
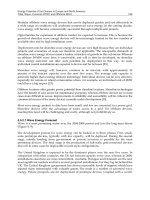
A natural implementation of the proposed algorithm is described in the following proce-
dures (see Figure 16.17):
1) Choose 5 reference points when each load reaches 100, 90, 80, 70 and 60 % of peak load.
2) The power tracing method is applied for 5-averaged load-demand and generation level at
buses, allowing for a whole set of 5 reference points.
3) The cost of each transmission line is calculated using equipment replacement cost which
deals with what it will cost to replace the piece of equipment in the future and then converts
the future cost into today's pricing.
4) All 5-transmission prices as to each bus are created from a pair of the averaged demand
and supply at the respective reference points. A weighted average of 5 transmission prices
against the elapsed time is equal to the final transmission price at each bus.
Power Markets of Asian Countries in the International Markets Environment 633
5) The zonal price, or a weighted average of the node price against the corresponding load-
demand within the same zone, is derived.
16.5.3 Case Study
Data from Korea electric power system is used to calculate transmission prices. Figure 16.18
is a schematic showing locations of major generation and transmission facilities in the Korea
electric power system. From the geographical point of view, the system can be characterized
in the following [27]
Island system
Concentration of load demand in the metropolitan region
Location of major generation plants in non-metropolitan regions
Environmental concerns and restrictions on regional transmission siting.
Figure 16.18. Schematic of major transmission facilities in Korean electric power system
Metropolitan Region
Requirement revenue
(100 %)
Generation
(50 %)
Load
(50 %)
Usage price
(25 %)
Basic price
(25%)
Usage price
(25%)
Basic price
(25%)
Locational Difference
(power trace method) [won/kWh]
Postage stamp method
[won/kW/mo.]
Figure 16.16. Illustration of transmission charges in the CBP
Figure 16.17. Procedure of usage price calculation
A natural implementation of the proposed algorithm is described in the following proce-
dures (see Figure 16.17):
1) Choose 5 reference points when each load reaches 100, 90, 80, 70 and 60 % of peak load.
2) The power tracing method is applied for 5-averaged load-demand and generation level at
buses, allowing for a whole set of 5 reference points.
3) The cost of each transmission line is calculated using equipment replacement cost which
deals with what it will cost to replace the piece of equipment in the future and then converts
the future cost into today's pricing.
4) All 5-transmission prices as to each bus are created from a pair of the averaged demand
and supply at the respective reference points. A weighted average of 5 transmission prices
against the elapsed time is equal to the final transmission price at each bus.
Electricity Infrastructures in the Global Marketplace634
charges as it is. Conversely, a group of independent power producers with the power
plants in course of construction is installing the connection assets as long as their
budget allows. That is, new entrants are being outright discriminated from the old
ones in the CBP model.
It is even difficult for the existing generation companies to be imposed on the access
charge in the CBP environment. That is why the market should reward those compa-
nies with the SMP, CP and infinitesimal reserve-related charge which are earmarked
according to the generation fuel costs and installed generation capacity, and hence they
can afford no extra payments for access charges, let alone the transmission prices. This
critical defect is fairly associated with not only the access charges but also the trans-
mission pricing in itself.
For some generation companies, they are linked with the common components via the
transmission line whose voltage might be as high as 765 kV. Those companies are fac-
ing a heavy burden with the enforcement of the capacity investments of the past.
Today and increasingly in the future, some parts of connection lines may be constructed
across quite long-distance routes so as to be utilized for the common components.
16.5.4.2 Transmission Usage Charge
In relation to the transmission usage charge, the following questions can arise:
Further work will be needed since the allocation rules, with rating the shares of the
generation companies and load entities or common and location components at fifty-
fifty, are totally unconvincing forceful standards.
In fact, the extent or systematic methodology of yielding location price signal should
be discussed in a meticulous way and it should ultimately have a bearing on the ener-
gy market. But neither the CBP energy market nor capacity price provides location
price signals between two areas. Therefore the pricing for transmission services to pro-
vide different location price signals between two areas is necessary.
The appropriateness or usefulness of the power tracing method will be analyzed in
detail.
The states of power systems are subject to change, relying solely on the planned mainten-
ance overhauls for generating units, new entry of power plants and the configuration of the
infrastructure. Nonetheless, the ongoing method does not capture the changes of conditions
in power systems, with the transmission price through the year fixed at a single value. It
needs to be identified how much impact each of the factors have on the transmission price
so that the transmission pricing should be able to enhance fairness and efficiency.
Thus, in the face of much complication, the Korean government has been committed to
putting the final touches on the public services in the electricity industry, reiterating its wil-
lingness to go ahead with the policy. The fruit of these incessant efforts has proved bitter as
yet. In these staggering surroundings, it is a brilliant future task to see the inherent limita-
tions of the current Cost-Based Pool and find fundamental solutions without delay. To be
sure, it will be allowed with the nation’s consent if there are attractive alternatives to the
aforementioned tantalizing problems. Apparently, the transmission pricing should be a rea-
sonable economic indicator used by the market to make decisions on resource allocation,
system expansion and reinforcement [28].
The transmission price calculation algorithm used in NETA and Ireland is applied to the
Korea electric power system for comparison with CBP method. In the results of simulations,
it shows that the methods of NETA and Ireland provide stronger location signal than the
CBP’s. In Figure 16.19, the left side of the horizontal axis indicates the nodes of metropolitan
region and the right side indicates the nodes of non-metropolitan region. While there are
negative prices in the metropolitan region for the methods of NETA and Ireland, there are
all positive prices in the CBP’s method.
Even though providing location price signals is an important role of pricing transmission
services, it is undesirable that these methods should be applied to the Korean pool model.
The reasons are as follows:
The energy markets of NETA and Ireland is run by contracts without location price
signals.
Most of the electric power markets include capacity market or capacity payment. In
CBP, capacity payment is paid to all generators who submit capacity offers. For exam-
ple, lower efficient generators in the metropolitan region make an additional profit on
negative transmission price.
Figure 16.19. Comparison with transmission price calculation algorithms
16.5.4 The Challenges from Pricing Transmission Services in the Cost-Based Pool
16.5.4.1 Access Charge
Though it is clearly stated that the already established generation companies in the
CBP should take the responsibility for the access charges, they do not pay for these
Power Markets of Asian Countries in the International Markets Environment 635
charges as it is. Conversely, a group of independent power producers with the power
plants in course of construction is installing the connection assets as long as their
budget allows. That is, new entrants are being outright discriminated from the old
ones in the CBP model.
It is even difficult for the existing generation companies to be imposed on the access
charge in the CBP environment. That is why the market should reward those compa-
nies with the SMP, CP and infinitesimal reserve-related charge which are earmarked
according to the generation fuel costs and installed generation capacity, and hence they
can afford no extra payments for access charges, let alone the transmission prices. This
critical defect is fairly associated with not only the access charges but also the trans-
mission pricing in itself.
For some generation companies, they are linked with the common components via the
transmission line whose voltage might be as high as 765 kV. Those companies are fac-
ing a heavy burden with the enforcement of the capacity investments of the past.
Today and increasingly in the future, some parts of connection lines may be constructed
across quite long-distance routes so as to be utilized for the common components.
16.5.4.2 Transmission Usage Charge
In relation to the transmission usage charge, the following questions can arise:
Further work will be needed since the allocation rules, with rating the shares of the
generation companies and load entities or common and location components at fifty-
fifty, are totally unconvincing forceful standards.
In fact, the extent or systematic methodology of yielding location price signal should
be discussed in a meticulous way and it should ultimately have a bearing on the ener-
gy market. But neither the CBP energy market nor capacity price provides location
price signals between two areas. Therefore the pricing for transmission services to pro-
vide different location price signals between two areas is necessary.
The appropriateness or usefulness of the power tracing method will be analyzed in
detail.
The states of power systems are subject to change, relying solely on the planned mainten-
ance overhauls for generating units, new entry of power plants and the configuration of the
infrastructure. Nonetheless, the ongoing method does not capture the changes of conditions
in power systems, with the transmission price through the year fixed at a single value. It
needs to be identified how much impact each of the factors have on the transmission price
so that the transmission pricing should be able to enhance fairness and efficiency.
Thus, in the face of much complication, the Korean government has been committed to
putting the final touches on the public services in the electricity industry, reiterating its wil-
lingness to go ahead with the policy. The fruit of these incessant efforts has proved bitter as
yet. In these staggering surroundings, it is a brilliant future task to see the inherent limita-
tions of the current Cost-Based Pool and find fundamental solutions without delay. To be
sure, it will be allowed with the nation’s consent if there are attractive alternatives to the
aforementioned tantalizing problems. Apparently, the transmission pricing should be a rea-
sonable economic indicator used by the market to make decisions on resource allocation,
system expansion and reinforcement [28].
The transmission price calculation algorithm used in NETA and Ireland is applied to the
Korea electric power system for comparison with CBP method. In the results of simulations,
it shows that the methods of NETA and Ireland provide stronger location signal than the
CBP’s. In Figure 16.19, the left side of the horizontal axis indicates the nodes of metropolitan
region and the right side indicates the nodes of non-metropolitan region. While there are
negative prices in the metropolitan region for the methods of NETA and Ireland, there are
all positive prices in the CBP’s method.
Even though providing location price signals is an important role of pricing transmission
services, it is undesirable that these methods should be applied to the Korean pool model.
The reasons are as follows:
The energy markets of NETA and Ireland is run by contracts without location price
signals.
Most of the electric power markets include capacity market or capacity payment. In
CBP, capacity payment is paid to all generators who submit capacity offers. For exam-
ple, lower efficient generators in the metropolitan region make an additional profit on
negative transmission price.
Figure 16.19. Comparison with transmission price calculation algorithms
16.5.4 The Challenges from Pricing Transmission Services in the Cost-Based Pool
16.5.4.1 Access Charge
Though it is clearly stated that the already established generation companies in the
CBP should take the responsibility for the access charges, they do not pay for these
Electricity Infrastructures in the Global Marketplace636
It provides exclusive rights for a single transmission and dispatch company to purchase all
electricity from generators and then sell it to distributors [30].
The single-buyer model became popular in the CIS countries and elsewhere because of
technical, economic, and institutional reasons. These include:
● Balancing of electricity input and output is facilitated by a single dispatch method in
real-time.
● The “contract path” problem is avoided.
● The single-buyer model is usually responsive to the sector Ministry in the areas of gen-
eration capacity investment and state-owned company’s financial affairs. The most in-
fluential stakeholders favor this.
● Price regulation is simplified, maintaining a unified wholesale price.
● The single-buyer model is favored by politicians who do not agree with a complete
withdrawal of the state from wholesale electricity trading.
There is evidence, however, that it is more efficacious to adopt a market model that has mul-
tiple buyers formed immediately after unbundling, in areas such as the CIS. The single-
buyer model is criticized because it tends to place generation capacity expansion decisions
in government officials’ hands, which do not assume the financial consequences. This model
also makes the state ultimately responsible for poor power purchase agreements that cannot
be honored. This is regularly part of the contract agreement. This model also does not re-
spond well to reductions in electricity demand. Wholesale electricity prices will rise in re-
sponse to demand reduction because of fixed capacity charges, which must be applied to a
reduced volume of electricity purchases. Another drawback is the under-development of
cross-border power trade. This is because the state-owned single-buyer has very little profit
motive. This can cause long-term problems when a neighboring country or region develops
a more liberalized power market model. Incentives for distributors to collect payments from
customers are also reduced. Again, politically unpopular decisions are difficult for a state-
owned entity. This is important because in the single-buyer model, delinquent payments
from distributors are assumed by the aggregated cash proceeds of the single-buyer. Paying
and non-paying distributors are treated basically the same, weakening the resolve of dis-
tributors to enhance the collection of payments. Another political intervention in this model
has been experienced in the Ukraine and Poland. In these countries, groups have lobbied on
behalf of coal miners to provide special treatment for coal-fired power plants. Interestingly,
because of the political advantages of the single-buyer model, some governments have sig-
nificantly delayed the next “phase” of fully liberalized markets [30].
The CIS has experienced advances in the privatization of the power sector. For example,
Armenia, Azerbaijan, Georgia, Kazakhstan, Moldova and the Ukraine have either contracted
the management of electric companies, or sold generation companies and distribution elec-
tric grids. Modernization through the construction of energy facilities has been facilitated by
the creation of a legal basis. This has attracted direct investments in improvement projects
from internal and external sources. For example, Armenia, Azerbaijan, Georgia, Kyrgyzstan,
Tajikistan and Uzbekistan have received investments in projects ranging from hydro power
plants, steam gas turbine units to electricity grid restoration [29].
16.6 Economic Convergence Points of Russian, CIS and Asian Power Markets
The convergence of Asian power markets crosses political and geographical boundaries.
This Section provides an analysis of the technical and economic commonalities involved.
The two primary goals of power sector reforms have been liberalization and the establish-
ment of a competitive power market.
This Section discusses the fundamentals of cooperation, and the primary goals of power
sector reforms. The main reform priorities and primary strategic areas are discussed in the
context of the developing power market in Russia. Also the Section makes the point that
despite the large geographical area, and economic disparity of Asian countries, there are
commonalities to be considered in power sector reform. Each country should create a reform
methodology in a national and regional conceptualization.
It is explained that there are five common steps on which this can be based. Additionally,
when determining the correct model to apply to an economy to bring about the desired effi-
ciencies, it is important to consider 13 transitional issues.
16.6.1 Economic Analysis of Russian and CIS Power Sector
Interconnections and Markets
The Commonwealth of Independent States
(CIS) power sector has been characterized by
cooperation, liberalization, privatization, investment, and cross border integration of elec-
tricity markets [29]. The fundamentals of cooperation have been stated in the CIS agreement
entitled “On coordination of interstate relations in the field of electricity of the Common-
wealth of Independent States” signed in February 1992. Arising from this agreement, coop-
eration has been implemented in the areas of structural reforms, power system integration,
legislation and price liberalization. This is in response to serious power sector problems ex-
perienced by CIS countries in financial, technical, operational, and investment areas. As a
group, the CIS countries faced additional crises because of the 12 members, only four; Azer-
baijan, Kazakhstan, Russia, and Turkmenistan have enough fuel and energy resources to
cover internal demand.
The primary goals of power sector reforms in the CIS have been liberalization and the estab-
lishment of a competitive power market. This has been conceived, since 1996, as a complex
process, based upon relevant technological, structural and legislative foundations [29].
Many of the CIS countries have phased-in the process of power sector reforms. These re-
forms have followed previous global experiences by de-integrating vertically integrated
monopolies into distinct distribution, transmission, and generation companies. This has
established the foundational single-buyer model of market reform, in preparation for more
liberalization. The single-buyer model was introduced in developing countries in the 1990s.
The CIS is composed of: Armenia, Azerbaijan, Belarus, Georgia, Kazakhstan, Kyrgyzstan, Moldova, Rus-
sia, Tajikistan, Turkmenistan, Ukraine and Uzbekistan. In October, 2000, the heads of five countries (Bela-
rus, Kazakhstan, Kyrgyzstan, Russia, and Tajikistan) signed an agreement on the creation of the Eurasian
Economic Community. Armenia, Moldova and Ukraine have observer status under EAEC. In October,
2005, Uzbekistan agreed to join this organization. In September 2003, four countries (Belarus, Kazakhstan,
Russia and Ukraine) signed an agreement on the Formation of CES (Common Economic Space).
Power Markets of Asian Countries in the International Markets Environment 637
It provides exclusive rights for a single transmission and dispatch company to purchase all
electricity from generators and then sell it to distributors [30].
The single-buyer model became popular in the CIS countries and elsewhere because of
technical, economic, and institutional reasons. These include:
● Balancing of electricity input and output is facilitated by a single dispatch method in
real-time.
● The “contract path” problem is avoided.
● The single-buyer model is usually responsive to the sector Ministry in the areas of gen-
eration capacity investment and state-owned company’s financial affairs. The most in-
fluential stakeholders favor this.
● Price regulation is simplified, maintaining a unified wholesale price.
● The single-buyer model is favored by politicians who do not agree with a complete
withdrawal of the state from wholesale electricity trading.
There is evidence, however, that it is more efficacious to adopt a market model that has mul-
tiple buyers formed immediately after unbundling, in areas such as the CIS. The single-
buyer model is criticized because it tends to place generation capacity expansion decisions
in government officials’ hands, which do not assume the financial consequences. This model
also makes the state ultimately responsible for poor power purchase agreements that cannot
be honored. This is regularly part of the contract agreement. This model also does not re-
spond well to reductions in electricity demand. Wholesale electricity prices will rise in re-
sponse to demand reduction because of fixed capacity charges, which must be applied to a
reduced volume of electricity purchases. Another drawback is the under-development of
cross-border power trade. This is because the state-owned single-buyer has very little profit
motive. This can cause long-term problems when a neighboring country or region develops
a more liberalized power market model. Incentives for distributors to collect payments from
customers are also reduced. Again, politically unpopular decisions are difficult for a state-
owned entity. This is important because in the single-buyer model, delinquent payments
from distributors are assumed by the aggregated cash proceeds of the single-buyer. Paying
and non-paying distributors are treated basically the same, weakening the resolve of dis-
tributors to enhance the collection of payments. Another political intervention in this model
has been experienced in the Ukraine and Poland. In these countries, groups have lobbied on
behalf of coal miners to provide special treatment for coal-fired power plants. Interestingly,
because of the political advantages of the single-buyer model, some governments have sig-
nificantly delayed the next “phase” of fully liberalized markets [30].
The CIS has experienced advances in the privatization of the power sector. For example,
Armenia, Azerbaijan, Georgia, Kazakhstan, Moldova and the Ukraine have either contracted
the management of electric companies, or sold generation companies and distribution elec-
tric grids. Modernization through the construction of energy facilities has been facilitated by
the creation of a legal basis. This has attracted direct investments in improvement projects
from internal and external sources. For example, Armenia, Azerbaijan, Georgia, Kyrgyzstan,
Tajikistan and Uzbekistan have received investments in projects ranging from hydro power
plants, steam gas turbine units to electricity grid restoration [29].
16.6 Economic Convergence Points of Russian, CIS and Asian Power Markets
The convergence of Asian power markets crosses political and geographical boundaries.
This Section provides an analysis of the technical and economic commonalities involved.
The two primary goals of power sector reforms have been liberalization and the establish-
ment of a competitive power market.
This Section discusses the fundamentals of cooperation, and the primary goals of power
sector reforms. The main reform priorities and primary strategic areas are discussed in the
context of the developing power market in Russia. Also the Section makes the point that
despite the large geographical area, and economic disparity of Asian countries, there are
commonalities to be considered in power sector reform. Each country should create a reform
methodology in a national and regional conceptualization.
It is explained that there are five common steps on which this can be based. Additionally,
when determining the correct model to apply to an economy to bring about the desired effi-
ciencies, it is important to consider 13 transitional issues.
16.6.1 Economic Analysis of Russian and CIS Power Sector
Interconnections and Markets
The Commonwealth of Independent States
(CIS) power sector has been characterized by
cooperation, liberalization, privatization, investment, and cross border integration of elec-
tricity markets [29]. The fundamentals of cooperation have been stated in the CIS agreement
entitled “On coordination of interstate relations in the field of electricity of the Common-
wealth of Independent States” signed in February 1992. Arising from this agreement, coop-
eration has been implemented in the areas of structural reforms, power system integration,
legislation and price liberalization. This is in response to serious power sector problems ex-
perienced by CIS countries in financial, technical, operational, and investment areas. As a
group, the CIS countries faced additional crises because of the 12 members, only four; Azer-
baijan, Kazakhstan, Russia, and Turkmenistan have enough fuel and energy resources to
cover internal demand.
The primary goals of power sector reforms in the CIS have been liberalization and the estab-
lishment of a competitive power market. This has been conceived, since 1996, as a complex
process, based upon relevant technological, structural and legislative foundations [29].
Many of the CIS countries have phased-in the process of power sector reforms. These re-
forms have followed previous global experiences by de-integrating vertically integrated
monopolies into distinct distribution, transmission, and generation companies. This has
established the foundational single-buyer model of market reform, in preparation for more
liberalization. The single-buyer model was introduced in developing countries in the 1990s.
The CIS is composed of: Armenia, Azerbaijan, Belarus, Georgia, Kazakhstan, Kyrgyzstan, Moldova, Rus-
sia, Tajikistan, Turkmenistan, Ukraine and Uzbekistan. In October, 2000, the heads of five countries (Bela-
rus, Kazakhstan, Kyrgyzstan, Russia, and Tajikistan) signed an agreement on the creation of the Eurasian
Economic Community. Armenia, Moldova and Ukraine have observer status under EAEC. In October,
2005, Uzbekistan agreed to join this organization. In September 2003, four countries (Belarus, Kazakhstan,
Russia and Ukraine) signed an agreement on the Formation of CES (Common Economic Space).
Electricity Infrastructures in the Global Marketplace638
The primary strategic areas are:
● To create a Kazakhstan unified energy system (UES).
● To restore the synchronous network with Russia, and other energy networks of central
Asia.
● To further develop an open and competitive market for electric power.
● To commission new generation capacity to offset power imports.
Assuming these priorities, it is useful to view Kazakhstan as a precursor to significant, simi-
lar changes in Russia. In 1990, the electricity shortage in Kazakhstan reached a level of 17.3
billion kWh [33]. This shortage was made up by power imported from Kyrgyzstan, Russia
and Uzbekistan. In 1996, the state generation and power grid monopoly was the object of
reform, with the aim to create a competitive power market. That year, the government in-
itiated a program to privatize and restructure the power sector formalized by Decision No.
663 of May 1996. Because of this decision, large generators were sold to investors, and a grid
company was created to own and maintain the high voltage grid assets, including voltage
levels of 1150, 500 and 220 kV. Additional decisions (1188 of September, 1996 and 1193 of
July, 1997) provided a model for Kazakhstan to follow for the creation of an electricity mar-
ket. Designed for competition, the single electricity market would have two levels, whole-
sale and retail. The trade of electricity would be based upon fixed date bilateral purchases
and transactions, and agreements on grid capacity. The competitive model would be
brought about by pro-active changes in the electricity sector:
Restructuring to create an effective, competitive market based on forwards contracts under
the supervisory control of a centralized dispatch.
A testing period for competitive market principles and enhanced quality indicators, espe-
cially regarding current frequency.
The creation of a pool of reserves – comprising a market of electricity reserves.
As of 2003, the wholesale power market is functioning on the basis of bilateral contracts. The
electricity exchange for day in advance power purchases was established in February 2002.
The total volume of sales at the exchange is considered to be 7 % to 10 % of the total supply
of electricity for Kazakhstan [34].
Hirschhausen and Waelde [35] have posited that an economic transition period from socia-
listic to capitalistic markets, especially in energy, no longer exists. Interestingly, the authors
make the critical point that experience with emulating institutional models has shown that
they often work very differently for the emulator than the emulated. Utilizing an institu-
tional interpretation of energy sector reform in the CIS, the authors contend that the transi-
tion from socialistic to market based economies has led to diverse outcomes. These differing
outcomes are based primarily upon the pre-existing formal and informal institutions that
dominate the particular country. The CIS countries have looked to Western market econo-
mies as models for the restructuring of their power sectors. Two diametric cases that have
been studied are the UK and French approach. The authors qualify this statement by sug-
gesting that there is no theoretically or empirically discernable best practice to structure and
There has been ongoing integration, and re-integration of the CIS power systems. For exam-
ple, in June 2000, the power system connections of Russia and Kazakhstan were restored.
Since the autumn of 2001, 11 of the 12 CIS countries have re-synchronized their power sys-
tems as an interconnected power system of the Commonwealth of Independent States (IPS-
CIS) [29]. Additionally, the CIS is involved with power exchanges and trade with the neigh-
boring countries of Afghanistan, China, Finland, Hungary, Iran, Norway, Poland, and Slo-
vakia. The CIS power authorities believe that cross-border synchronization is beneficial be-
cause it places better use of existing generation capacity, provides emergency assistance
options, and harmonizes standards in the areas of safety, ecology, and technology.
As part of an economic analysis of Eastern Europe and CIS transitional development from
centralized planning to free market forces, a framework is used to evaluate the impact of
infrastructure upgrades [31]. Research has indicated that “The potential for developing competi-
tive markets in transition economies had been inhibited by the inadequacy of both the institutional
and physical infrastructure inherited from the socialist era.” Although the following are general
recommendations for transition economies, the following economic contributions of market-
enabling infrastructure can be applied to the power sector:
● Market Selection: By increasing market competition, infrastructure investments that re-
duce transaction costs reduce the market share of higher-cost firms. This raises the av-
erage production efficiency of the economy.
● Infrastructure Investments: If these investments increase product market competition, incen-
tives for firms should change to help reduce their costs by engaging in a restructuring plan.
● Increasing Market Share: If lower cost firms enter the market, they have probably been
attracted by an infrastructure that lowers transaction costs (European Bank, 2000).
Therefore, each investment project in the CIS power sector can be evaluated in terms of the
contributions of direct market selection, restructuring and entry.
The primary problem with the power sector in Russia, in the context of the CIS, has been in-
adequate investment [32]. Reasons for this are found historically, primarily being a lack of in-
vestment in generation capacity, and increased industrial activity and subsequent higher de-
mand. A main goal has been to attract internal and external large-scale investments to the po-
tentially competitive elements of the power sector. Although Russia has formed a plan, crafted
in 2001, to eventually liberalize wholesale and retail electricity tariffs and to privatize segments
of the sector, other contiguous CIS members have taken a lead in reformation. Kazakhstan was
a reform leader by unbundling transmission, distribution and generation. Most generation and
distribution assets have been privatized, but transmission networks are still owned by the
government. In April 1999, the government of Kazakhstan approved a program to develop the
electric power sector, with a view to 2030 [33]. The main priorities are:
● To have economic and population self-reliance in electric power, and to have energy in-
dependence as part of national security.
● To create competitive resources for electric power export to supply energy markets of
contiguous and third countries.
● To develop a competitive electric power market on the basis of electric power transport
and distribution networks accessible for generators and a system to control power flow.
Power Markets of Asian Countries in the International Markets Environment 639
The primary strategic areas are:
● To create a Kazakhstan unified energy system (UES).
● To restore the synchronous network with Russia, and other energy networks of central
Asia.
● To further develop an open and competitive market for electric power.
● To commission new generation capacity to offset power imports.
Assuming these priorities, it is useful to view Kazakhstan as a precursor to significant, simi-
lar changes in Russia. In 1990, the electricity shortage in Kazakhstan reached a level of 17.3
billion kWh [33]. This shortage was made up by power imported from Kyrgyzstan, Russia
and Uzbekistan. In 1996, the state generation and power grid monopoly was the object of
reform, with the aim to create a competitive power market. That year, the government in-
itiated a program to privatize and restructure the power sector formalized by Decision No.
663 of May 1996. Because of this decision, large generators were sold to investors, and a grid
company was created to own and maintain the high voltage grid assets, including voltage
levels of 1150, 500 and 220 kV. Additional decisions (1188 of September, 1996 and 1193 of
July, 1997) provided a model for Kazakhstan to follow for the creation of an electricity mar-
ket. Designed for competition, the single electricity market would have two levels, whole-
sale and retail. The trade of electricity would be based upon fixed date bilateral purchases
and transactions, and agreements on grid capacity. The competitive model would be
brought about by pro-active changes in the electricity sector:
Restructuring to create an effective, competitive market based on forwards contracts under
the supervisory control of a centralized dispatch.
A testing period for competitive market principles and enhanced quality indicators, espe-
cially regarding current frequency.
The creation of a pool of reserves – comprising a market of electricity reserves.
As of 2003, the wholesale power market is functioning on the basis of bilateral contracts. The
electricity exchange for day in advance power purchases was established in February 2002.
The total volume of sales at the exchange is considered to be 7 % to 10 % of the total supply
of electricity for Kazakhstan [34].
Hirschhausen and Waelde [35] have posited that an economic transition period from socia-
listic to capitalistic markets, especially in energy, no longer exists. Interestingly, the authors
make the critical point that experience with emulating institutional models has shown that
they often work very differently for the emulator than the emulated. Utilizing an institu-
tional interpretation of energy sector reform in the CIS, the authors contend that the transi-
tion from socialistic to market based economies has led to diverse outcomes. These differing
outcomes are based primarily upon the pre-existing formal and informal institutions that
dominate the particular country. The CIS countries have looked to Western market econo-
mies as models for the restructuring of their power sectors. Two diametric cases that have
been studied are the UK and French approach. The authors qualify this statement by sug-
gesting that there is no theoretically or empirically discernable best practice to structure and
There has been ongoing integration, and re-integration of the CIS power systems. For exam-
ple, in June 2000, the power system connections of Russia and Kazakhstan were restored.
Since the autumn of 2001, 11 of the 12 CIS countries have re-synchronized their power sys-
tems as an interconnected power system of the Commonwealth of Independent States (IPS-
CIS) [29]. Additionally, the CIS is involved with power exchanges and trade with the neigh-
boring countries of Afghanistan, China, Finland, Hungary, Iran, Norway, Poland, and Slo-
vakia. The CIS power authorities believe that cross-border synchronization is beneficial be-
cause it places better use of existing generation capacity, provides emergency assistance
options, and harmonizes standards in the areas of safety, ecology, and technology.
As part of an economic analysis of Eastern Europe and CIS transitional development from
centralized planning to free market forces, a framework is used to evaluate the impact of
infrastructure upgrades [31]. Research has indicated that “The potential for developing competi-
tive markets in transition economies had been inhibited by the inadequacy of both the institutional
and physical infrastructure inherited from the socialist era.” Although the following are general
recommendations for transition economies, the following economic contributions of market-
enabling infrastructure can be applied to the power sector:
● Market Selection: By increasing market competition, infrastructure investments that re-
duce transaction costs reduce the market share of higher-cost firms. This raises the av-
erage production efficiency of the economy.
● Infrastructure Investments: If these investments increase product market competition, incen-
tives for firms should change to help reduce their costs by engaging in a restructuring plan.
● Increasing Market Share: If lower cost firms enter the market, they have probably been
attracted by an infrastructure that lowers transaction costs (European Bank, 2000).
Therefore, each investment project in the CIS power sector can be evaluated in terms of the
contributions of direct market selection, restructuring and entry.
The primary problem with the power sector in Russia, in the context of the CIS, has been in-
adequate investment [32]. Reasons for this are found historically, primarily being a lack of in-
vestment in generation capacity, and increased industrial activity and subsequent higher de-
mand. A main goal has been to attract internal and external large-scale investments to the po-
tentially competitive elements of the power sector. Although Russia has formed a plan, crafted
in 2001, to eventually liberalize wholesale and retail electricity tariffs and to privatize segments
of the sector, other contiguous CIS members have taken a lead in reformation. Kazakhstan was
a reform leader by unbundling transmission, distribution and generation. Most generation and
distribution assets have been privatized, but transmission networks are still owned by the
government. In April 1999, the government of Kazakhstan approved a program to develop the
electric power sector, with a view to 2030 [33]. The main priorities are:
● To have economic and population self-reliance in electric power, and to have energy in-
dependence as part of national security.
● To create competitive resources for electric power export to supply energy markets of
contiguous and third countries.
● To develop a competitive electric power market on the basis of electric power transport
and distribution networks accessible for generators and a system to control power flow.
Electricity Infrastructures in the Global Marketplace640
16.6.2 Convergence of Asian Power Markets
Asia-Pacific Economic Cooperation
, (APEC), created in 1989 to continue to stimulate regional
economic growth, has remained a consensus-based entity, without binding agreements [37].
APEC, although a non-treaty based organization, is having a significant impact on the reform
of the Russian economy, including the Russian power sector. The primary purposes of APEC
have been to encourage economic growth, trade, investment and cooperation in the Asia-
Pacific region. APEC is a 21-member organization, each called a Member Economy,
representing 47% of global trade. The APEC Member Economies include the Russian Federa-
tion as an integral participant. Particular themes can be found in APEC interests, including:
● Reduction of tariffs.
● Efficient domestic economies.
● Increased exports.
Other APEC activities include policy creation and economic cooperation to facilitate the
exchange of products across regional borders [37].
Established, and ongoing studies of the APEC economic area electricity supply industry
have indicated that reform in the developed economy members has been designed to im-
prove efficiency in the sector. In contrast, the developing economy members have sought
reform because of partial access to electricity supply, low infrastructure investment, uneco-
nomic pricing of electricity, and inability to manage high demand growth [38]. The progress
of microeconomic reform of the APEC electricity sector has been steady across both devel-
oped and developing member economies. Despite the large geographical area, and econom-
ic disparity of member economies, an APEC energy-working group has concluded that there
are commonalities to be considered in electric sector reform:
● Governments remain responsible for the outcome of reform, even after industry re-
structuring takes place.
● If governments cannot demonstrate the success of reform programs, there may be po-
litical consequences.
● Reform needs to be conceptualized to each member economy based on needs, circums-
tances, and resources.
● Despite advances in a competitive electric market, electric security and stability of the
entire system must always take precedence.
● Restructuring has been defined as a “break-up” of generation and supply, which are
contestable, and mostly non-competitive elements of transmission and distribution.
● The introduction of a competitive electricity market will create high risk for consumers
if supply is unreliable, or becomes unreliable. High levels of competition are not ap-
propriate for developing economies in the early stages of electric sector reform.
● If the impetus is to keep the electricity market at a marginally competitive level, other
aspects of the system can be made more competitive. The separation of the transmis-
sion system and the creation of a competitive system to acquire primary and secondary
energy are examples.
APEC's 21 Member Economies are: Australia, Brunei Darussalam, Canada, Chile, People's Republic of
China, (Hong Kong, China), Indonesia, Japan, Republic of Korea, Malaysia, Mexico, New Zealand, Pa-
pua New Guinea, Peru, The Republic of the Philippines, The Russian Federation, Singapore, Chinese
Taipei, Thailand, United States of America and Viet Nam.
regulate the global energy sector. The CIS, including Russia, however, have overwhelmingly
chosen the UK (British) approach which has been reproduced in Australia, Canada, New
Zealand, Scandinavia, and several U.S. states. This approach has been marked by very direct
privatization, corporatization, and competition. The French system, in contrast, has essen-
tially maintained integrated monopolies protected from competition. Despite the similarities
found in the French and formerly Soviet approaches, linked by a dominating public service
obligation and a close relationship between management and politics, the French system has
not been the model of choice for the CIS. The initial elements of the approaches found in
most CIS countries have been to:
● Identify appropriate reform models from international experiences,
● Attempt to re-produce those models in an effective way domestically,
● Allow the domestic model to emerge and evolve with conceptualized principles [35].
Interestingly, after surveying international examples, some countries such as Russia and the
Ukraine have crafted early proposals that have included additional competitive elements.
This enthusiasm for the UK approach can be tied to what is perceived as superior wealth
generation, technological innovation and swiftness of economic response to the needs of the
market. Possibly most importantly to consider, Hirschhausen and Waelde [35] indicate that
the AC connection of Poland and other east European countries to the West European grid
was an external impetus to modernization. This is an important recognition of the relation
between the physical connections of electricity grids of distinct systems, and the subsequent
need to reform such areas as security, technical requirements, quality and communication.
Indeed, this is demonstrated by the relationship of technical and economic needs of the Jap-
anese power grid interconnection (PGI) considered with Eurasia. Arakawa [36] suggests that
a major issue concerning Japan’s PGI is the “eventual interconnection of the Japanese power sys-
tem with the Eurasian mainland [which] will be achieved with restructuring of Japan’s electric power
market to be freely competitive. In addition, the relationship between Japan and Russia must be im-
proved to a point that the neighboring nations will be able to cooperate, for example, in mutual devel-
opment of Siberian natural resources. Apart from political and economic concerns, no major technical
difficulties in PGI are anticipated”.
Projects such as the potential Japanese-Eurasian interconnection can be financed through three
main approaches, (1) public ownership, (2) public-private partnership, and (3) private owner-
ship. Though not the primary focus of this Section, more rigorous analyses of potential Asian
interconnections should be carried out before assuming the existence of financial, capacity, or
reserve capacity incentives. For instance, if the potential interconnections are between two
monopolies, then analyses can be carried out using bilateral monopoly trade theory. This
would be particularly useful with a monophony – monopoly power market scenario. Howev-
er, in this scenario, the Nash equilibrium theorem cannot be used because the asymmetry
found between distinct systems discounts the determination of a unique price.
Power Markets of Asian Countries in the International Markets Environment 641
16.6.2 Convergence of Asian Power Markets
Asia-Pacific Economic Cooperation
, (APEC), created in 1989 to continue to stimulate regional
economic growth, has remained a consensus-based entity, without binding agreements [37].
APEC, although a non-treaty based organization, is having a significant impact on the reform
of the Russian economy, including the Russian power sector. The primary purposes of APEC
have been to encourage economic growth, trade, investment and cooperation in the Asia-
Pacific region. APEC is a 21-member organization, each called a Member Economy,
representing 47% of global trade. The APEC Member Economies include the Russian Federa-
tion as an integral participant. Particular themes can be found in APEC interests, including:
● Reduction of tariffs.
● Efficient domestic economies.
● Increased exports.
Other APEC activities include policy creation and economic cooperation to facilitate the
exchange of products across regional borders [37].
Established, and ongoing studies of the APEC economic area electricity supply industry
have indicated that reform in the developed economy members has been designed to im-
prove efficiency in the sector. In contrast, the developing economy members have sought
reform because of partial access to electricity supply, low infrastructure investment, uneco-
nomic pricing of electricity, and inability to manage high demand growth [38]. The progress
of microeconomic reform of the APEC electricity sector has been steady across both devel-
oped and developing member economies. Despite the large geographical area, and econom-
ic disparity of member economies, an APEC energy-working group has concluded that there
are commonalities to be considered in electric sector reform:
● Governments remain responsible for the outcome of reform, even after industry re-
structuring takes place.
● If governments cannot demonstrate the success of reform programs, there may be po-
litical consequences.
● Reform needs to be conceptualized to each member economy based on needs, circums-
tances, and resources.
● Despite advances in a competitive electric market, electric security and stability of the
entire system must always take precedence.
● Restructuring has been defined as a “break-up” of generation and supply, which are
contestable, and mostly non-competitive elements of transmission and distribution.
● The introduction of a competitive electricity market will create high risk for consumers
if supply is unreliable, or becomes unreliable. High levels of competition are not ap-
propriate for developing economies in the early stages of electric sector reform.
● If the impetus is to keep the electricity market at a marginally competitive level, other
aspects of the system can be made more competitive. The separation of the transmis-
sion system and the creation of a competitive system to acquire primary and secondary
energy are examples.
APEC's 21 Member Economies are: Australia, Brunei Darussalam, Canada, Chile, People's Republic of
China, (Hong Kong, China), Indonesia, Japan, Republic of Korea, Malaysia, Mexico, New Zealand, Pa-
pua New Guinea, Peru, The Republic of the Philippines, The Russian Federation, Singapore, Chinese
Taipei, Thailand, United States of America and Viet Nam.
regulate the global energy sector. The CIS, including Russia, however, have overwhelmingly
chosen the UK (British) approach which has been reproduced in Australia, Canada, New
Zealand, Scandinavia, and several U.S. states. This approach has been marked by very direct
privatization, corporatization, and competition. The French system, in contrast, has essen-
tially maintained integrated monopolies protected from competition. Despite the similarities
found in the French and formerly Soviet approaches, linked by a dominating public service
obligation and a close relationship between management and politics, the French system has
not been the model of choice for the CIS. The initial elements of the approaches found in
most CIS countries have been to:
● Identify appropriate reform models from international experiences,
● Attempt to re-produce those models in an effective way domestically,
● Allow the domestic model to emerge and evolve with conceptualized principles [35].
Interestingly, after surveying international examples, some countries such as Russia and the
Ukraine have crafted early proposals that have included additional competitive elements.
This enthusiasm for the UK approach can be tied to what is perceived as superior wealth
generation, technological innovation and swiftness of economic response to the needs of the
market. Possibly most importantly to consider, Hirschhausen and Waelde [35] indicate that
the AC connection of Poland and other east European countries to the West European grid
was an external impetus to modernization. This is an important recognition of the relation
between the physical connections of electricity grids of distinct systems, and the subsequent
need to reform such areas as security, technical requirements, quality and communication.
Indeed, this is demonstrated by the relationship of technical and economic needs of the Jap-
anese power grid interconnection (PGI) considered with Eurasia. Arakawa [36] suggests that
a major issue concerning Japan’s PGI is the “eventual interconnection of the Japanese power sys-
tem with the Eurasian mainland [which] will be achieved with restructuring of Japan’s electric power
market to be freely competitive. In addition, the relationship between Japan and Russia must be im-
proved to a point that the neighboring nations will be able to cooperate, for example, in mutual devel-
opment of Siberian natural resources. Apart from political and economic concerns, no major technical
difficulties in PGI are anticipated”.
Projects such as the potential Japanese-Eurasian interconnection can be financed through three
main approaches, (1) public ownership, (2) public-private partnership, and (3) private owner-
ship. Though not the primary focus of this Section, more rigorous analyses of potential Asian
interconnections should be carried out before assuming the existence of financial, capacity, or
reserve capacity incentives. For instance, if the potential interconnections are between two
monopolies, then analyses can be carried out using bilateral monopoly trade theory. This
would be particularly useful with a monophony – monopoly power market scenario. Howev-
er, in this scenario, the Nash equilibrium theorem cannot be used because the asymmetry
found between distinct systems discounts the determination of a unique price.
Electricity Infrastructures in the Global Marketplace642
Allocated efficiency, which are the way resources are utilized, in the light of appropriate sig-
nals for investment and consumption.
Dynamic efficiency, which is the extent that innovation and productivity increases are encour-
aged over a specific duration [39].
Critically, when determining the correct model to apply to an economy to bring about the de-
sired efficiencies, it is important to consider transitional issues. These transitional issues in-
clude:
Ownership
If the current model of the power sector is a state-owned monopoly, full privatization should
be delayed until it can be determined that the new companies will be viable, and after new
markets have been tested.
Incumbents
If competition is introduced, incumbent utilities are under an obligation to reduce operating
costs, and to develop new strategies and new markets to supply power to. The restructuring of
the industry creates new risks for incumbent utilities. This includes the areas of finance, regu-
lation and politics. As an example, generators can have competition amongst local power sup-
pliers. Additionally, as the electricity grid becomes more interconnected, with more room for
capacity, interstate and international generators then add to the competitive marketplace.
Stranded Costs
Stranded costs are the historical costs, mainly through generation plant construction, that may
not be recoverable in the new prices charged in a competitive market. Generally, there are four
types of stranded costs:
1) New generating plants could out-compete old plants, necessitating the decommissioning of
older plants.
2) Competition can provide lower cost, long-term fuel or power purchasing contracts. Utilities
bound to uneconomic contracts have higher input costs, and consequently a loss in earnings,
making recovery difficult.
3) Utilities that have been obligated to invest in “regulatory assets” can find that the regulatory
regime can change under a competitive environment, reducing their protective “extended pay-
ment plans” by deregulated, lower prices.
4) Other public policy programs such as Demand Side Management (DSM) programs can be
stranded, as their cost recovery will become impossible in a deregulated system [39].
Although full recovery of stranded costs are rare, most experts in the field agree that govern-
ments should pay utilities for stranded costs, on a case by case basis, based upon specific
attributes of the utilities in question.
Security of Supply
Two primary aspects of security of supply must be considered when planning and implement-
ing a transition to competitive markets. They are the securing of long duration sources of gen-
eration fuels and the reliability of the power system.
● The historical emergence of competitive electricity markets has arisen “naturally” from
trade between distinct power systems via sub-national and national power system in-
terconnections.
● Under pricing of electricity removes much of the incentive to invest in infrastructure.
● There is no “reform standard”. This being the case, it is important to create an objective
setting, monitoring and measuring system to manage reform.
● Highly valuable empirical reform experience can be lost. It is important to retain ta-
lented experience for ongoing institution building [38].
Importantly, it can be maintained that each member economy should create a reform me-
thodology in a regional and national conceptualization. However, there are five common
steps that this can be based upon:
● Create national policy objectives.
● Identify reform risks.
● Assume and implement reform strategies that are realistic.
● Project-manage the reforms.
● Create an institutional unit to consistently monitor the progress of reforms.
Interestingly, the research methodology used by the APEC energy working group was com-
posed of a literature review, interviews of reform participants in APEC economies, cross-
sectional assessments of the current status of reform, and applications of practical expe-
rience in case studies of developed and developing economies in APEC. Overall reform of
the electricity sector has been divided into eight primary sections:
● Policy objectives
● Management
● Structure
● Framework for law and regulation
● Mechanisms for wholesale market
● Transmission and distribution
● Retail tariffs
● Privatization [39].
By utilizing mixed research methodologies to provide analyses, each of these eight sections
has strategic principles designed to provide common points of reference for reform, and to
also provide the basis for a conceptualized approach. Interestingly, Principle 35, under
Wholesale Market Mechanisms, states: “The establishment of a competitive wholesale market
should only be considered in the context of overall market structure and design” [39]. Wholesale
market mechanisms should be able to interface with regulatory frameworks, transmission
and distribution planning, and access. This should account for the need to provide cost ef-
fective supply from generation to the distribution connecting points. Competitive wholesale
market mechanisms are integral to overall power system reform planning and implementa-
tion. The primary aim of power system reform should be to improve economic efficiency. This
can be divided into three areas:
Productive efficiency, which is the relationship between production input and output, and the
implementation of best practice concepts.
Power Markets of Asian Countries in the International Markets Environment 643
Allocated efficiency, which are the way resources are utilized, in the light of appropriate sig-
nals for investment and consumption.
Dynamic efficiency, which is the extent that innovation and productivity increases are encour-
aged over a specific duration [39].
Critically, when determining the correct model to apply to an economy to bring about the de-
sired efficiencies, it is important to consider transitional issues. These transitional issues in-
clude:
Ownership
If the current model of the power sector is a state-owned monopoly, full privatization should
be delayed until it can be determined that the new companies will be viable, and after new
markets have been tested.
Incumbents
If competition is introduced, incumbent utilities are under an obligation to reduce operating
costs, and to develop new strategies and new markets to supply power to. The restructuring of
the industry creates new risks for incumbent utilities. This includes the areas of finance, regu-
lation and politics. As an example, generators can have competition amongst local power sup-
pliers. Additionally, as the electricity grid becomes more interconnected, with more room for
capacity, interstate and international generators then add to the competitive marketplace.
Stranded Costs
Stranded costs are the historical costs, mainly through generation plant construction, that may
not be recoverable in the new prices charged in a competitive market. Generally, there are four
types of stranded costs:
1) New generating plants could out-compete old plants, necessitating the decommissioning of
older plants.
2) Competition can provide lower cost, long-term fuel or power purchasing contracts. Utilities
bound to uneconomic contracts have higher input costs, and consequently a loss in earnings,
making recovery difficult.
3) Utilities that have been obligated to invest in “regulatory assets” can find that the regulatory
regime can change under a competitive environment, reducing their protective “extended pay-
ment plans” by deregulated, lower prices.
4) Other public policy programs such as Demand Side Management (DSM) programs can be
stranded, as their cost recovery will become impossible in a deregulated system [39].
Although full recovery of stranded costs are rare, most experts in the field agree that govern-
ments should pay utilities for stranded costs, on a case by case basis, based upon specific
attributes of the utilities in question.
Security of Supply
Two primary aspects of security of supply must be considered when planning and implement-
ing a transition to competitive markets. They are the securing of long duration sources of gen-
eration fuels and the reliability of the power system.
● The historical emergence of competitive electricity markets has arisen “naturally” from
trade between distinct power systems via sub-national and national power system in-
terconnections.
● Under pricing of electricity removes much of the incentive to invest in infrastructure.
● There is no “reform standard”. This being the case, it is important to create an objective
setting, monitoring and measuring system to manage reform.
● Highly valuable empirical reform experience can be lost. It is important to retain ta-
lented experience for ongoing institution building [38].
Importantly, it can be maintained that each member economy should create a reform me-
thodology in a regional and national conceptualization. However, there are five common
steps that this can be based upon:
● Create national policy objectives.
● Identify reform risks.
● Assume and implement reform strategies that are realistic.
● Project-manage the reforms.
● Create an institutional unit to consistently monitor the progress of reforms.
Interestingly, the research methodology used by the APEC energy working group was com-
posed of a literature review, interviews of reform participants in APEC economies, cross-
sectional assessments of the current status of reform, and applications of practical expe-
rience in case studies of developed and developing economies in APEC. Overall reform of
the electricity sector has been divided into eight primary sections:
● Policy objectives
● Management
● Structure
● Framework for law and regulation
● Mechanisms for wholesale market
● Transmission and distribution
● Retail tariffs
● Privatization [39].
By utilizing mixed research methodologies to provide analyses, each of these eight sections
has strategic principles designed to provide common points of reference for reform, and to
also provide the basis for a conceptualized approach. Interestingly, Principle 35, under
Wholesale Market Mechanisms, states: “The establishment of a competitive wholesale market
should only be considered in the context of overall market structure and design” [39]. Wholesale
market mechanisms should be able to interface with regulatory frameworks, transmission
and distribution planning, and access. This should account for the need to provide cost ef-
fective supply from generation to the distribution connecting points. Competitive wholesale
market mechanisms are integral to overall power system reform planning and implementa-
tion. The primary aim of power system reform should be to improve economic efficiency. This
can be divided into three areas:
Productive efficiency, which is the relationship between production input and output, and the
implementation of best practice concepts.