Organic Light Emitting Diode Material Process and Devices Part 10 ppt
Bạn đang xem bản rút gọn của tài liệu. Xem và tải ngay bản đầy đủ của tài liệu tại đây (2.88 MB, 25 trang )
Organic Light Emitting Diode – Material, Process and Devices
216
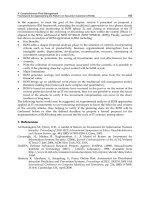
Fig. 1. The schematic layout of a 2T1C pixel driver for AMOLED backplanes
Using a high temperature foil like polyimide (PI) which can sustain temperature of <260 °C
allows a process flow very similar to the flow used for a-Si backplanes. On the other hand, if
a low-temperature, low-cost foil such as polyethylenetheraphtalate (PET) (<120 °C) or
polyethylene naphtalate (PEN) (<160 °C) is used, it will necessitate the development of low
temperature materials and processes for the backplanes.
To produce a highly efficient OLED display at the end of the process, the choice for a top
emitting OLED on top of the pixel engine as shown in Figure 2 is most favorable to generate
a larger emitting surface. In order to electrically isolate the OLED from the pixel engine, an
interlayer is required. This implements also the necessity to have a connection between the
OTFT and the OLED anode. This connection, or via hole, will have to be generated through
the interlayers that protect the OTFT from degrading, and ideally without impacting the
performance of the OTFT.
Fig. 2. Schematic cross section of an AM-OLED stack
The OLED pixels (red, green and blue) will be deposited by evaporation, using a
shadowmask patterning technique to create different colors. Prior to this deposition, the
Interlayer Processing for Active Matrix Organic Light Emitting Diode (OLED) Displays
217
anode material has to be deposited and patterned on top of the interlayers. Considering
solely performance, the most favorable anode material is silver due to its low resistivity and
high reflectivity
There are several challenges in realizing top emitting OLEDs on organic TFTs which have a
long lifetime because of their limited chemical, physical and environmental stability. In this
chapter, we address processing issues for the interlayers and the anode.
Another issue will be the adhesion of materials on top of each other. Organic materials
generally have a pronounced polarity which will act to repel or attract other materials.
Another drawback of processing on top of OTFTs is their inherent performance sensitivity
to a variety of solvents and their degradation in atmospheric conditions.
2. Interlayer with via process
To obtain the flexibility needed to create a rollable display, OTFTs are one of the possible
choices. Among OTFTs, one of the most widely studied and used organic semiconductor
materials is pentacene, allowing mobilities up to 1 cm
2
/(Vs). However, immediately
following deposition, oxygen, humidity and solvents will affect the transistor performance
adversely. The upper temperature limit the pentacene can sustain is approximately 140 °C;
Fukuda et al has shown that higher temperatures will result in recrystallization and a
decrease of the transistor performance.
Fig. 3. Pentacene molecule
On top of the MIM stack with OTFTs, an insulating interlayer with via holes needs to be
processed on which the reflective metal anode of the OLED is photolithographically
processed. This interlayer has to allow a good adhesion of the OLED anode, which is
deposited last on top of the interlayer through a shadowmask.
In order to have a very smooth anode, the polymer interlayer needs to have a very low
surface roughness, since this will be reproduced in the surface of the anode.
The main requirement of the interlayer, that is, to protect the OTFT from air, suggests the
use of a material that has good barrier properties against chemicals, moisture and air, a
solvent free deposition technique, low temperature budget and good adhesion. When
surveying the options available for such an interlayer, a premium choice would be to use
poly(p-xylylene), also known as parylene. The deposition of parylene by chemical vapor
deposition (CVD) is known to be pinhole free at thicknesses >600 nm, and has been used in
many applications in aerospace, electronics and military for its good barrier properties
against water, chemicals and oxygen. These properties therefore would be very useful when
it comes to protecting the pentacene from degrading. Also the deposition technique is fully
compatible with the semiconductor, since the temperature inside the polymerization
chamber does not exceed 30 °C over the entire deposition run. Measurements prove the
barrier properties of parylene as depicted in Figure 4. After it has been deposited, the
parylene polymer can handle temperatures up to 160 °C. When this temperature is
exceeded, the polymer will rather degrade and decompose instead of deform.
Organic Light Emitting Diode – Material, Process and Devices
218
Fig. 4. Transistor transfer curves in saturation measured after before (left) and after (right)
parylene deposition. The mobility went down from 0.34 to 0.32 cm
2
/(Vs) (in both graphs the
semiconductor is pentacene)
Parylene itself comes in 3 main derivates; type N, type C and type D, all commercially
available. Other types also do exist as commercial products and are chemically modified to
be high temperature resistant or have a fluorinated structure. The difference is based on the
presence of chlorine atoms on the monomer as depicted below.
Fig. 5. Different parylene derivatives (left to right) Parylene N, Parylene C and Parylene D
This presence of chlorine atoms on the benzene ring has an influence on the surface energy
of the resulting film and therefore on the adhesion of subsequent layers. Previous research
has shown that the more chlorine atoms that are bonded on the benzene ring, the worse the
adhesion towards silver becomes. This can also be seen in contact angle measurements on
the different films and therefore, the choice of the N type is best suited for this application.
The maximal thickness that was observed by Vicca et al, still adhering sufficiently for further
processing, was 2 micrometer.
To ensure that a silver anode adheres well on the parylene layer, a slow deposition rate, <
1,5 Å/s, is required. This will allow sufficient relaxation time of the silver and reduces
stress in the metal film. Stress free layers up to 200 nm are possible with this approach.
16x10
-3
14
12
10
8
6
4
2
0
|I
D
|
1/2
[A
1/2
]
-10 -5 0 5 10
V
GS
[V]
10
-13
10
-11
10
-9
10
-7
10
-5
|I
D
| [A]
'Before parylene'
= 3.42x10
-1
cm
2
/(V.s)
16x10
-3
14
12
10
8
6
4
2
0
|I
D
|
1/2
[A
1/2
]
-10 -5 0 5 10
V
GS
[V]
10
-12
10
-11
10
-10
10
-9
10
-8
10
-7
10
-6
10
-5
10
-4
|I
D
| [A]
'After parylene'
= 3.21x10
-1
cm
2
/(V.s)
Interlayer Processing for Active Matrix Organic Light Emitting Diode (OLED) Displays
219
Patterning of parylene is done by photolithography using a dry etch plasma to define the
desired structures. We used oxygen plasma allowing etch rates up to 17 Å/s using a
moderate (50 W) etch power in a reactive ion etch (RIE) plasma. The various parameters
such as pressure, gas flows, power, etc., are different for each etch chamber and will not be
discussed further.
The CVD process will lead to a conformal coating of the sample, meaning that the
polycrystalline structure of the pentacene (with root mean square roughness of 10 nm) is
projected into the surface of the parylene and thus, in the surface of the anode.
To decrease the resulting surface roughness, a second spin coated layer over the parylene
layer will act as a planarization layer as suggested by Yagi et al. The requirements for this
material are similar to those for the parylene interlayer; solvent and temperature needs to be
compatible with the processing steps and should allow a good adhesion of the subsequent
OLED anode material.
Considering the requirements (temperature budget <150 °C, crosslinkable and solution
processed) there are very few materials available in literature, (e.g. SU8, SC100, photoresist,
PVP and PMMA) and after some initial screening experiments, we chose PVP. Having a
dielectric constant of around 4.5, this commercially available material has been already used
by many research groups as a dielectric in TFT processing, and it has proven to result in
smooth surfaces and good adhesion properties. Typically, layer thicknesses around 200 –
400 nm are obtained, covering the parylene film completely without affecting the bending
radius of the substrate.
Fig. 6. Monomer of poly-4-vinylphenol
The PVP will not remain on the substrate as a rigid polymer film, but needs crosslinking to
form a film that is compatible with chemicals used in further processing. To enable this cross
linking, a molecule will bond on the separate PVP polymer chains and create a chemically
inert film. The cross linker most commonly used for PVP is poly(melamine-co-
fromaldehyde). A process flow is described by Hwang et al and reports a thermal initiation
of the cross linking reaction at temperatures around 180-200 °C.
Fig. 7. Crosslinker poly(melamine-co-formaldehyde)
Organic Light Emitting Diode – Material, Process and Devices
220
When lowering the cross linking temperature to a more acceptable 145 °C, the cross linking
time increased to almost 3 hours. When using this long time for a baking process, it is
important to allow the substrate a long cool down period afterwards to prevent stress
effects. These stress effects can be seen by bended wafers, which will result in misaligned
structures. The use of low temperature cross linkers has been described in literature and can
be used for further decreasing of the temperature.
Other ways for decreasing the crosslinking temperature even further were investigated and
reported by Vicca et al and resulted in the use of another commercially available
crosslinking molecule; (hydroxymethyl)benzoguanamine.
Another point that needs to be taken into account is the cross linking reaction itself between
the polymer chains and the cross linking molecule. Very often this reaction produces side
products such as ions or volatile organic compounds (VOC) or else unused cross linker
remains behind. These molecules will very often function like as a charge trap, influencing
the transistor characteristics and which has been observed for both crosslinking molecules.
Typical effects that can be seen in the transfer characteristic curves are hysteresis, indicating
the presence of charge trapping ions, often left from reaction side products or VOC. This
might indicate a need for a longer bake time to evaporate these products out of the film. If
the threshold voltage (V
t
) shifts in the negative direction, this indicates an excessive amount
of cross linker. To solve this effect, a lower percentage of the cross linker should be used.
Using these indications, a good recipe for PVP can be optimized.
Once the resist is patterned, dry etching with oxygen plasma (RIE) will remove the PVP
accurately. Just like when etching parylene, the discussion on different parameters like
flows, power, pressure, etc., will not be applicable here, since this is very dependent on etch
chamber architecture.
Fig. 8. The full AM-OLED stack using a PVP planarization layer on top of the parylene
interlayer
3. Silver anode
To find the optimal material that can be used as an anode material, the different properties
of possible candidates must be compared to ensure that the best option is used for the
Interlayer Processing for Active Matrix Organic Light Emitting Diode (OLED) Displays
221
process. Considering that the most advanced OLED stacks have doped- transport/injection
layers implemented, the choice of work function is not strongly relevant. To increase the
output of the OLED, it would be useful to reflect the light that is emitted towards the
backside of the stack. This efficiency increment can be realized by choosing a highly
reflective metal that also can be deposited with a sufficient thickness such that it is not
transparent. To ensure these thick layers are possible on top of the polymer interlayer, a
good degree of adhesion is required to prevent the metal from delaminating.
Fig. 9. Comparison of different anode metals for green OLED stacks measured at 525 nm
In Figure 9, a comparison between different metals is made to compare the light intensity
with the intensity of the silver, It is clearly shown that the silver always has the highest
intensity and also the highest reflectance. This was also calculated for red and blue OLED
stacks in Figures 10 and 11, respectively.
Fig. 10. Comparison of different anode metals for red OLED stacks measured at 630 nm
From a performance point of view, Ag emerges as the optimal choice. In addition, the
deposition of the silver anode on PVP or parylene does not require any adhesion layers or
Organic Light Emitting Diode – Material, Process and Devices
222
adhesion promotors such as HMDS since silver has a good adhesion on the polymer
surfaces.
Fig. 11. Comparison of different anode metals for blue OLED stacks measured at 460 nm
3.1 Lift off
Once the silver layer has been deposited, it still needs to be patterned in order to define the
separate pixels in the display. For patterning, the main options available are lift off or
etching. When using a lift off process, the resist will already be patterned on the wafer prior
to the silver deposition and will be dissolved afterwards in a solvent to remove the silver
where it has no contact with the polymer interlayer.
Fig. 12. Schematic presentation of the liquid impact on the OTFT during processing
However, for yield consideration, lift-off processes should be generally avoided and since
the inherent limit to the metal thickness is approximately 50 nm, it would not be compatible
with the non-transparent silver layer (200 nm) that is desired.
Another disadvantage of the lift off process is the long exposure of the wafer and OTFTs to
the lift off solvent(s). It is proven by measuring mobilities of OTFTs that were encapsulated
Interlayer Processing for Active Matrix Organic Light Emitting Diode (OLED) Displays
223
with different polymers and immersed for 1 minute in various solvents, that liquid
chemicals used in general processing do have a negative impact on the mobility. Results of
these tests are showed in Figure 13, using 2 types of polymer to protect the OTFTs from the
chemicals.
Fig. 13. Loss of mobility for OTFT after immersion in different process liquids for 1 min; IPA
(isopropanol), NMP (n-methyl pyrolidone), MPA (methyl propyl acetate), TMAH (tetra
methyl ammonium hydroxide), TFA (commercial Au etchant), PG remover (commercial
photoresist stripper)
3.2 Wet etching
When looking at the option to pattern the anode layer with an etch process, the etching is
performed after a silver layer has been deposited and patterned by photolithography using
the inverted mask lay out of the lift off patterning. The etching itself can be done by wet etch
or dry etching. If a wet etch process is used, a certain amount of reproducibility should be
respected. To do this, the EDC system by Laurell Inc. was used, employing a commercial
silver etchant. The system will spin the wafer while the etchant is sprayed over the wafer,
causing the etching of the silver. The main issue with this system is to find a good rotation
speed for the spinner. If the wafer rotates too slowly, the etchant arriving in the center will
remain for too long and cause over etching here. If the resolution of the etched structures is
monitored as shown in Figure 14, the ideal spin speed would be around 1500 rpm. At this
equilibrium point, the overertch in the center and at the wafer edge was found to be the
same. Adjusting the etch time leads to the desired amount of overetch, which is as close to
zero as possible. Doing this however leaves a very small time window for the etching,
resulting in a 7 second etch time for 200 nm of silver.
The main problem however of the wet etch technique is again the use of liquids. This can be
seen by microscope inspection of the pixels after patterning. The swelling of the interlayer
underneath will deform the pixel surface dramatically as can be seen in Figure 15, leading to
pixel failures.
The liquid impact can also be observed in the performance of the transistors by comparing
their mobilities before and after the silver has been patterned.
0
5
10
15
20
25
30
35
Mobility loss [%]
parylene C
X-PVP
Organic Light Emitting Diode – Material, Process and Devices
224
Fig. 14. Rotation speed versus overetch at edge and center of a 6 inch silver substrate
Fig. 15. Microscopy image of pixels deformed by swelling of the polymer interlayer
3.3 Dry etching
When looking to dry etching techniques, literature describes only few effective etching
techniques for the removal of silver. These processes were typically used to pattern silver
lines in circuit purposes and the use of an inductively coupled plasma (ICP) is the most
common technique described by Lee et al, Jang et al, and Park et al. The disadvantage,
however, of this technique is the likelihood of silver residues that will form a conductive
film on the chamber wall, stopping the plasma. In literature, most of the etch recipes use a
gas mixture in which argon and CF
4
are combined.
The purpose of this mixture is the fluorination of silver by CF
4
, followed by argon sputtering
in order to remove the silver salt.
Ag + F
-
→ AgF and AgF
2
→ sputtered away by Ar
+
ions
We tried to produce a dry etch process running on a reactive ion etch (RIE) fab tool. At first,
the effect of pure gasses present in the tool was tested to see their effect on a pristine silver
film, deposited on a polymer coated wafer that could act as a dummy for the stack that will
be used later. The gasses that can be used are argon, CF
4
, oxygen and SF
6
.
1.4
1.2
1.0
0.8
0.6
0.4
Overetch (micron)
1600140012001000800600
Spin speed (rpm)
edge
center
Interlayer Processing for Active Matrix Organic Light Emitting Diode (OLED) Displays
225
When using a pure argon gas plasma, the ionized argon atoms (Ar
+
) will sputter on the
silver surface, causing a rough surface, but without removal of silver. As a side effect of this
sputtering, the temperature of the substrate increases too much to allow the use of argon
when a foil substrate is used.
Fig. 16. Photo of the impact of pure argon etch on silver
Using an oxygen plasma, the reaction with silver is obvious to be observed and results in a
highly affected surface. This etching will eventually remove all silver without generating too
much heat, but the removal of silver is caused by a stress induced exfoliation. The oxygen will
react with the silver and create silver oxides which have a certain amount of stress in them.
Ag + O
2-
→ AgO and Ag
2
O
This stress will lead to the creation of flakes of silver oxide that will exfoliate from the
surface because of their different expansion coefficient. The size of these flakes cannot be
controlled and will result in low resolution if this gas only is used for the removal of silver.
This observation has also been described in literature by Nguyen et al.
Fig. 17. Photo of the impact of pure oxygen etch showing the high affinity of oxygen to react
with silver
Organic Light Emitting Diode – Material, Process and Devices
226
Etching silver with a CF
4
plasma will result in a thin layer of silver fluoride which will be
present on the top layer of the surface, but will act more similar to a passivation layer that
prevents further fluorination of the metal. This is also why a mixture of CF
4
and argon is
needed to remove this top layer such that a fresh silver layer is exposed to the CF
4
gas.
Fig. 18. Photo of the silver layer after plasma etch using pure CF
4
revealing a poor impact
The use of an SF
6
plasma will result in a gently affected silver layer in which probably some
fluorination has occurred, but in which also sulfur depositions can be observed as yellow
dots.
Fig. 19. The impact of pure SF
6
etch on a silver layer showing yellow (sulphur) dots in the
surface
Since the use of a single gas appears not to be possible, a similar gas mixture as used in ICP
appeared more useful. As a starting point, the same Ar/CF
4
mixture as described in
literature can be tested, but will result in a non effective etch. Probably due to a low etch
power (500 W) compared with ICP etch power (1500 W), this will not be suitable for RIE
Interlayer Processing for Active Matrix Organic Light Emitting Diode (OLED) Displays
227
tools. To get the mixture working, the energy needed to start the fluorination needs to be
lowered. To do this, a certain amount of oxygen can be added to the Ar/CF
4
mixture, which
will react first with the silver layer due to its favored reactivity. This will result in a silver
oxide that will be easily accessible for the CF
4
gas to fluorinate it further into silver fluoride
which can be sputtered away by the argon ions.
To understand what the right amount of oxygen in the Ar/CF
4
mixture is, samples with
silver will be used again to verify the impact of different gas flows. In principle, the Ar/CF
4
mixture will be present in excessive amounts that will fluorinate immediately all silver
oxide formed by the oxygen. Afterwards, the end product will be removed by the Ar
+
ions
sputtering.
Ag + O
2-
→ AgO and Ag
2
O
2 AgO + CF
4
→ 2 AgF
2
+ CO
2
→ removed by Ar
+
ions
When the amount of oxygen is too low, the silver will not etch completely and remains on
the substrate.
Fig. 20. Too low amount of oxygen, resulting in a not completed silver etch
Using too much oxygen will cause etching of the underlying polymer interlayer once the
silver film has been removed.
If the right amount of oxygen is used in the mixture, the polymer interlayer will appear shiny
as it was deposited before the silver deposition and all silver will be removed from the sample.
The compatibility of a dry etch recipe with that of the resist also requires optimization. The
effect of a too high etch power will result in a carbonization of the resist and will not allow
subsequent stripping of the resist with solvents. Also, the heating of the substrate will be
reduced as the etch power is reduced.
If the etching would take too long, this will also affect the resist adversely, leading to the
removal of the resist. This is mainly caused by the presence of oxygen in the gas mixture.
All the parameters were optimized for our tool and will of course depend from etch
chamber to etch chamber. In our etch chamber, etch rates of ±13Å/s were obtained without
affecting or removing a commercial photoresist used for the patterning of pixels.
Organic Light Emitting Diode – Material, Process and Devices
228
Fig. 21. Excess of oxygen in the gas mixture etching the polymer interlayer
Fig. 22. Exposed and not affected polymer interlayer after complete silver etch
Fig. 23. Carbonized resist left on the silver structure after solvent treatment
Interlayer Processing for Active Matrix Organic Light Emitting Diode (OLED) Displays
229
Fig. 24. Removed photoresist caused by too long etch time
Fig. 25. Patterned pixels after stripping photoresist. Left: fully processed 6 inch wafer, right:
detail of pixels in the QQVGA display
To confirm that the dry etch technique has not affected the performance of the OTFTs,
electrical measurements were executed on several transistors on different wafers and
mobilities were calculated. This resulted in an average mobility at the end of the process of
0.18 cm
2
/(Vs). When the final mobility is calculated for the OTFTs before and after the dry
etch process step, 61% of the mobility has been preserved. This was also calculated for the
wet etch technique, resulting in a final mobility 28% of the original mobility, showing the
advantage of dry etch in terms of both transistor stability and resolution.
Furthermore, when comparing the transfer curves of the OTFTs depicted in Figure 26, it can
be seen that there is no loss of uniformity over the processing steps, which is also one of the
beneficial effects of the dry etch recipe.
After OLED depositions were finished, 1 cm
2
test pixels as depicted in Figure 27 show a
high degree of uniformity of color indicating a smooth surface and giving an efficient light
output of 83 cd/A for a green OLED and 37 cd/A for a red OLED.
Organic Light Emitting Diode – Material, Process and Devices
230
Fig. 26. Transfer curves of different OTFTs measured on a fully processed wafer starting
after pentacene deposition (left) and anode etch (right)
Fig. 27. Pictures of OLED test structures on a flexible substrate
When the active pixels are connected to a control box, the pixels in the display will switch
on and off according to the commands of the controller. This allows us to activate or
3 mm
3 mm
Interlayer Processing for Active Matrix Organic Light Emitting Diode (OLED) Displays
231
deactivate all pixels or switch on even or odd rows and/or columns or to make checker
board patterns as is shown in Figure 28.
Fig. 29. Picture of different patterns created on the display by the active pixels
4. Conclusions
To tackle the challenges of a low temperature process for making organic backplanes for
OLED displays, the use of different polymers in the interlayer, parylene as well as PVP, has
been optimized in terms of their deposition, patterning and subsequent materials that will
be deposited on them. Working transistors prove the quality of the materials and the
efficiency of the process.
For the metal anode, a choice for silver was made mainly based on its excellent reflection
and conductivity properties. The patterning of the silver anode is performed by dry etching
using an optimized RIE process. This was developed due to the fact that other etch methods
seemed to affect the whole stack adversely and the output of OTFT at the end.
Combining the experience and technology that has been gained over the research on the
different interlayers and their appropriate processing techniques has led to the realization of
high efficiency OLED pixels.
5. Acknowledgements
This work was realized in the framework of the EC project FLAME FP7 ICT-216546 in
collaboration between imec, TNO/HOLST centre, Polymer Vision and Fraunhofer IPMS. I
would like to thank K. Fehse for the simulated light output data for different anode
materials and my colleagues at imec and in the HOLST centre for their support in this work.
6. References
Fukuda, K.; Yokota, T.; Kuribara, K.; Sekitani, T.; Zschieschang, U.; Klauk, H. & Someya, T.
Thermal stability of organic thin-film transistors with self-assembled monolayers
dielectrics, Appl. Phys. Lett., Vol. 96, pp. 053302-1 – 053302-3 (2010)
Luminance 1100 cd/m
2
Organic Light Emitting Diode – Material, Process and Devices
232
Gelinck, G.H.; Huitema, H.; Edzer, A.; van Veenendaal, E.; Cantatore, E.; Schrijnemakers, L.;
van der Putten, J. B. P. H. ; Geuns, T. C. T.; Beenhakkers, M.; Giesbers, J. B.;
Huisman, B H.; Meijer, E. J.; Mena, B. E.; Touwslager, F. J.; Marsman, A. W.; van
Rens, B. J. E. & de Leeuw, D. M. Flexible active-matrix displays and shift registers
based on solution-processed organic transistors, Nat. Mater., Vol. 3,pp. 106–110
(2004)
Huitema, E.; van Veenendaal, E.; van Aerle, N.; Touwslager F.J.; Hamers, J. & van Lieshout,
P. Rollable displays — A technology development enabling breakthrough mobile
devices, SID 08 Digest, pp. 927-930 (2008)
Hwang, M.; Lee, H.S.; Jang, Y.; Cho, J.H.; Lee, S.; Kim, D.H. & Cho, K. Effect of curing
conditions of a poly(4-vinylphenol) gate dielectric on the performance of a
pentacene-based thin film transistor, Macromol. Res., Vol. 17, No. 6, pp. 436-440
(2009)
Jang, K. H.; Lee, W. J.; Kim, H. R. & Yeom, G. Y. Etching of copper films for thin film
transistor liquid crystal display using inductively coupled chlorine-based plasmas,
Japn. J. Appl. Phys., Vol. 43, (No. 12), pp. 8300-8303 (2004)
Katsuhara, M.; Yagi, I.; Noda, M.; Hirai, N.; Yasuda, R.; Moriwaki, T.; Ushikura, S.; Imaoka,
A. & Nomoto, K. A reliable flexible OLED display with an OTFT backplane
manufactured using a scalable process, SID Digest 09, pp. 656–659 (2009)
Kawashima, N.; Kobayashi, N.; Yoneya, N.; Ono, H.; Fukuda, T.; Ohe, T.; Ishii, Y.; Nomoto,
A.; Sasaki, M. & Nomoto, K. A high resolution flexible electrophoretic display
driven by OTFTs with inkjet-printed organic semiconductor, SID Digest 09, pp. 25–
27 (2009)
Lee, Y. J.; Park, S. D.; Song, B. K.; Kim, S. G.; Choe, H. H.; Hong, M. P. & Yeom, G. Y.
Characteristics of Ag etching using inductively coupled Cl
2
-based plasmas, Jpn. J.
Appl. Phys., Vol. 42, pp. 286-290 (2003)
Nguyen, P.; Zeng, Y. & Alford, T. L. J. Reactive ion etch of patterned and blanket silver thin
films in Cl
2
/O
2
and O
2
glow discharges, Vac. Sci. Technol., Vol. 17, pp. 2204-2209
(1999)
Park, S. D.; Lee, Y. L.; Kim, S. G.; Choe, H. H.; Hong, M. P. & Yeom, G. Y. Etch characteristics
of silver by inductively coupled fluorine-based plasmas, Thin Solid Films, Vol. 445,
pp. 138-143 (2003)
Vicca, P.; Steudel, S.; Genoe, J. & Heremans, P. Adhesion promoting polymer interlayers for
Ag layers
deposited in OLED processing J. Adh. Sci. Technol., Vol. 24, pp. 1145-1151 (2010)
Vicca, P.; Steudel, S.; Smout, S.; Raats, A.; Genoe, J. & Heremans, P. A low-temperature-
cross-linked poly(4-vinylphenol) gate-dielectric for organic thin film transistors,
Thin Solid Films, Vol. 519, No. 1, pp. 391-393 (2010)
Yagi, I.; Hirai, N.; Noda, M.; Imaoka, A.; Miyamoto, Y.; Yoneya, N.; Nomoto, K.; Kasahara,
J.; Yumoto, A. & Urabe, T. A full-color, top-emission AM-OLED display driven by
OTFTs, SID Digest 07, pp. 1753–1756 (2007)
9
Transparent Conductive Oxide (TCO) Films for
Organic Light Emissive Devices (OLEDs)
Sunyoung Sohn
and Hwa-Min Kim
Catholic University of Daegu
Republic of Korea
1. Introduction
Transparent conducting oxide (TCO) thin films of In
2
O
3
, SnO
2
, ZnO, and their mixtures have
been extensively used in optoelectronic applications such as transparent electrodes in touch
panels, flat panel displays (FPDs), and other future devices. The first chapter provides an
introduction to the basic physics of TCO films and surveys the various topics and challenges in
this field. It includes a description of the TCO materials used in some of the organic light
emissive devices (OLEDs) that have been studied extensively to date, the performance of
various OLEDs, and a brief outlook.
Chapter 2 focuses on TCO material development of p-type and n-type. Typical oxide kind of
TCO materials consist of In
2
O
3
, SnO
2
, and ZnO. These are applied as a TCO films with n-
type semiconducting property according to highly doped dopants which acting as a carrier.
Until today, in a n-type TCO materials, indium tin oxide (ITO) doped with SnO
2
of 10 wt.%
in In
2
O
3
has been widely commercialized. This is because the ITO film has high performance
of both good electrical conductivity of ~10
-4
Ω·cm and high transmittance of ~90% when the
ITO film is coated on glass substrate. At present, In
2
O
3
-SnO
2
(ITO) films are most commonly
used as TCO films, but they have ome disadvantages, such as high cost, instability, poor
surface roughness, and toxicity in their further applications. And amorphous ITO film
deposited at low temperature has low resistance under moist heat, which leads to a decrease
in its conductivity and light transmittance. In addition, unfortunately, the price of Indium is
dramatically increasing every day due to a mix-up between the supply and demand of raw
materials by the exhaustion of Indium source. On the other hand, some zinc-based TCO
materials have good optical and electrical properties comparable to the ITO films, as well as
low cost, high stability, excellent surface uniformity, and good etching selectivity. The zinc-
based TCO films are, therefore, regarded as promising substitutes for ITO film. In Chapter 3,
the Indium-based and Zinc-based TCO Materials, and their electrical, optical, and structural
properties will be discussed. Particularly, since more stringent specifications for TCO films
have been required for realization of both higher resolution and larger screen size of FPDs,
and preparation of high-quality TCO films at low temperature is very important to realize
advanced optoelectronic devices.
Chapter 4 will introduce the new TCO materials, such as: organic conductors like poly(3,4-
ethylenedioxy thiophene):poly(styrenesulphonicacid) (PEDOT:PSS), and the expanding
field of nanomaterials including carbon nanotubes, nanoparticles, and composite materials
combining one or more of these materials. For example, long metallic nanotubes have been
Organic Light Emitting Diode – Material, Process and Devices
234
found to have volume conductivities of ca. 700,000 S/cm, which is almost as conductive as
pure copper. Moreover, carbon nanotubes (CNTs) because of their covalent bonding do not
suffer from electromigration, which is a common problem that leads to failure in thin metal
wires and films. It is the covalent bonds of CNTs that make them thermally stable and
highly resistant to chemical damage. Therefore, these cheap and flexible transparent organic
and nano conductors can be an appropriate substitution for conventional ITO in the next
generation optoelectronic devices.
ITO films are very brittle and easily broken down by externally applied bending forces, while
the ITO films are widely used as the transparent electrode for display device. Finally, Chapter
5 mainly examines how external deformation influences the mechanical stability of ITO thin
films on flexible polymer substrates for flexible OLEDs (FOLEDs), typically in a bent state.
2. Classification of TCO materials
TCOs are very useful materials to transparent optoelectronics because they have unique
features of optical properties in the visible light region such as the transparency over ~85% and
optical band gap greater than 3 eV and controllable electrical conductivity such as carrier
concentrations of at least 10
20
cm
-3
and resistivity of about 10
-4
ohm·cm.(Kim et al., 2011)
Nowithstanding their extraordinarily wide controllable conductivity range including that of
semiconductor behavior, their applications are limited to transparent electrodes. It seems to us
that the origin of this limited application is due to a lack of p-type conducting transparent
oxide materials. TCO materials are naturally n-type degenerate semiconductors and the lack of
a high quality p-type TCO always has been the main obstacle in front of the fabrication of a
fully transparent complementary metal-oxide semiconductor(CMOS)-like devices. Although
n-type TCO such as ZnO, SnO
2
and ITO are key components in a variety of technologies, p-
type TCO are an emerging area with little work previous to four years ago. However,
realization of good TCO could significantly impact a new generation of transparent electrical
contacts for p-type semiconductors and organic optoelectronic materials and in conjunction
with n-type TCOs could lead to a next generation of transparent electronics.
2.1 p-type TCO
Since the first report of a p-type TCO was NiO, In 1997, there was a report of transparent p-
type conducting films of CuAlO
2
showing considerable improvement over NiO.(Sato et al.,
1993; Kawazoe et al., 1997) Although the conductivity of 1 S·cm
−1
was about three orders of
magnitude smaller than that of n-type materials, the result was promising. Since the discovery
of p-type conductivity in CuAlO
2
, many Cu(I) based delafossites having transparency and p-
type conductivity have been synthesized, such as CuScO
2
, CuYO
2
, CuInO
2
, CuGaO
2
, and
CuCrO
2
. Conductivity of the CuInO
2
film deposited under working oxygen pressure of 7.5
mTorr and 450
o
C was reported as 2.8x10
-3
S/cm. (Roy et al., 2003) And also, the dependence
of the electrical conductivity of CuInO
2
films upon the deposition temperature was
investigated. With increasing deposition temperature from room temperature to 600
o
C, the
conductivity increases and reaches a value of 5.8x10
-2
S/cm for the film deposited at 400
o
C
temperature. Indeed, other structures have been identified that combine p-type conductivity
and optical transparency in Cu(I) based materials, including SrCu
2
O
2
and layered
oxychalogenides (LaCuOS), although to date the p-type TCO with the highest conductivity is a
delafossite (Mg doped CuCrO
2
). Among various candidate materials, ZnO is one of the most
important members of TCOs. Like the other members (e.g.: SnO
2
, In
2
O
3
, IZO, and ITO), ZnO
Transparent Conductive Oxide (TCO) Films for Organic Light Emissive Devices (OLEDs)
235
have been applied. Among the candidates of shallow acceptors, nitrogen is the most tried one
due to its nearest-neighbor bond length of 1.88 Å that is similar to the Zn–O bond length of
1.93 Å. The p-type ZnO have been made by nitrogen using various deposition techniques like
sputtering, chemical vapor deposition (CVD), metalorganic CVD (MOCVD), pulsed laser
deposition (PLD) and spray pyrolysis (SP). (Huang et al., 2010) Growing p-ZnO was an
important milestone in ‘‘Transparent Electronics’’, allowing fabrication of wide band gap p-n
homo-junctions, which is a key structure in this field. It was anticipated that higher
conductivity and optical transmission could be obtained by ZnO doped with N, F, P, Sb, and
As. In this section, we discussed the necessary requirements in the electronic energy band
structure and crystal structure with Cu based p-type TCO. The chemical formula of
delafossites is AMO
2
in which A is the monovalent cation and M is a trivalent cation.
Delafossites have a hexagonal, layered crystal structure: the layers of a cations and MO
2
are
stacked alternately, perpendicular to the c-axis. As a class, p-type materials now include the
copper-based delafossites CuMO
2
.
Fig. 1 shows the schematic representation of the necessary electronic configuration of the
cationic species. In this combination, considerable covalency can be expected for both the
bonding and anti-bonding levels. The valence band edge shifts from the 2p levels of oxygen
ions to the anti-bonding levels because both the cation and anion have a closed shell
electronic configuration. It should be noted that the localization nature of the valence band
edge is greatly reduced by the modification. Cu and Ag have the appropriate d
10
states for
this purpose.(Sheng et al., 2006)
Fig. 1. Schematic of the chemical bond between an oxide ion and a cation that has a closed
shell electronic configuration.
The metal states interact with some of the O 2p states, which push up a more dispersive
band above the non-bonding O 2p or Cu 3d states. Tetrahedral coordination of oxide ions is
advantageous for p-type conductivity, as it acts to reduce the localization behavior of 2p
electrons on oxide ions. The valence state of the oxide ions can be expressed as sp
3
in this
conformation. Since the Cu
2
O has a rather small band gap(Eg) of 2.17 eV, we found that the
Organic Light Emitting Diode – Material, Process and Devices
236
Eg of p-type TCO should be greater than 3.1 eV. Hence enlargement of the band gap would
be another structural requirement for designing p-type TCOs, so that there is no absorption
of visible photons. Two families of Cu based TCOs have been developed from this idea,
CuMO
2
(M = Al, Ga, In, Sc, Cr, Y, B, etc.) with the delafossite structure and the non-
delafossite structure SrCu
2
O
2
, LaCuOCh (Ch = chalcogen). The band structural properties of
these materials were calculated in detail by Nie et al., Robertson et al., and Ueda et al.(Sheng
et al., 2006)
2.1.1 CuBO
2
A study by Snure and Tiwari has identified a new group 13 delafossite, CuBO
2
, as a new p-
type TCO.(Snure & Tiwari, 2007) In this study, a density functional theory (DFT) study are
measured, and examining the detailed electronic structure of CuBO
2
.(David et al., 2009) This
group show conclusively that (i) the lattice parameters reported by Snure and Tiwari are not
consistent with previous experimental trends and need to be reinvestigated, (ii) the valence
band features of CuBO
2
are consistent with other delafossite p-type TCOs, (iii) the effective
hole masses of the valence band maximum(VBM) are consistent with the reported good
conductivity, and (iv) the predicted indirect band gap and optical band gap of CuBO
2
are
3.21 eV and ~5.1 eV, respectively. The GGA + U calculated bandstructure of CuBO
2
along
the high symmetry lines taken from Bradley and Cracknell is shown in Fig. 2. The VBM is
situated at the F point, while the conduction band minimum(CBM) lies at Γ, giving an
indirect band gap of 1.94 eV, with the smallest direct band gap situated at Γ and measuring
3.21 eV.
Fig. 2. GGA+U calculated bandstructure of CuBO
2
. The top of the valence band is set to 0 eV.
To gain a deeper understanding of the band structure features, we have plotted projections
of the wave function for the VBM at F and the CBM at the Γ point through a (001) plane
containing Cu, B, and O atoms, labeled (b) and (c) in Fig. 3. (David et al., 2009) Anumerical
breakdown of the states at the VBM shows that it contains ~67% Cu d character and ~31%
oxygen p character, with B states effectively playing no role in the VBM makeup at F. This is
Transparent Conductive Oxide (TCO) Films for Organic Light Emissive Devices (OLEDs)
237
further evidenced by the charge density plot of the VBM (Fig. 3b) which clearly shows d-like
orbitals on the Cu ions and p-like orbitals on the O ions, with the absence of any density on
the B states.
Fig. 3. Charge density contour plots showing the band edges of CuBO
2
through a (001)
plane. (a) Structure of the cell in the (001) plane, (b) charge density of the VBM at F, and (c)
charge density of the CBM at Γ, plotted from 0 eV(blue) to 0.003 eV(red) e·A
-3
.
2.1.2 CuAlO
2
Kawazoe et al. first reported synthesis of CuAlO
2
das a p-type TCO material based on the
copper I oxides such as CuAlO
2
, CuGaO
2
, and SrCu
2
O
2
with chemical modulation of valence
band.(Kwwazoe et al., 1997) In spite of several merits of CuAlO
2
as a p-type TCO, the main
hurdle is its low electrical conductivity compared to the n-type TCO. Therefore, different
methods such as high temperature solid-state reaction, hydrothermal method, ion
exchanges, and sol-gel method etc. have been proposed to prepare CuAlO
2
.(Ghosh et al.,
2009) Each copper atom of CuAlO
2
is linearly coordinated with two oxygen atoms to form
an O–Cu–O dumbbell unit placed parallel to the c-axis. Oxygen atoms of the O–Cu–O
dumbbell link all Cu layers with the AlO
2
layers. After the report of p-type semiconducting,
transparent CuAlO
2
thin film, a research field in device technology has emerged, called
‘transparent electronics’. For the synthesis of CuAlO
2
thin films, the groups of Hosono,
Gong, and Chattopadhyay used pulsed laser deposition, plasma-enhanced metalorganic
chemical vapor deposition(PE-MOCVD), and dc sputtering, respectively.(Sheng et al., 2006)
The electronic structures of CuAlO
2
were experimentally probed by normal/inverse
photoemission spectroscopy(PES/IPES). The Fermi energy determined experimentally was
set to zero in the energy scale in the three spectra, as shown in Fig. 4.
A band gap was observed between the valence band edge in the PES spectrum and the
conduction band edge in the IPES spectrum. The band gap estimated was about 3.5 eV. The
Fermi energy lies around the top of the valence band. The origin of the energy axis is the
Fermi level which was determined using Au deposited on sample. These results means that
Organic Light Emitting Diode – Material, Process and Devices
238
CuAlO
2
is a transparent p-type semiconducting material, which has excellent potential for
use in optoelectronics device technology. Fig. 5 shows the emission current (I) versus
macroscopic field(E) curve of CuAlO
2
thin films deposited on glass substrate as a function of
the anode-sample separations(d).(Banerjee & Chattopadhyay, 2004)
Fig. 4. Photoemission and inverse photoemission spectra of the valence and conduction
region of CuAlO
2
.
Fig. 5. Plot of emission current versus macroscopic field of CuAlO
2
thin film on glass
substrate.
Transparent Conductive Oxide (TCO) Films for Organic Light Emissive Devices (OLEDs)
239
2.1.3 CuGaO
2
CuGaO
2
is a p-type TCO with E
g
of ~3.6 eV. CuGaO
2
has a larger lattice constant of the a-
axis, a = 2.98 A, than CuAlO
2
(a = 2.86 A). A polycrystalline thin film of CuGaO
2
prepared
by rf sputtering method was obtained in an amorphous state by post-annealing for
crystallization at 850 °C for 12 h under nitrogen atmosphere. And its activation energy was
roughly estimated to be about 0.22 eV. The conductivity at room temperature was about
5.6×10
−3
S·cm
-1
.(Sheng et al., 2006) The electrical conductivity, carrier (positive hole) density,
and Hall mobility of epitaxial CuGaO
2
films at room temperature were respectively 6.3 ×
10
−2
S·cm
-1
, 1.7 × 10
18
cm
3
, and 0.23 cm
2
·V
-1
·s
-1
, which were prepared on a-Al
2
O
3
(001) single-
crystal substrates by PLD without post-annealing treatment and it were superior to those of
the polycrystalline thin films of CuGaO
2
. The films were grown epitaxially on the substrates
in an as-deposited state. The films have high optical transparency (~80%) in the visible
region, and the energy gap of CuGaO
2
for direct allowed transition was estimated to be 3.6
eV.(Ueda et al., 2001)
2.1.4 CuInO
2
The CuInO
2
system, which is copper-based delafossites, has been particularly interested
because it can be doped both p-type (with Ca) and n-type (with Sn), allowing p–n
homojunctions to be produced by applying doping of an appropriate impurity and tuning
the deposition conditions.(Yanagi et al., 2001a, 2002b) On the other hands, no similar trend
like CuInO
2
has ever been observed in any other semiconductors because it has the largest
reported band gap of 3.9 eV. The conductivity of CuInO
2
films reported by Yangagi et al.
shows about ~10
−3
S cm
-1
when it was grown by PLD from phase-pure CuInO
2
targets.(Yanagi et al., 2001) It has been smaller than that of the other p-type TCOs. However,
Teplin et al. used Cu
2
In
2
O
5
as a target to deposit single phase undoped and Ca-doped
CuInO
2
thin films because the oxygen-rich Cu
2
In
2
O
5
phase of Cu–In–O is easily prepared by
solid-state synthesis in air.(Teplin et al., 2004)
2.1.5 SrCu
2
O
2
SrCu
2
O
2
(SCO) is one of the few non-delafossite p-type oxides. In some groups, the
properties of SCO deposited under working oxygen pressure of 5.25 x 10
-3
mTorr and 300
o
C
are measured. Roy et al. reported the performance of SCO films with copper formate
(Cu(CH
3
COO)
2
) and strontium acetate (Sr(CH
3
COO)
2
), which were chosen as starting
precursors.(Roy et al., 2003) Stoichiometric amounts of Copper formate and Strontium
acetate were prepared as separate aqueous solutions and mixed just before application
(otherwise copper acetate precipitated) and were sprayed on quartz substrates at ~250 °C.
Non-doped and K-doped p-type SCO thin films were first deposited by Kudo et al.(Kudo et
al., 1998) And the PLD technique has been used to fabricate Ca-doped SCO thin films on
quartz glass substrates. In case of the synthesis of SCO, a p-type transparent conducting
oxide by a chemical solution route as well as the conventional PLD method, for SCO
by the
chemical solution route, samples were made by spraying deposition on quartz substrates
using an aqueous solution of copper formate and strontium acetate. The X-ray
diffraction(XRD) spectra of as-deposited thin-film samples for different substrate
temperatures had only single (202) peak of SCO films.(Sheng et al., 2006) In this case, as
increase the deposition temperature, the intensity of the (202) peak was increased. And also,
the transmittance of SCO films is observed to depend on deposition temperature. On
increasing the deposition temperature, the average transmission was decreased. The (αhν)
2
Organic Light Emitting Diode – Material, Process and Devices
240
versus hν plot is shown, from which the direct allowed band gap can be estimated; it was
found to be about 3.2 eV for films deposited at 350 °C. The conductivity of the film
deposited in room temperature was obtained as 8.2 × 10
-2
S cm
-1
, which is decreased as 5.4×
10
-2
S cm
-1
deposited at 400
o
C.(Roy et al., 2003)
2.2 n-type TCO
While the development of new TCO materials is mostly dictated by the requirements of
specific applications, low resistivity and low optical absorption are always significant pre-
requisites. There are basically two strategies in managing the task of developing advanced
TCOs that could satisfy the requirements. The main strategy dopes known binary TCOs
with other elements, which can increase the density of conducting electrons. More than 20
different doped binary TCOs were produced and characterized by n-type TCOs , of which
ITO was preferred, while Al-doped ZnO (AZO) and Ga or Ga
2
O
3
-doped ZnO (GZO) come
close to it in their electrical and optical performance. The TCOs have been intensively
studied for their potential in optoelectronic applications, including for the manufacture of
OLEDs. It has been well known that ITO is the most popular TCO, because of its high
conductivity and transparency.(Kim et al., 1996) However, its chemical instability, toxic
nature and high cost, combined with the diffusion of indium into surrounding organic
materials, have stimulated efforts to find an alternative.(Kim et al., 2000)
Among these materials, one of most promising candidates is AZO which has sufficiently
high conductivity and a transmittance of over 90% in the visible range, even in samples
grown at room temperature.(Chem et al., 2000) Recently, it has been reported that optimized
AZO films could replace ITO as an anode material in OLED applications. In comparison
with ITO, AZO films are more stable in reducing ambient circumstance, more readily
available, and less expensive. Because of these characteristics, AZO is often used as an
anode material in photoelectronic devices such as solar cells, flat panel displays and OLEDs.
(Yang et al., 1998; Ott & Chang, 1999; Wang et al., 2006; Deng et al., 1999) Previously, we
reported that the AZO can be successfully adopted as a TCO on a flexible polymer
polyethersulphone (PES) substrate for flexible OLED application.(Park et al., 2007) Because
the anode materials in an OLED are in contact with organic molecules, both their surface
chemical properties and their morphology affect the adhesion and alignment of molecules
on the surface.(Guo et al., 2005)
Therefore, a microscopic understanding of wettability in solid surfaces is fundamentally
interesting and practically valuable. Furthermore, the absorption of water on metal-oxide
surfaces is an important subject in its own right, due to its crucial role in gas sensors,
catalysis, photochemistry and electrochemistry. It is well known that the measurement of
water contact angle (WCA) could reveal much useful information about characteristics of
surface nanostructure and morphology.(Soeno et al., 2004) However, there have been few
studies of the surface wettability of the transparent conducting oxide AZO thin film. AZO
films with resistivity of ~8.5.10
-5
W·cm was reported by Agura et al.(Agura et al., 2003) An
even lower resistivity was reported for GZO, ~8.1 x 10
-5
W·cm.(Park et al. 2006) This r is
very close to the lowest resistivity of ITO of 7.7x10
-5
W·cm, with a free carrier density of
2.5x10
21
cm
-3
.(Ohta et al., 2000) The phase-segregated two-binary systems include ZnO-
SnO
2
, CdO-SnO
2
, and ZnO-In
2
O
3
. In spite of the expectations, the electrical and optical
properties of the two-binary TCOs were much inferior to those of ITO. Accordingly, the
ternary TCO compounds could be formed by combining ZnO, CdO, SnO
2
, InO
1.5
and GaO
1.5
to obtain Zn
2
SnO
4
, ZnSnO
3
, CdSnO
4
, ZnGa
2
O
4
, GaInO
3
, Zn
2
In
2
O
5
, Zn
3
In
2
O
6
, and Zn
4
In
2
O
7
.