báo cáo hóa học: " Differential aquaporin 4 expression during edema build-up and resolution phases of brain inflammation" doc
Bạn đang xem bản rút gọn của tài liệu. Xem và tải ngay bản đầy đủ của tài liệu tại đây (3.78 MB, 16 trang )
RESEARC H Open Access
Differential aquaporin 4 expression during edema
build-up and resolution phases of brain inflammation
Thomas Tourdias
1,2*
, Nobuyuki Mori
1
, Iulus Dragonu
3
, Nadège Cassagno
1
, Claudine Boiziau
1
, Justine Aussudre
1
,
Bruno Brochet
1
, Chrit Moonen
3
, Klaus G Petry
1†
and Vincent Dousset
1,2†
Abstract
Background: Vasogenic edema dynamically accumulates in many brain disorders associated with brain
inflammation, with the critical step of edema exacerbation feared in patient care. Water entrance through blood-
brain barrier (BBB) opening is thought to have a role in edema formation. Neve rtheless, the mechanisms of edema
resolution remain poorly understood. Because the water channel aquaporin 4 (AQP4) provides an important route
for vasogenic edema resolution, we studied the time course of AQP4 expression to better understand its potential
effect in countering the exacerbation of vasogenic edema.
Methods: Focal inflammation was induced in the rat brain by a lysolecithin injection and was evaluated at 1, 3, 7,
14 and 20 days using a combination of in vivo MRI with apparent diffusion coefficient (ADC) measurements used
as a marker of water content, and molecular and histological approaches for the quantification of AQP4 expression.
Markers of active inflammation (macrophages, BBB permeability, and interleukin-1b) and markers of scarring (gliosis)
were also quantified.
Results: This animal model of brain inflammation demonstrated two phases of edema development: an initial edema
build-up phase during active inflammation that peaked after 3 days (ADC increase) was followed by an edema
resolution phase that lasted from 7 to 20 days post injection (ADC decrease) and was accompanied by glial scar
formation. A moderate upregulation in AQP4 was observed during the build-up phase, but a much stronger
transcriptional and translational level of AQP4 expression was observed during the secondary edema resolution phase.
Conclusions: We conclude that a time lag in AQP4 expression occurs such that the more significant upregulation
was achieved only after a delay period. This change in AQP4 expression appears to act as an important
determinant in the exacerbation of edema, considering that AQP4 expression is insufficient to counter the water
influx during the build-up phase, while the second more pronounced but delayed upregulation is involved in the
resolution phase. A better pathophysiological understanding of edema exacerbation, which is observed in many
clinical situations, is crucial in pursuing new therapeutic strategies.
Keywords: Aquaporin 4, Blood brain barrier, Brain edema, Inflammation, Magnetic resonance imaging
Background
Brain vasogenic edema is of central importance in the
pathophysiology of a wide range of brain disorders [1].
In many pathologies, vasogenic edema is a highly
dynamic process with phases of significant water accu-
mulation and subsequent reduction. This process is seen
in infectious and inflammato ry disorders such as ence-
phalitis, with edema peaking during the active phase.
Other examples include severe stroke [2] and brain
trau ma [3], which are accompa nied by vasogenic edema
peaking at about 72-96 hours after insult and the risk
for a signifi cant elevation of interstitial pressure, hernia-
tion and death. A better understanding of the pathophy-
siologyofsuchexacerbationofedemaiscrucialin
pursuing new therapeutic strategies.
Edema pathophysiology can be viewed as a balance
between formation and resolution [4]. Most research on
* Correspondence:
† Contributed equally
1
INSERM U.1049 Neuroinflammation, Imagerie et Thérapie de la Sclérose en
Plaques, F-33076 Bordeaux, France
Full list of author information is available at the end of the article
Tourdias et al. Journal of Neuroinflammation 2011, 8:143
/>JOURNAL OF
NEUROINFLAMMATION
© 2011 Tourdias et al; licensee BioMed Central Ltd. This is an Open Access article distributed under the terms of the Creative
Commons Attribution License ( which permits unrestricted use, distribution, and
reproduction in any medium, provided the origi nal work is properly cited.
this topic has concentrated on edema fluid formation. It
has been established that breakdown of the blood-brain
barrier (BBB) to plasma proteins is the leading determi-
nant of water accumulation within the extracellular space
[5]. Numerous and frequently interdependent mechan-
isms can contribute to the loss o f BBB integrity [2]. One
important common determinant of increased paracellular
permeability is brain inflammation. Because brain inflam-
mation occurs in a phasic manner, water entrance sec-
ondary to inflam mation is thought to contribute to t he
ongoing clinical exacerbation that is observed following
stroke, trauma or encep halitis [6]. In contrast, less is
known about the mechanisms of edema fluid elimination.
Edema fluid can be cleared into the cerebrospinal fluid
(CSF) in the subarachnoid space or ventricles, or it can
be cleared back into the blood [7]. All of these exit routes
strongly express the selective water channel transporter
aquaporin 4 (AQP4) [8]. Experiments that were con-
ducted on AQP4-null mice have shown that AQP4-
dependent transmembrane movements into the CSF and
blood are dominant mechanisms for clearing excess
brain water in vasogenic edema [9-11]. Therefore, the
regulation of AQP4 expression could be an important
determinant of the overall water content based on its
involvement in the resolution of edema. There have been
several reports of altered AQP4 expression in astrocytes
in cases of brain edema [8]. The severity of the disease
producing interstitial edema was associated with the
upregulation of AQP4, which could potentially be a pro-
tective mechanism for countering edema accumulation
[12]. Nevertheless, a precise temporal course of this
AQP4 upregulation during the build-up and resolution
phases in the dynamic evolution of vasogenic edema in
vivo is still lacking.
Thisstudysoughttodeterminethetimecourseof
AQP4 expression in direct relation to interstitial water
content. More specifically, we questioned whether
AQP4 was differentially modulated during edema forma-
tion and resolution. We chose an inflammatory model
because brain inflammation can be considered as a com-
mon determinant of vasogenic edema formation and
exacerbation in many disorders, and we used magnetic
resonance imaging (MRI) to assess in vivo the water
content that was directly related to AQP4 expression.
We found the more significant transcriptional and trans-
lational upregulation of AQP4 only during the edema
resolution phase, with AQP4 being potentially insuffi-
cient to counter the excess water accumulation that
occurs during the initial edema build-up phase.
Methods
Animal model of inflammatory vasogenic brain edema
All of the experiments were performed in accordance
with the European Union (86/609/EEC) and French
National Committee (87/848) recommendations (animal
experimentation permission: France 33/00055). Male
Wistar rats weighing 250-300 g were maintained under
standard laboratory conditions with a 12-hour light/dark
cycle. Food and water were available ad libitum.
A stereotaxic injection of L-a-lysophosphatidylcholi ne
(LPC) stearoyl (Sigma, France) was used to create a
focal demyelination that was associated with an inflam-
matory reaction around t he site of the injection with a
breakdown of the BBB [13]. Rats were anesthetized with
an intrap eritoneal injection of pentobarbit al (1 ml/kg of
a 55 mg/ml solution i.p.) and were immobilized in a
stereotaxic frame (David Kopf, California). Injection
coordinates were measured from the bregma to target
the right internal capsule and were 1.9 mm posterior,
3.5 mm lateral and 6.2 mm deep. A 33-gauge needle
attached to a Hamilton syringe that was mounted on a
stereotaxic micromanipulator was used to inject LPC
through a small hole drilled into the skull. An inje ction
of 20 μl of 2% LPC (previously diluted with sterile
serum and 0.01 M guanidine to increase its solu bility
and diffusion) was conducted slowly over a 60-minute
period. Onc e the solution was infused, the cannula was
slowly removed, and the incision was stitched. The day
of injection was assigned as day 0.
Four groups of animals were studied at five time
points following th e LPC injection: 1, 3, 7, 14 and 20
days post-injection (dpi). The first group of animals (n =
25) underwent MRI and was sacrificed at the predefined
time points (n = 3 to 6 per group) with an intracardiac
perfusion of 4% paraformaldehyde (PFA) in 0.1 M phos-
phate-buffered saline (PBS) to assess MRI-co-registered
histological an alyses. A second group was injected with
NaCl 0.9% and guanidine 0.01 M but without LPC
(sham animals, n = 10) and followed by MRI prio r to
histological analyses (n = 2 rats per time point (t), with
one additional MRI scan at the previous time point (t-1)
per rat, i.e. n = 4 MR scans per time point). The third
group of animals (n = 24) was sacrificed prior to (basal
expression) and at the same time points after LPC injec-
tion (n = 3 to 5 per group) to collect fresh brains for
the measurement s of AQP4 expression by reverse tran-
scription quantitative real-time PCR (RT-qPCR) and
western blot experiments. The last group of animals (n
= 15 with n = 3 per group) was used to study the
patency of the BBB by the quantification of Evans blue
extravasation according to a previously published
method [9].
MR Imaging
MRI protocol
Animals were investigat ed with MRI at 1, 3, 7, 14 or 20
dpi (assigned as time (t)) and then immediately sacri-
ficed. The same animals were also inve stigated with
Tourdias et al. Journal of Neuroinflammation 2011, 8:143
/>Page 2 of 16
MRI at the prior time point (t-1) to allow for the com-
parison of the data obtained at a single time points from
two different series of rats and to consequently ensure
the required level of reproducibility i n the model for
extrapolating longitudinal curv es. Five animals that were
sacrificed at later time point s (14 and 20 dpi) were
further s canned with MRI three times to longitudinally
illustrate the time course of edema and to confirm the
cross-sectional data ( totalMRI,n=49).Imageswere
obtained using a 1.5-Tesla magnet (Philips Medical Sys-
tem, Best, Netherlands) equipped with high-performance
gradients, using a superficial coil (23-mm diameter).
Anesthesia was induced with pentobarbital (1 ml/kg of a
55 mg/ml solution i.p.), and coronal sections were
obtained using T2- and diffusion-weighted imaging
(DWI).
T2-weighted images (T2WI) were obtained using the
following parameters: fast spin-echo sequence, 10 slices,
1.5-mm thick, FOV = 5 × 1.75 cm
2
, reconstructed
matrix = 256
2
,TR/TE/a = 1290/115 ms/90°, TSE factor
= 12, NEX = 22, duration = 6 min, 42 s.
DWI was performed with a multi-shot spin-echo Echo
Planar Imaging sequence using the following para-
meters:10slices,1.5-mmthick,FOV=5×1.75cm
2
,
reconstructed matrix = 128
2
,TR/TE/a = 2068/43 ms/
90°, EPI factor = 3, NEX = 2, duration = 8 min, 10 s.
Gradients with two different b values (0 and 600 s/
mm
2
) in the x, y and z axes were used. By averaging the
images obtained for the three diffusion-weighted direc-
tions (b = 600 s/mm
2
), trace DWIs were genera ted for
each sectio n with the corresponding apparent diffusion
coefficient (ADC) map.
MR image analysis
We used ADC, which reflects the Brownian motion of
water molecules and indirectly water content, to moni-
tor disease progression. Data processing was performed
with ImageJ software (NIH freeware, .
gov/ij/).
The le sion was assessed as high signal intensity on the
T2WI. We first manually delineated the right internal
capsule hypersignal on t he T2WI. Within this delinea-
tion, the final lesion was automatically defined using a
threshold > mean + 2 × SD as derived from the corre-
sponding area in the unaffected hemisphere. This mask
was propagated on ADC maps to measure the mean
ADC lesion. As an LPC injection can create a central
cavity ( necrosis) at the injection site with inflammation
developing at the periphery, an upper AD C threshold
(1700 μm
2
/s) was used to eliminate these voxels. In a
separate analysis, cavitation as assesse d by the area of
pixels with a fluid-like signal (ADC > 1700 μm
2
/s), was
measured over time. All MRI data were the n re-read
with the corresponding histology to ensure a direct sym-
metry between the region of interest (ROI) for the ADC
and the histological parameters and to address a direct
MRI/histological comparison. The mean ADC was also
measured in the s ymmetric contralateral hemisphere
with the same threshold.
Histology
Rats were sacr ificed for histological examination imme-
diately following the final MR exam. Brains were
removed following PFA perfusion, post-fixed for 24 h in
the same fixative and then a 5 -mm block across the
injection mark was cut (coronal sections, 30-μmthick)
with a vibratome (Leica, Switzer land). The extent of the
parenchyma alteration was evaluated using luxol fast
blue Kluver Barrera coloration to detect myelin and
nuclear cells. Immuno staining was performed against
AQP4, ED1 and Iba1 (for macrophages and microglia),
IgG (for serum protein accumulation secondary to BBB
alteration) and GFAP (for astrocytes).
Immunostaining
For immunohistochemistry, we u sed affinity-purified
mouse monoclonal antibodies for ED1 (Serotec, 1/100)
and rabbit polyclonal antibodies for AQP4 and GFAP
(Sigma, 1/100 and Dako, 1/1000, respe ctively). Immu-
nostaining was conducted in PBS containing 0.1% Tri-
ton X-100 and 3% swine serum. Revelation was
performed with diaminobenzidine (DAB; Vector Kit,
Vector Laboratories, USA) and nickel. Floating sections
were rinsed, mounted on slides, and cover-slipped with
Eukit medium.
For immunofluorescence, double-labeling was per-
formed using a mixture of two primary antibodies
[(polyclonal anti-AQP4 1/100 and monoclonal anti-
GFAP 1/1000) or (polyclonal anti-Iba1 (Wako, 1/1000)
and monoclonal anti-ED1 1/1000)] overnight at 4°C fol-
lowed by a mixture of two secondary antibodies (anti-
rabbit coupled to CY3 (Sigma, 1/300) and anti-mouse
coupled to Alexa 488 (Sigma, 1/2000 or 1/1000)) for 2 h
at room temperature (RT). For IgG leakage staining
within the brain parenchyma, sections were incubated
for 2 h at RT with an Alexa-488-conjugated affinity-pur-
ified donkey anti-rat IgG antibody (Invitrogen, 1/500).
Immunofluores cence sections were mounted and cover-
slipped using the VectaShield mounting medium (Vec-
tor Laboratories). For all immunostaining experiments,
the staining specificity was examined by omitting the
primary antibody during the corresponding incubation.
Immunostaining analysis
For comparison, both MRI and histological sections
were perpendicular to the flat skull position. AQP4
immunolabeling was evaluated on serial slices that cor-
responded to the MRI acquisitions (three to four slices)
using ImageJ software at the same level as the MRI
measurements. Double staining for AQP4 and GFAP
was examined using confocal laser scanni ng microscopy
Tourdias et al. Journal of Neuroinflammation 2011, 8:143
/>Page 3 of 16
(Leica DM2500 TCS SPE on a upright stand, Leica
Microsystems, Germany) using the following objectives:
HCX PL Fluotar 20X oil NA 0.7 and HCX Plan Apo CS
40X oil NA 1.25 and diodes laser (488 nm, 532 nm).
AQP4 immunoreactivity was quantified in three differ-
ent fields (345 μm
2
)thatwerepositionedwithinthe
lesion excluding central cavitation, and symmetrically
within the left hemisphere. The analysis was performed
on 0.7 μm thick images (n = 8 z positions for each
field), keeping a constant laser power and gain. AQP4
staining was thresholded to eliminate background sig-
nals, and t he results are reported as the mean area of
immunoreacti vity. The resu lts were further controlled
using the ImageJ “mean gray” tool on raw images (non-
treated images) and reported as a ratio using “ mean
gray” in the contralateral hemisphere. There was no
change in AQP4 expression in the contralateral internal
capsule of LPC rats (nor in the sham group), consistent
with a previous focal infectious/inflammato ry model of
brain a bscess that displayed AQP4 modification only in
a ring surrounding the lesion [9]. Thus, ratio analysis
using the contralateral hemisphere as an internal refer-
ence was appropriate to minimize the confounding
effects of possible diffe rences in fixation efficiency from
one animal to another. The same procedure was used
for GFAP and ED1 labeling by looking at the mean
immunoreactivity of the slices revealed by DAB within
lesioned and contralateral fields. ED1/Iba1 and IgG
immunofluorescence preparations were examined by
epifluorescence microscopy (Nikon) using the 488-nm
(Alexa) and 568-nm (C Y3) channels. For IgG staining,
full sections were digitized with a CCD camera coupled
to the microscope to measure the area of BBB leakage
on six slices covering the entire lesion.
RT-qPCR experiments
We quantified AQP4 mRNA along with interleukin-1b
(IL1b) as a mar ker of active inflammation and GFAP
(astrocytes) as a marker of glial scarring following the
MIQE guidelines [14]. Brains were freshly extracted fol-
lowing transcardiac PBS per fusion. A 3-mm-thick coro-
nal section (approximately -0.4 mm to -3.4 mm from
the bregma) was dissected around the injection mark.
Macro-dissection of the tissue bordering the internal
capsule was performed with a 3-mm-core unipunch in
the l esioned and contralateral side. Tissue samples
(mean weight 40 to 50 mg) were immediately snap-fro-
zen in liquid nitrogen vapor, stored at -80°C, and RNA
was isolated using Trizol reagent (Sigma) according to
the manufacturer’ s protocol and re-suspended in 20 μl
RNase free water. The RNA concentration was calcu-
lated by spectrophotometric analysis (NanoDrop;
Thermo Sc ientific). The quali ty of extraction was
assessed by the A260/A280 and A260/A230 ratios,
which were always ≥1.8, and by electrophoresis on a
1.5% agarose gel. The absence of significant DNA con-
tamination was assessed with a no-reverse trans cription
assay.
50 ng of RNA was reverse-transcribed to cDNA using
Sensiscript
®
reverse transcriptase (Qiagen, France) for
AQP4 and GFAP and 2 μg of RNA was reverse-tran-
scribed using Omniscript
®
(Qiagen, France) for IL1 b.
Reverse transcription was carried out in a total volume
of 20 μl containing 2 μl oligo dT, 5 μMin2μlof5mM
dNTP and 1 μl reverse transcriptase in 2 μl 10x buffer
diluted in distilled water. The reaction was allowed to
proceed at 37°C for one hour and was terminated by
heating to 95°C for three minutes.
The primer sequences for the PCR reactions are
shown in the Table 1. Samples from each rat were run
in tripli cate and quantified using a Bio-Rad iCycler real-
time PCR system. Each sample consisted of 5 μlcDNA
diluted 1/20, 12.5 μl Mesa Green qPCR buffer (Taq
DNA polymeras e, reactive buffer, dNTP mix, 4 mM Mg
Cl
2
and SYBR Green I from Eurogentec, France), 0.25 μl
each of forward and reverse primer (10 μMworking
dilution) in double distilled water to a final volume of
25 μl. The amplification protoco l cons isted of one cycle
at 95°C for 3 min, followed by 40 cycles at 95°C for 10
sec, 65°C for 1 min, and finished by 55°C for 30 sec.
Specificity previously assessed in silico (BLAST software)
was confirmed by electrophoresis and the observation of
asinglepeakaftertheMelt
®
procedure. Quantification
cycles (Cq) were determined with the Bio-Rad software
and the Cq of the no-template control was always >40.
The results were analyzed using the comparative Cq
method for the experimental gene of interest normalized
against the reference gene GAPDH [15], which showed
an invariant expressi on under the experimental condi-
tions described (standard deviation of GAPDH Cq <0.5).
Western blot
Proteins were extracted from the phenol-chloroform
phase of the Trizol procedure and homogenized in 1%
SDS. Protein quantification was performed using the
Micron BCA™ protein a ssay reagent kit (Pierc e). Pro-
tein samples (7 μg) were separated by an SDS PAGE gel
(10%) at 100 V for 80 min on a minigel system (Bio-
Rad). Proteins were then transferred from the gel t o a
PVDF membrane (Immobilon-P transfer membrane,
Millipore) at 100 V for 80 min. Non-specific sites on
the membrane were blocked one hour at RT in a milk
solution diluted in TBS/Tween. Primary AQP4 antibo-
dies (1/500) and rabbit anti-actin antibodies (Sigma, 1/
4000)wereappliedtothemembraneforonehourat
RT, followed by four rinses with TBS/Tween and a one
hour incubation with 1/16000 dilution of peroxidase-
labeled goat anti-rabbit at RT. Immuno-reactive bands
Tourdias et al. Journal of Neuroinflammation 2011, 8:143
/>Page 4 of 16
were visualized using the ECL detection system (Pierce),
and the intensities were determined by densitometry at
bands of approxima tely 31 KDa for AQP4. Lane loading
differences for each sample were controlled for by the
normalization to the corresponding actin signal.
Evans blue extravasation
At the defined time points (1, 3, 7, 14 and 20 dpi; n = 3
per time po int), 40 mg /kg of Evans blue dye (s olution
20 mg/ml) was injected via the tail vein. After 2 h, the
brains were extracted following a PBS perfusion that
was used to eliminate any circulating Evans blue. The
tissue was homogenized in 700 μlofN;N-dimethylfor-
mamide (Merck). The homogenate was centrifuged at
16000 g at 4°C for 20 min, and the supernatant was
plotted in triplicate in a 96-well flat-bottom plate. The
amount of Evans blue was measured spectrophotometri-
cally at the 620 nm wavelength and determined by a
compariso n with readings obtained from standard solu-
tions Data was expressed as μg Evans blue per g brain
tissue . Prior to brain homog enization, representative
qualitative images of Evans blue extravasation from PBS
perfused brains were taken using a digital camera.
Statistical analysis
Analyses were performed using R s oftware (version
2.11.1). All data are presented as the mean ± SD or as
medians and quartiles (Q1-Q3). For the edema time
course, we first compared ADC in the injured hemi-
sphere at 1 dpi to corresponding values taken in the
contralateral hemisphere using the Wilcoxon test. We
then compared ADC in the injured hemisphere from
one point with another (1, 3, 7, 14 and 20 dpi) to
explore the time course usi ng a one-way analysis of var-
iance (ANOVA) with the Bonferroni post-hoc test.
From these analyses, we defined an edema build-up
phase (significant ADC increase) and a resolution phase
(significant ADC decrease). AQP4 and other markers
(IgG, IL1b, GFAP, ED1, Evans blue amount, cavitation
pixels with ADC > 1700 μm
2
/s) w ere studied over time
by applying the same procedure. These molecular mar-
kers were compared between the MRI-defined build-up
and resolution phases using the Mann-Whitney test. P
values <0.05 were considered significant.
Results
Time course of LPC-induced lesions
In the sham treated group, ADC values were stable over
time. Similarly, the MRI evaluation within the non-
injected left inter nal capsule of LPC rats showed no T2
abnormalities and stable ADC values that were not dif-
ferent from those measured in the sham group (median
ADC = 951.2 μm
2
/s for sham vs. 950.8 μm
2
/s for con-
tralateral LPC; p = 0.54; Figure 1). Together, these d ata
validate the contralateral side of LPC rats as an intra-
individual control for each animal.
Within the right (injured) hemisphere of LPC rats,
ADC values varied over time, and we identified two dis-
tinct phases: (i) an initial edema build-up phase and (ii)
a later resolution phase. At the earlier time points (1
and 3 dpi), large areas of T2 signal increase were
observed spreading within the internal cap sule and also
within other white matter tracts, such as the medial
lemniscus a nd extramedullary lamina tracts toward the
midline (Figure 1). At later time points (7, 1 4 and 20
dpi), the T2 hypersignal decreased and, occasionally
showed a persistent cavitation area at the site of injec-
tion (Figure 1). Such cavitations (pixel with ADC value
> 1700 μm
2
/s) were small and were signific antly
increased only at 20 dpi (mean area = 4.28 mm
2
,p=
0.005). Quantitative analysis of the edema time course
with DWI confirmed a significant variation in ADC over
time (ANOVA, F = 5.21, Df = 4, p = 0.005), with a sig-
nificant increase as early as 1 dpi (p = 0.006), a peak at
3 d pi and a secondary decrease between 3 and 7 dpi (p
= 0.015). The ADC values at 7, 14 and 20 dpi returned
to baseline and were not statistically different from
those of the contralateral side (p = 0.34, Figure 1).
The ADC time course described above was derived from
cross-sectional and independent data, proceeding from the
Table 1 Primer sequences used in RT-qPCR
Gene Accession number Primer sequences from 5’ to 3’ Location of amplicon Amplicon length Efficiency
AQP4 Isoform 1: NM_012825.3 Sens: TTGGACCAATCATAGGCGC 770 to 788 Isoform 1 213 pb 98.2%
778 to 796 Isoform 2
Isoform 2: NM_001142366.1 Revs: GGTCAATGTCGATCACATGC 963 to 982 Isoform 1
971 to 990 Isoform 2
GFAP NM_017009.2 Sens: GCGGCTCTGAGAGAGATTCG 692 to 711 90 pb 102.0%
Revs: TGCAAACTTGGACCGATACCA 761 to 781
IL1b NM_031512.2 Sens: AATGACCTGTTCTTTGAGGCTGAC 111 to 134 115 pb 91.2%
Revs: CGAGATGCTGCTGTGAGATTTGAAG 201 to 225
GAPDH NM_017008.3 Sens: TGCTGGTGCTGAGTATGTCGTG 337 to 358 101 pb 89.5%
Revs: CGGAGATGATGACCCTTTTGG 417 to 437
Tourdias et al. Journal of Neuroinflammation 2011, 8:143
/>Page 5 of 16
MR scans conducted just before sacrifice (n = 25). By
introducing the repetitive MR scans that were performed
before sacrifice (two to three scans per animal except for 1
dpi, total = 49) and by evaluating the longitudinal data for
each animal (Figure 1), the time course of edema build-up
and resolution phases was confirmed.
Build-up and resolution phase characteristics
During the edema build-up phase (1 and 3 dpi), inflam-
matory marker levels were significantly increased com-
pared t o the second resolution phase (Figures 2 and 3).
In the areas that displayed water accumulation accord-
ing to ADC maps, the Evans blue assay showed a signifi-
cant BBB alteration leading to serum protein
extravasation (IgG) as early as 1 dpi (p = 0.01 for Evans
blue and p = 0.03 for IgG). The number of ED1+ cells
progressively increased during the build-up phase. At
this early phase, most ED1+ cells were round shaped
and were often observed around blood vessels positiv ely
labeled for Iba1 (Figure 4). Based on their morphology
and location, the majority of these cells were thought to
be blood born macrophages, although some could also
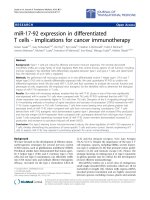
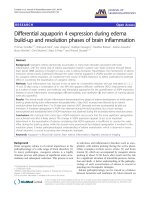
Figure 1 Time cour se of LPC-induced edema as assessed by ADC measurements.(A) Quantification of ADC values (median, Q1-Q3)
revealed a biphasic evolution (ANOVA) with a first phase characterized by a rapid increase in water content (§, p = 0.006, Wilcoxon test) peaking
at 3 dpi, corresponding to the active phase of inflammation. The second phase was characterized by water resolution (*, p = 0.015, ANOVA),
with ADC values that returned to baseline during the formation of a glial scar. ADC values of sham rats were stable over time and were not
different from those measured in the contralateral side of LPC rats. The dotted line is the median value over the 5 time points for the sham
group.(B) Representative illustration of the time course with T2WI (left panel) and merged T2/ADC maps (right panel) of the same animal taken
at three different time points (3, 7 and 14 dpi) with corresponding histology at 14 dpi (Luxol Fast Blue coloration). A large area of edema with
high ADC values was seen at 3 dpi along the right internal capsule (arrow) and spread through the extramedullary lamina and medial lemniscus
tracts toward the midline (arrowheads). The majority of the edema was resolved by 7 and 14 dpi, with a slight cavitation at the site of injection
(*) with cerebrospinal-fluid-like ADC values. Histological evaluation of the lesion at 14dpi confirmed the small cavitation (*) and showed large
demyelination of the white matter tracts in which edema was initially observed. The myelin fibers of the internal capsule, stained in blue, were
outlined (dotted lines) and a loss of myelin was seen in the internal capsule and also in the other white matter tracts (arrowheads).
Tourdias et al. Journal of Neuroinflammation 2011, 8:143
/>Page 6 of 16
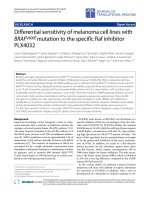
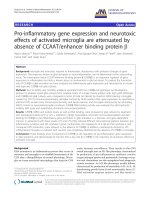
Figure 2 Edema build-up and resolution phase characteristics.(A) Representative samples of Evans blue extravasation from rats sacrificed at
1, 3, 7, 14 and 20 dpi. Widespread leakage at 1 dpi (arrow) progressively decreased with a restriction to the lesion site (3 and 7 dpi, arrows)
followed by a complete restoration of the BBB integrity at the later time points (14 and 20 dpi). (B) and (C) are representative illustrations of MRI
and histological features for rats explored at 1 dpi (B) and 20 dpi (C). During the edema formation phase (1 dpi, B), the T2 signal increased
along the internal capsule up to the midline with high ADC values (similar pattern as in Figure 1, day 3). The corresponding histology showed
important BBB permeability (IgG) and massive infiltration of ED1 + cells around vessels (**) in MRI-defined edematous areas (dotted lines) while
astrocytes were faintly stained (GFAP).During the edema resolution phase (20 dpi, C), T2 and ADC signals were mostly normalized, with the only
persistence of a small cavitation at the site of injection due to necrosis (*, similar pattern as in Figure 1, day 14). The corresponding histology
showed a large area with hypertrophic and entangled astrocytes i.e., gliosis (GFAP) around the point of injection (dotted lines) while BBB leakage
(IgG) had mostly resolved with much lower presence of ED1+ cells.
Tourdias et al. Journal of Neuroinflammation 2011, 8:143
/>Page 7 of 16
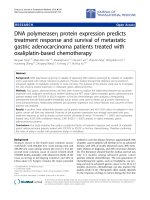
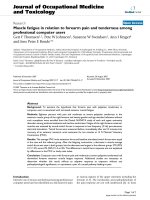
Figure 3 Quantitative features of edema build-up and resolution phases. Markers of BBB permeability (immunostaining of endogenous IgG
extravasation and Evans Blue leakage) and pro-inflammatory cytokine (IL1b mRNA quantification) were found as early as 1 dpi (§, p < 0.05,
Wilcoxon test) and were significantly increased during the build-up phase of the model compared to the resolution phase (*, p < 0.001, Mann
Whitney). The resolution phase (7 to 20 dpi) was characterized by the formation of a glial scar with a significant increase of GFAP (mRNA
quantification *, p < 0.05, Mann Whitney).
Tourdias et al. Journal of Neuroinflammation 2011, 8:143
/>Page 8 of 16
represent fully-activated microglia with an amoeboid
shape.Thepro-inflammatorycytokineIL1b mRNA was
significantly increased as early as 1 dpi (p = 0.008) while
the expression of GFAP was moderate.
During the edema reso lution phase (7, 14 and 20
dpi), the levels of markers for scarring were signifi-
cantly increased compared to during the build-up
phase (Figures 2 and 3). BBB permeability progres-
sively resolved with a significant disappearance of
serum protein (p < 0.0001). The number of ED1 +
cells significantly decreased (p < 0.0001), while many
Iba 1+ cells with highly branched processes were
detected; most were ED1- and corresponded to acti-
vated microglia with a profile suggestive of being
more repair-oriented (Figure 4). The level of the pro-
inflammatory cytokine IL1b was very low compared to
during the build-up phase (p < 0.001). Glial scarring
took place with an increase in GFAP mRNA expres-
sion (p = 0.01). Qualitative analysis from the histolo-
gical sections demonstrated that astrocytes became
hypertrophic and entangled and showed highly
branched processes.
Time course of AQP4 expression
In the sham group, no significan t variation in AQP4
staining was observed over time, and no significant dif-
ference was found compared to t he contralateral side of
LPC rats.
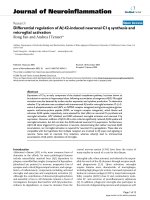
Figure 4 Inflammatory cell subtypes. Double labeling of ED1 (Alexa 488, green) and Iba1 (CY3, red) in the contralateral brain (A) and at the
lesion site at 1 dpi (B) and 14 dpi (C). On the contralateral side (A), only resting microglia were stained with ramified thin processes and weak
Iba1 immunoreactivity. During the edema formation phase (1 dpi, B), many round cells with both ED1 and Iba1 immunopositivity (arrows) were
found around vessels (**) and were thought to be infiltrating macrophages, while some could also represent amoeboid microglia with a fully
activated profile. At the periphery of the lesion, some activated microglia Iba + but ED1 - could also be observed (arrowheads). During the
edema resolution phase (14 dpi, C), most cells were Iba1 + but ED1 - and showed highly branched processes corresponding to activated
microglia.
Tourdias et al. Journal of Neuroinflammation 2011, 8:143
/>Page 9 of 16
In LPC operated rats, semi-quantitative histological
analyses conducted in direct comparison and in the
same ROIs as the MRI analyses revealed a moderate but
significant increase in AQP4 at 1 dpi compared to the
contralateral side (p = 0.00 3, Figure 5A). This initial
upregulation was not observed using RT-qPCR or wes-
tern blot methods conducted on the tissue lysates (Fig-
ure 5B and 5 C). Then, quantitative analyses revea led a
significant variation in AQP4 expression over time
(ANOVA, p < 0. 05), with higher levels of AQP4 expres-
sion observed during the edema resolution phase com-
pared to the build-up phase as evaluat ed by
immunostaining (p < 0.0001), RT-qPCR (p = 0.001) and
western blotting (p = 0.034, Figure 5). Consistent results
were observed using both histological analysis methods
(staining area and mean gray ratio) and both RT-qPCR
and western blot analysis methods (absolute values or
ratios to the contralateral side).
During the MRI-defined edema build-up phase (1 and
3 dpi), qualitative analysis revealedthatAQP4staining
was highly concentrated within the astrocyte membrane
domains that were facing blood vessels. This appeared
as a co -localization of AQP4 and GFAP on perivascular
astrocyte endfeet (Figure 6). Furthermore, comparison
with the MRI showed a direct spatial correspondence,
with increased AQP4 immunoreactivity found in areas
where ADC was also increased (Figure 6).
During the edema resolution phase (7, 14 and 20 dpi),
the expression pattern was different from the first
phase, with strong AQP4 expression throughout the
entire membrane of astrocytes, rather than being con-
fined to the domains facing blood vessels (Figure 7).
Spatially, this expression pattern was observed on astro-
cytes that w ere located aroun d the site of injection in
areas where the ADC values had returned to normal
(Figure 7).
Discussion
Exacerbation of vasogenic edema is feared in numerous
clinical situations and is classically interpreted as the
result of a modification of BBB permeability. Our
study focused on AQP4 because of its role in the re so-
lution of interstitial edema. We found that AQP4
expression was strongly up-regulated following an
initial delay. This time lag in AQP4 u pregulation could
be a key determinant in the evolution of interstitial
edema a nd could be a ssociated wi th the worsening of a
patient’ s condition. Following injury, a delay in effi-
cient upregulation of AQP4 could result in the build-
up phase of edema, as low AQP4 expression may be
insufficient to counteract the opening of the BBB . On
the other hand, the pronoun ced but delayed upregula-
tion of AQP4 participates in the resolution phase of
edema [ 11] (Figure 8).
Our knowledge of AQP4 involvement in brain edema
can be approached in two different ways [8] regarding
(i) the functions of AQP4 and (ii) its regulation of
expression. (i) The functions of AQP4 in mammals have
largely been determined by experiments using AQP4-
null mice [10]. In models of cytotoxic edema, in which
the BBB is intact, AQP4 deletion limits brain swelling
by reducing the rate of edema fluid formation [16-19].
In contrast, in models of vasogenic edema, BBB break-
down is thought to be the major determinant of edema
formation, independent of AQP4 [7]. In contrast to its
beneficial role in cytotoxic edema, AQP4 deficiency gen-
erates more brain swelling in models of vasogenic
edema, suggesting that water elimination occurs through
transcellular, AQP4-dependent routes [9,11,20]. Each
potential route of water exit (th e BBB, glia limitans, and
ependyma) strongly exp resses AQP4 [21], explaining the
impaired fluid clearance following vasogenic edema in
casesofAQP4deficiency.(ii) Second, several reports
have examined the expression of AQP4 in different dis-
orders that are associated with edema [22]. Discrepancy
in the observation likely occurs due to the different
models (cytotoxic, vasogenic, or even more co mplex
situations combining cytotoxic and vasogenic edema)
[8]. Furthermore, technical difficulties in water measure-
ment and limited longitudinal data preclude a complete
understanding of AQP4 regulation during build-up and
resolution phases of edema. In a previous study using
MRI a s a sensor for edema, we reported an increase in
AQP4 expression within the periventricular edema of
hydrocephalic rats, with higher levels of AQP4 expres-
sion in more severe and chronic rats, findings that are
consist ent with our current results [12]. Nevertheless, in
the hydrocephalus study, AQP4 e xpression was only
associated with disease severity, but because the timing
of the onset of hydrocephalus was unknown and
because the hydrocephalus was not reversible (edema
production continues over time), the time course of
AQP4 expression during the build-up and resolution
phases of edema could not b e addressed. Furthermore,
the edema of hydrocephalus had the same composition
as cerebro-spinal fluid without serum protein, which did
not allow an understanding of edema regulation asso-
ciated with BBB alteration.
Edema exacerbation typically follows stroke [2], brain
trauma [3] or encephalitis. Even if these incidents are
very different in their initial stages, the secondary
exacerbation of these pathologies is predominantl y due
to vasogenic edema [7]. Although the mechanisms for
increasing BBB permeability and subsequen t wat er
entrance are complex and vary according to the exact
pathophysiological situation, a secondary inflammatory
reaction can be viewed as a shared determinant [23].
Consequently, we chose a purely vasogenic situation
Tourdias et al. Journal of Neuroinflammation 2011, 8:143
/>Page 10 of 16
Figure 5 Time course of AQP4 expression during edema for mation and resolution.(A) Histological evaluation depicted an initial
upregulation of AQP4 as early as 1 dpi (§, p = 0.003, Wilcoxon test) that plateaued at 1 and 3 dpi. A significant increase in AQP4 expression was
found during the MRI-defined edema resolution compared to the MRI-defined edema formation phase (*, p < 0.0001 Mann Whitney). RNA
quantification (B) and protein quantification with western-blot (C) confirmed a much stronger increase in the expression of AQP4 during the
MRI-defined edema resolution compared to the MRI-defined edema formation phase (*, p < 0.05 Mann Whitney).The inset in (B) shows the area
of the tissue micro-dissection. A tissue block of 3 mm was cut around the injection site. Within the block, samples from the injured and
contralateral sides were obtained using a 3-mm-core unipunch (right and left shaded circles). In (C), a representative western blot shows the
strong increase of AQP4 at 14 and 20 dpi, while actin, which was used to control loading variations, was stable.
Tourdias et al. Journal of Neuroinflammation 2011, 8:143
/>Page 11 of 16
induced by inflammation as a clinically relevant model.
LPC is a product of membrane degradation that acts as
an inflammatory mediator [24] and is known to induce
inflammatory reactions with demyelination [13]. We
modified the classical protocol by using a higher injec-
tion dose. This protocol led to a more severe reaction,
inducing the biphasic edema time course. The definite
location and initiation of the lesion were additional key
elements in the time course study. Furthermore, our
modification to the model made it suitab le for MR
experiments and ADC measurement because larger
lesions diminish the risks involved in partial volume
averaging. MR per se offers several advantages regarding
edema exploration. First, MR measurements such as
ADC are quantitative, reproducible and highly validated,
with an acceleration of diffusion (ADC increase) occur-
ring when the overall water content is increased [25].
Second, because of the repetitive explorations of the
same animal at different time points, we could ensure
the reproducibility of the model and longitudinal infor-
mation. Third, the MRI provide d regional edema mea-
surements that are impossible to attain with widely used
Figure 6 MRI/histological correspondence during the build-up phase of edema. A representative rat examined at 1 dpi is shown. (A)A
large hypersignal area was seen on the T2WI (dotted line) with high ADC values (dotted line, ADC = 1377 μm
2
/s as opposed to 1039 μm
2
/s in
the symmetric contralateral area), indicating increased water content. A slight midline shift resulted from the cerebral edema (dotted arrows on
T2WI). (B) The corresponding histological sections (low magnification, with white boxes indicating higher magnification positions) showed an
increase in AQP4 immunoreactivity in the MRI-defined edematous area, with staining located around the capillaries (arrows) and larger vessels
(arrowhead) at the BBB level. AQP4 staining in the symmetric contralateral area is fainter around the capillaries (arrows). (C) Double labeling of
GFAP (Alexa 488, green) and AQP4 (CY3, red), examined using confocal microscopy confirmed the perivascular location of AQP4 on astrocyte
endfeet surrounding capillaries (arrows) without any AQP4 on the astrocyte body.
Tourdias et al. Journal of Neuroinflammation 2011, 8:143
/>Page 12 of 16
methods such as the “wet and dry” weight technique
[26]. The MRI approach allowed us to compare the
water content with immunohistochemistry data in th e
same animal, including regional information, which is
not possible with the wet/dry weig ht ratio method.
Finally, as a non-invasive method used for patients, it
affords a direct parallel to human disorders in
translational research. Utilizing these properties, we
found a direct spat ial co rrespondence between edema as
assessed by ADC and histological AQP4 expression
modification.
In more detail, our data demonstrate a biphasic
expression pattern of AQP4 that directly reflects the
biphasic course of the edematous model. During edema
Figure 7 MRI/histological correspondence during the resoluti on phase of edema. A represe ntative rat examined at 20 dpi is shown. (A)
MRI showed a small cavitation at the site of the injection with a cerebrospinal-fluid-like signal on the T2WI (arrow) and ADC map, while no
peripheral edema was anymore visible along the upper part of the internal capsule (dotted line, ADC = 889 μm
2
/s as opposed to 852 μm
2
/s in
the symmetric contralateral area). (B) The corresponding histological sections (low magnification, with white boxes indicating higher
magnification positions) showed a marked increase in AQP4 immunoreactivity, with staining located around the vessels (arrowhead) and with a
fibrillary pattern corresponding to staining on the entire astrocyte membrane in a gliotic area (arrows). The staining in the symmetric
contralateral area is more faint and only around capillaries. (C) Double labeling of GFAP (Alexa 488, green) and AQP4 (CY3, red), examined using
confocal microscopy, confirmed AQP4 localization over the entire membrane of hypertrophic astrocytes expressing high levels of GFAP and not
just around vessels (arrowhead). Double arrows show AQP4 staining along an astrocyte process and dotted arrows show AQP4 staining along an
astrocyte cell body.
Tourdias et al. Journal of Neuroinflammation 2011, 8:143
/>Page 13 of 16
build-up, a minor upregulation of AQP4 was seen only
histologically with a perivascular locat ion in MRI-
defined edematous areas. RT-qPCR and western blot
analysis did not show this early upregulation that may
arise from a micro-heterogeneity in AQP4 expression
that is increased mainly in regions exhibiting water
accumulation. Spatial heterogeneity is taken into
account with the direct histological/MRI comparison
but such resolution could be lost within a larger sample
(e.g., lysate of a tissue block). Alternatively, such a
minor only histologically detectible increase in AQP4
could be related to the translocation of AQP4 to the
endfeet with no alteration in overall AQP4 abundance.
Either way, during this early phase, BBB dysfunction (as
assessed by Evans blue) allowed an important passage of
plasma proteins (IgG) and water (rapid increase of
ADC), while AQP4 expression could be regarded as
insufficient to handle such opening of the BBB and sub-
sequent water influx. Thus, in t he early phase (up to 3
days), AQP4 upregulation might represent a protective
but insufficient response to limit brain swelling. Pre-
vious studies using stroke [27,28] and brain injury mod-
els [29,30] have reported an initial AQP4
downregulation. The cytotoxic nature of edema at early
times in these models could account for the differences
with our pure vasogenic model. If initial AQP4 downre-
gulation could protect against intrace llular entrance at
early times [17], it coul d also induce a delay in the sec-
ondary upregulation that is necessary to clear the sec-
ond phase of vasogenic ede ma exacerbation, which is
consistent with our results.
During the resolution phase, the edema decrease coin-
cided with a second more significant upregulation of
AQP4. Although there is no direct functional proof, we
propose that the water elimination routes were suffi-
ciently up-regulated to facilitate water removal. Further-
more, the differences in t he pattern of c ellular AQP4
localization across the astrocyte membrane, i.e., no
longer solely rest ricted to co mpartments facing blood
vessels, sugges ts a di ffer ent role, probably in the form a-
tion of a glial scar, which is prominent at this phase.
Indeed, pan-astrocytic AQP4 expression has been shown
to enhance astrocyte migration in vitro and in vivo
[31,32]. During this phase, closure of the BBB was
observed which is a ssociated with disappearance o f
serum protein that can be extravasated via t he plasma
membrane of endothelial cells back to the bloo d. Other
potential clearing mechanisms include the digestion of
serum proteins in the extracellular spa ce by astrocytes
[1,7]. Therefore, AQP4 may highly facilitate the efflux of
water into the blood or the CSF along the osmotic gra-
dient but may also facilitate astrocyte scarring and the
associated uptake of the protein component of fluid.
These results are consistent with previous data showing
that high AQP4 expre ssion is associated with glial scars
[33,34], although the associated water content was not
directly measured in these studies. Alternatively, high
AQP4 expression during this phase could also be
involved in regulating the fluid in newly formed cavita-
tion due to necrosis. Nevertheless, such a mec hanism is
likely secondary, as AQP4 was significa ntly upregulated
before significant cavitation appeared (no sooner than
20 dpi).
Conclusion
In conclusion, in addition to BBB permeability, we add
to the understanding the time lag in AQP4 upregulation
as an additional mechanism for the exacerbation of
Figure 8 Sug gested model for inte rstitial edema pathophysiology. The edema build-up phase results from high B BB permeability while
AQP4 expression is not yet highly upregulated, resulting in insufficient routes for water elimination. After the time lag of AQP4 expression,
edema resolution results from the conjunction of BBB restoration and subsequent significant AQP4 upregulation over the entire astrocyte
membrane. Transition phases likely exist between the two extremes.
Tourdias et al. Journal of Neuroinflammation 2011, 8:143
/>Page 14 of 16
interstitial edema. Future efforts to increase AQP4
expression by therapeutic intervention could help to
prevent the deleterious occurrence of edema
exacerbation.
List of Abbreviations Used
ADC: Apparent diffusion coefficient; AQP4: Aquaporin 4; BBB: Blood brain
barrier; Dpi: Day(s) post injection; DWI: Diffusion weighted images; GFAP:
Glial fibrillary acidic protein; IL1β: Interleukin 1β; LPC: L- α-
lysophosphatidylcholine; MRI: Magnetic resonance imaging; ROI: Region of
interest; T2WI: T2 weighted images.
Acknowledgements
We thank Dr. Nora Abrous (INSERM U 862, Bordeaux, France) for surgery
supervision and Dr. Marc Landry (CNRS, UMR 5297) for helpful discussion.
We thank Celine Girard and Geraldine Miquel for technical assistance with
the animals and histology protocols. The confocal microscopy was
performed in the Bordeaux Imaging Center in the Neurosciences Institute of
the University of Bordeaux II and the help of Sébastien Marais is
acknowledged.
TT is a research fellow of the Société Française de Radiologie and a CNRS-
CHU-assistant. This work was supported by the Conseil Régional d’Aquitaine
and INSERM (KGP and VD).
Author details
1
INSERM U.1049 Neuroinflammation, Imagerie et Thérapie de la Sclérose en
Plaques, F-33076 Bordeaux, France.
2
CHU de Bordeaux, Service de
Neuroimagerie Diagnostique et Thérapeutique, F-33076 Bordeaux, France.
3
CNRS, UMR 5231 Laboratoire d’Imagerie Moléculaire et Fonctionnelle, F-
33076 Bordeaux, France.
Authors’ contributions
TT participated in the study design, carried out animal experiments,
participated in MR scanning, analyzed the results and drafted the
manuscript. NM participated in the animal experiments and revised the
manuscript. ID established and performed the MR imaging. NC established
and carried out the RT-qPCR experiments. CB instructed the animal
experiments and revised the manuscript. JA carried out the histological
staining and western blot experiments. BB participated in the study design
and revised the manuscript. CM supervised the MR imaging and revised the
manuscript. KGP participated in the study design, supervised the
experiments, contributed to the data interpretation and revised the
manuscript. VD initiated the project, supervised the experiments, contributed
to the data interpretation and revised the manuscript. All authors read and
approved the final manuscript.
Competing interests
The authors declare that they have no competing interests.
Received: 9 June 2011 Accepted: 19 October 2011
Published: 19 October 2011
References
1. Marmarou A: A review of progress in understanding the pathophysiology
and treatment of brain edema. Neurosurg Focus 2007, 22:E1.
2. Sandoval KE, Witt KA: Blood-brain barrier tight junction permeability and
ischemic stroke. Neurobiol Dis 2008, 32:200-219.
3. Unterberg AW, Stover J, Kress B, Kiening KL: Edema and brain trauma.
Neuroscience 2004, 129:1021-1029.
4. Agre P, Nielsen S, Ottersen OP: Towards a molecular understanding of
water homeostasis in the brain. Neuroscience 2004, 129:849-850.
5. Abbott NJ, Patabendige AA, Dolman DE, Yusof SR, Begley DJ: Structure and
function of the blood-brain barrier. Neurobiol Dis 2010, 37:13-25.
6. Wunder A, Klohs J, Dirnagl U: Non-invasive visualization of CNS
inflammation with nuclear and optical imaging. Neuroscience 2009,
158:1161-1173.
7. Nag S, Manias JL, Stewart DJ: Pathology and new players in the
pathogenesis of brain edema. Acta Neuropathol 2009, 118:197-217.
8. Tait MJ, Saadoun S, Bell BA, Papadopoulos MC: Water movements in the
brain: role of aquaporins. Trends Neurosci 2008, 31:37-43.
9. Bloch O, Papadopoulos MC, Manley GT, Verkman AS: Aquaporin-4 gene
deletion in mice increases focal edema associated with staphylococcal
brain abscess. J Neurochem 2005, 95:254-262.
10. Manley GT, Binder DK, Papadopoulos MC, Verkman AS: New insights into
water transport and edema in the central nervous system from
phenotype analysis of aquaporin-4 null mice. Neuroscience 2004,
129:983-991.
11. Papadopoulos MC, Manley GT, Krishna S, Verkman AS: Aquaporin-4
facilitates reabsorption of excess fluid in vasogenic brain edema. Faseb J
2004, 18:1291-1293.
12. Tourdias T, Dragonu I, Fushimi Y, Deloire MS, Boiziau C, Brochet B,
Moonen C, Petry KG, Dousset V: Aquaporin 4 correlates with apparent
diffusion coefficient and hydrocephalus severity in the rat brain: a
combined MRI-histological study. Neuroimage 2009, 47:659-666.
13. Deloire-Grassin MS, Brochet B, Quesson B, Delalande C, Dousset V,
Canioni P, Petry KG: In vivo evaluation of remyelination in rat brain by
magnetization transfer imaging. J Neurol Sci 2000, 178:10-16.
14. Bustin SA, Benes V, Garson JA, Hellemans J, Huggett J, Kubista M, Mueller R,
Nolan T, Pfaffl MW, Shipley GL, et al: The MIQE guidelines: minimum
information for publication of quantitative real-time PCR experiments.
Clin Chem 2009, 55:611-622.
15. Livak KJ, Schmittgen TD: Analysis
of relative gene expression data using
real-time quantitative PCR and the 2(-Delta Delta C(T)) Method. Methods
2001, 25:402-408.
16. Amiry-Moghaddam M, Otsuka T, Hurn PD, Traystman RJ, Haug FM,
Froehner SC, Adams ME, Neely JD, Agre P, Ottersen OP, Bhardwaj A: An
alpha-syntrophin-dependent pool of AQP4 in astroglial end-feet confers
bidirectional water flow between blood and brain. Proc Natl Acad Sci USA
2003, 100:2106-2111.
17. Manley GT, Fujimura M, Ma T, Noshita N, Filiz F, Bollen AW, Chan P,
Verkman AS: Aquaporin-4 deletion in mice reduces brain edema after
acute water intoxication and ischemic stroke. Nat Med 2000, 6:159-163.
18. Papadopoulos MC, Verkman AS: Aquaporin-4 gene disruption in mice
reduces brain swelling and mortality in pneumococcal meningitis. J Biol
Chem 2005, 280:13906-13912.
19. Vajda Z, Pedersen M, Fuchtbauer EM, Wertz K, Stodkilde-Jorgensen H,
Sulyok E, Doczi T, Neely JD, Agre P, Frokiaer J, Nielsen S: Delayed onset of
brain edema and mislocalization of aquaporin-4 in dystrophin-null
transgenic mice. Proc Natl Acad Sci USA 2002, 99:13131-13136.
20. Bloch O, Auguste KI, Manley GT, Verkman AS: Accelerated progression of
kaolin-induced hydrocephalus in aquaporin-4-deficient mice. J Cereb
Blood Flow Metab 2006, 26:1527-1537.
21. Nielsen S, Nagelhus EA, Amiry-Moghaddam M, Bourque C, Agre P,
Ottersen OP: Specialized membrane domains for water transport in glial
cells: high-resolution immunogold cytochemistry of aquaporin-4 in rat
brain. J Neurosci 1997, 17:171-180.
22. Saadoun S, Papadopoulos MC: Aquaporin-4 in brain and spinal cord
oedema. Neuroscience 2010, 168:1036-1046.
23. Lakhan SE, Kirchgessner A, Hofer M: Inflammatory mechanisms in
ischemic stroke: therapeutic approaches. J Transl Med 2009, 7:97.
24. Stock C, Schilling T, Schwab A, Eder C: Lysophosphatidylcholine stimulates
IL-1beta release from microglia via a P2X7 receptor-independent
mechanism. J Immunol 2006, 177:8560-8568.
25. Le Bihan D: Looking into the functional architecture of the brain with
diffusion MRI. Nat Rev Neurosci 2003, 4:469-480.
26. Agrawal HC, Davis JM, Himwich WA: Developmental changes in mouse
brain: weight, water content and free amino acids. J Neurochem 1968,
15:917-923.
27. Frydenlund DS, Bhardwaj A, Otsuka T, Mylonakou MN, Yasumura T,
Davidson KG, Zeynalov E, Skare O, Laake P, Haug FM, et al: Temporary loss
of perivascular aquaporin-4 in neocortex after transient middle cerebral
artery occlusion in mice. Proc Natl Acad Sci USA 2006, 103:13532-13536.
28. Ribeiro Mde C, Hirt L, Bogousslavsky J, Regli L, Badaut J: Time
course of
aquaporin expression after transient focal cerebral ischemia in mice. J
Neurosci Res 2006, 83:1231-1240.
29. Ke C, Poon WS, Ng HK, Pang JC, Chan Y: Heterogeneous responses of
aquaporin-4 in oedema formation in a replicated severe traumatic brain
injury model in rats. Neurosci Lett 2001, 301:21-24.
Tourdias et al. Journal of Neuroinflammation 2011, 8:143
/>Page 15 of 16
30. Kiening KL, van Landeghem FK, Schreiber S, Thomale UW, von Deimling A,
Unterberg AW, Stover JF: Decreased hemispheric Aquaporin-4 is linked to
evolving brain edema following controlled cortical impact injury in rats.
Neurosci Lett 2002, 324:105-108.
31. Auguste KI, Jin S, Uchida K, Yan D, Manley GT, Papadopoulos MC,
Verkman AS: Greatly impaired migration of implanted aquaporin-4-
deficient astroglial cells in mouse brain toward a site of injury. Faseb J
2007, 21:108-116.
32. Saadoun S, Papadopoulos MC, Watanabe H, Yan D, Manley GT, Verkman AS:
Involvement of aquaporin-4 in astroglial cell migration and glial scar
formation. J Cell Sci 2005, 118:5691-5698.
33. Tomas-Camardiel M, Venero JL, Herrera AJ, De Pablos RM, Pintor-Toro JA,
Machado A, Cano J: Blood-brain barrier disruption highly induces
aquaporin-4 mRNA and protein in perivascular and parenchymal
astrocytes: protective effect by estradiol treatment in ovariectomized
animals. J Neurosci Res 2005, 80:235-246.
34. Vizuete ML, Venero JL, Vargas C, Ilundain AA, Echevarria M, Machado A,
Cano J: Differential upregulation of aquaporin-4 mRNA expression in
reactive astrocytes after brain injury: potential role in brain edema.
Neurobiol Dis 1999, 6:245-258.
doi:10.1186/1742-2094-8-143
Cite this article as: Tourdias et al.: Differ ential aqu apo rin 4 exp ression
during ed ema bui ld-up a nd resol ution pha ses of br ain i nfla mmation. Journ al
of Neuroinflammation 2011 8: 143.
Submit your next manuscript to BioMed Central
and take full advantage of:
• Convenient online submission
• Thorough peer review
• No space constraints or color figure charges
• Immediate publication on acceptance
• Inclusion in PubMed, CAS, Scopus and Google Scholar
• Research which is freely available for redistribution
Submit your manuscript at
www.biomedcentral.com/submit
Tourdias et al. Journal of Neuroinflammation 2011, 8:143
/>Page 16 of 16