Báo cáo hóa học: "Sweat rate and sodium loss during work in the heat" ppt
Bạn đang xem bản rút gọn của tài liệu. Xem và tải ngay bản đầy đủ của tài liệu tại đây (249.16 KB, 6 trang )
BioMed Central
Page 1 of 6
(page number not for citation purposes)
Journal of Occupational Medicine
and Toxicology
Open Access
Research
Sweat rate and sodium loss during work in the heat
Graham P Bates and Veronica S Miller*
Address: School of Public Health, Curtin University of Technology, Perth, Western Australia
Email: Graham P Bates - ; Veronica S Miller* -
* Corresponding author
Abstract
Objective: Significant and poorly documented electrolyte losses result from prolonged sweating.
This study aimed to quantify likely sodium losses during work in heat.
Methods: Male subjects exercised in an environmental chamber on two consecutive days in both
winter and summer. Sweat collecting devices were attached to the upper arms and legs.
Results: Sweat rates were higher and sodium concentrations were lower in the summer
(acclimatised) than the winter (unacclimatised) trials. Sweat sodium concentration was reduced on
the second day in summer but not winter. Regional differences were found in both seasons.
Conclusion: The difference between days in summer probably reflects short-term acclimation.
The difference between seasons reflects acclimatisation. The data predict average sodium (Na)
losses over a work shift of 4.8–6 g, equivalent to 10–15 g salt (NaCl). Losses are potentially greater
in unacclimatised individuals.
Fluid and electrolyte losses resulting from prolonged sweating must be replaced to prevent
imbalance in body fluids, however guidelines for this replacement are often conflicting.
This study provides important information for occupational health practitioners by quantifying the
likely sodium losses over a work shift and providing recommendations for replacement.
Background
During prolonged work periods in the heat (8–12 hour
shifts), the maintenance of high sweat rates leads to pro-
gressive dehydration, which may be accompanied by
impairment of mental and physical performance and of
heat dissipation [1-4]. Dehydration will impair work
capacity and may pose a serious risk to health [5]; the
intake of fluid during the working period to replace sweat
losses is therefore imperative.
However the sodium replacement need is often over-
looked, mainly as a consequence of scant information
regarding the sweat loss of sodium over time. There is also
little information available concerning variability of sweat
concentration from different regions of the body (is sweat
sodium the same in all body regions) and between the
same individual (unacclimatised and acclimatised). With
a better understanding of electrolyte loss in sweat, accu-
rate advice regarding replacement beverages can be pro-
vided to workers performing manual tasks in the heat.
Commercially prepared sports drinks have varying con-
centrations of glucose and sodium, and range from hyper-
tonic to hypotonic with respect to plasma. Sodium is
added to some drinks for the purpose of replacing sweat
salt losses, and to aid in the transport of glucose across the
Published: 29 January 2008
Journal of Occupational Medicine and Toxicology 2008, 3:4 doi:10.1186/1745-6673-3-4
Received: 31 October 2007
Accepted: 29 January 2008
This article is available from: />© 2008 Bates and Miller; licensee BioMed Central Ltd.
This is an Open Access article distributed under the terms of the Creative Commons Attribution License ( />),
which permits unrestricted use, distribution, and reproduction in any medium, provided the original work is properly cited.
Journal of Occupational Medicine and Toxicology 2008, 3:4 />Page 2 of 6
(page number not for citation purposes)
intestinal wall. Glucose is added to the drinks in order to
maintain blood glucose levels (avoid fatigue) during the
work period. Sweat is hypotonic to plasma and to some of
the electrolyte replacement drinks available. Conse-
quently, the consumption of these electrolyte replace-
ment drinks, if made available to workers ad libitum, may
result in the consumption of too much sodium. On the
other hand, if sweat losses are replaced with plain water a
dilution of the plasma may occur to the point of the per-
son being hyponatremic. It should be emphasized that
sweat losses can exceed 1.5 litres/hour when working in
very hot environmental conditions [6,7]. Meal breaks in
order to allow salt and glucose intake from solid food are
a must if workers are using water to replace sweat loss as
nearly all food contains some sodium. However before
appropriate sodium intake can be recommended, the loss
over a work duration must be known.
Soft drinks and cordials have approximately 10% sugar
content and if these are used as a sole replacement bever-
age this can significantly increase the daily kilojoule
intake of the worker. During the summer when sweat rates
are high, it is not uncommon for some workers to con-
sume 10 litres of fluids in the working day. The daily sugar
intake in this instance would be over 1.0 kg. In addition,
cola and recently released "designer drinks" have a mod-
erate to high concentration of caffeine. This can reduce
fluid retention. Coffee and to a lesser extent tea are also
caffeinated beverages, and large consumption (more than
two cups per work shift) should be avoided especially dur-
ing the summer when sweat rates can be high. Some
drinks have a low pH (acidic) and high sugar concentra-
tion (10%), and while they may be appropriate for short
duration sport sweat replacement, they should not be rec-
ommended for daily high volume consumption. Thus
workers require education so that appropriate choices are
made about replacement fluids. This is particularly true at
the beginning of summer when they are unacclimatised to
the heat; however we do not currently have a comprehen-
sive understanding of sweat sodium losses in workers.
As sweat loss can be up to10–12 litres per day, and sweat
contains sodium, an essential electrolyte, this study was
designed to better understand sweat sodium loss so that
informed educational strategies can be put in place in
order to prevent heat illness and accidents due to the
effects of heat strain in the workplace.
Methods
The subjects were 29 healthy, male, manual outdoor
workers (various trades) aged between 18 and 50 years, all
provided informed consent to participation in the study.
Typical summer temperatures in the study location would
be 30–35°C, winter temperatures average 15–20°C. The
cardiovascular fitness (mean VO
2
max), assessed using the
Åstrand and Rodahl protocol was 33.7 mL.kg
-1
.min
-1
in
summer and 39.1 mL.kg
-1
.min
-1
in winter. The subjects
were assumed to be heat acclimatised during the summer
experiments, and heat unacclimatised during the winter
trials. One week following assessments, each subject per-
formed two exercise-heat tests in a climate chamber on
consecutive days in order to measure daily differences in
sweat sodium. All heat tests were conducted in the morn-
ing. The climate chamber was maintained at 35°C and 50
% RH, air velocity was minimal, WBGT was approxi-
mately 29.3°C. TWL under these conditions for a subject
wearing minimal clothing is approximately 180 W.m
-2
.
Before entering the climate chamber the subjects were
weighed in minimal clothing on an electronic balance
scale (accuracy ± 5 g), the subjects then changed into their
exercise clothing (shorts and trainers)and their core tem-
perature was recorded from the tympanic membrane
(accuracy ± 0.1°C) using a common medical instrument
(Braun).
Each subject was then fitted with a heart-rate monitor
(Polar GBR 175015 A) and exercised on a cycle ergometer
at 40 % of VO
2
max (equivalent to moderate manual
labour e.g. mining or construction work) for a total of 35
minutes. The heart rate was recorded at 5-minute intervals
throughout the testing session. There were no restrictions
placed on the lifestyle of the subject prior to, or during,
the testing period. The subjects were fitted with four sweat
collecting devices after 15 mins of cycling, the time delay
between exercise onset and attachment of the devices was
to allow sweating to be initiated. This avoids any possible
concentration changes between "start up sweat" and regu-
lar sweat flow. The collecting devices were Wescor sweat
collection capsules [8] modified by extending the collec-
tion coil, and using custom made adjustable strapping to
secure the capsule. Care was taken to ensure consistent,
minimal pressure was applied to the skin. This was to
avoid excessive pressure, yet prevent sweat leaking from
the collection site. The capsules were positioned on the
lateral aspect of both upper arms, and the front of both
thighs, approximately midway between the knee and hip.
The devices were secured to the limbs after the sites had
been shaved and sterilised with alcohol swabs. The sub-
jects continued to cycle for a further 20 minutes after the
sweat collecting devices had been attached. Core temper-
ature was monitored regularly. At the end of the exercise
session, the sweat collecting devices were removed and
placed in individual sealed plastic bags. The subjects were
then instructed to shower without wetting their hair,
abstain from drinking, eating, or urinating, and to ensure
they were completely dry before re-dressing into the
clothes in which they were originally weighed. After re-
weighing, the sweat rate (mL. min
-1
) was calculated from
the weight loss of the subject over time. The collected
Journal of Occupational Medicine and Toxicology 2008, 3:4 />Page 3 of 6
(page number not for citation purposes)
sweat was evacuated with compressed air, into small
weighing trays. The sweat samples were weighed from
each site for sweat rate comparisons, and then diluted in
volumetric flasks with deionised water. The concentration
of sodium was then determined by atomic absorption
spectrophotometry.
Linear regression of data from contralateral sites (right
and left) was carried out to confirm that differences did
not arise from the methodology of either sweat collection
or analysis. Probability of intra-individual variation
between days, limbs, and seasons was analysed by stu-
dent's paired t-test. Means and 95% confidence limits for
group seasonal data were determined.
The experiments described in this paper were approved by
the Curtin University Human Ethics Committee.
Results
Sweat sodium concentrations from the relatively inactive
arms were consistently higher than the active legs for both
days in summer and winter as shown in Table 1. The mean
sodium concentration in the 58 arm samples on the first
day of sampling in winter was 72.7 mmol.L
-1
, and on the
second day 72.9 mmol.L
-1
. Similarly, the sodium concen-
tration in leg sweat did not significantly alter from day to
day in winter (Table 1). However in the summer samples
the sweat sodium concentration from both the arms and
legs on day 2 showed a substantial reduction from day 1
samples as shown in the same table. The concentrations
for the contralateral limbs for arms and legs of the same
individual on the same day were virtually the same as
shown by the correlation coefficients, (r) for each day
between right and left arms and legs for each of the 29
subjects (Table 1). Analysis of the sweat sodium concen-
tration data by paired t-test (Table 2) showed significant
differences between arms and legs of individual subjects
on both days and overall these differences are reflected in
the means. In summer, the differences between days for
the arms was significant and for the legs almost so,
whereas in winter no differences were seen, correlating
with the mean data in table 1.
The mean sodium concentration in sweat from both arms
and legs showed a substantial difference between summer
and winter (Table 3), as did the means of samples from all
limbs (44.7 mmol.L
-1
in summer and 63.8 mmol.L
-1
in
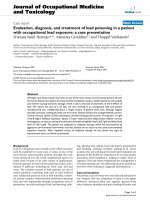
winter, p = 0.0001). The individual data for all limbs com-
bined are presented graphically in Figure 1.
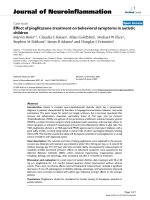
There was a significantly (p = 0.0299) greater sweat rate
(water loss) in summer than in winter as shown in Fig 2.
The mean water loss in the summer was 7.8 mL.min
-1
(0.47 L.h
-1
) compared with 6.9 mL.min
-1
(0.41 L.h
-1
) in
winter (Table 3). Sweat rate ranged from a minimum of
0.1 L.hr
-1
to a maximum of 1.0 L.hr
-1
with a narrower
range in summer than winter, both the minimum and
maximum individual values of water loss were recorded
in winter.
Regression analysis showed no significant correlation
between subject body composition, fitness or age and
either sweat sodium concentration or sweat rate.
Discussion
Sweat sodium concentration collected from the right and
left arms and legs on the same day showed a very strong
correlation confirming methodological consistency [9].
However, a statistically significant intra-individual differ-
ence was demonstrated between sodium concentration in
sweat secreted from the arms and legs, for both the sum-
mer and winter measurements (Table 2), also apparent in
the mean data (Table 1). The sodium concentration in
sweat samples taken from the legs was significantly less
than from the arms (Tables 1&2). The difference in sweat
sodium concentration between the arms and legs may be
due to the difference in metabolic activity between the leg
and arm muscles. The workload on the cycle ergometer
required to reach 40 % VO
2
max is achieved by the leg
muscles, producing significant metabolic heat energy,
which has to be dissipated. However regardless of the
causes of these regional differences the fact remains that
sweat collection from one anatomical region may not be
representative of whole body sodium loss.
There was a statistically significant change in sodium con-
centration between the first and second day in summer for
Table 1: Sweat sodium concentration
Mean day 1 r
day 1
Mean day 2 r
day 2
Summer arms 53.3 0.853 44.3 0.983
legs 42.9 0.958 38.5 0.981
Winter arms 72.7 0.941 72.9 0.935
legs 55.5 0.947 53.8 0.976
Mean values of sweat sodium concentration (mmol.L
-1
) from individual arms and legs taken on 2 consecutive days in summer and winter and
correlation (r) between right and left limb data. (n = 29 subjects)
Journal of Occupational Medicine and Toxicology 2008, 3:4 />Page 4 of 6
(page number not for citation purposes)
the arms and to a lesser extent for the legs, suggesting that
one heat exposure in summer is sufficient to trigger an
acclimation effect. In winter this difference was not
present. This short-term acclimation has previously been
shown by Kirby and Convertino [10] however in their
study sodium concentration was only measured on day 1
and day 10. As acclimation was being studied it is
assumed the study was conducted in the cooler months.
As the findings in the current study showed no variation
in the first two days during winter, when subjects would
be expected to be unacclimatised, it would appear that the
triggering mechanism for increased sodium conservation
in the unacclimatised state requires more than one heat
exposure but is well established after 10 days. In contrast,
in summer when subjects would be more acclimatised
one exposure would appear to induce a sodium conserva-
tion response. The sweat glands may be more sensitive to
aldosterone when in the acclimatised state. This was also
postulated by Kirby and Convertino [10] who reported
that decreased sweat sodium secretion was associated with
significant reductions in plasma aldosterone during exer-
cise in the heat following acclimation. The findings of the
current study would reinforce increased sensitivity to
aldosterone as the explanation for the seasonal differ-
ences. Further, the sensitivity is enhanced during summer
when sodium retention would be important in order to
prevent electrolyte disturbance due to chronic high sweat
sodium loss.
The absence of any relationship between body composi-
tion, fitness or age and either sweat sodium concentration
or sweat rate may come as a surprise, as exercise produces
metabolic heat, which in turn induces sweating. On this
basis it could be hypothesised that fitter individuals exer-
cise more and therefore would have greater sodium con-
servation due to exercise-induced acclimatisation,
however this appears not to be the case. Whether the met-
abolic heat generated is insufficient or environmental
heat is a requirement remains to be fully demonstrated.
Sweat sodium concentrations in summer were less than in
winter, the mean value for summer being 44.7 mmol.L
-1
and winter 63.8 mmol.L
-1
. However the standard devia-
tions for summer and winter were similar (24.1 in sum-
mer and 22.6 mmol.L
-1
in winter). Therefore the
variability in sweat sodium concentration was greater in
summer than in winter (apparent in Figure 1). This sup-
ports variation reflecting inherent rather than lifestyle dif-
ferences, as individuals seem to differ in their ability to
acclimatise to the same environmental stress. The ethnic-
ity of subjects was not recorded but genetics determining
sweat gland density and sensitivity (receptors on the sweat
duct) may have more influence than thought on the sweat
response and the ability of the sweat gland to reabsorb
sodium. Seasonal change to sodium loss reflects the well-
known acclimatisation response. All the subjects were
outdoor workers and were tested at the end of the summer
months, when their acclimatisation would be expected to
peak, and near the end of winter.
Table 2: Intra-individual variation.
Summer p value Winter p value
day 1, both arms day 2, both arms 0.0002* 0.6774
day 1, both legs day 2, both legs 0.0870 0.6437
day 1, both arms day 1, both legs 0.0029* 0.0001*
day 2, both arms day 2, both legs 0.0189* 0.0001*
both days, arms both days, legs 0.0047* 0.0001*
Probability values from paired t-tests comparing sweat sodium data for each subject between days and between limbs. * Level of significance p <
0.05
Table 3: Summary of mean seasonal data for sweat sodium concentration and sweat rate.
Sweat sodium concentrations Mean sweat rate (kg.h
-1)
Mean arms (mmol.L
-1
) Mean legs (mmol.L
-1
) Combined seasonal mean
(all limbs) (mmol.L-1)
Summer 48.4 ± 26.6 41.0 ± 23.3 44.7 ± 24.7 0.47 ± 0.14
(38.1 – 58.7) (31.3 – 50.6) (35.7 – 53.7) (0.29 – 0.65)
Winter 72.3 ± 24.9 55.5 ± 21.7 63.8 ± 22.6 0.41 ± 0.17
(62.3 – 82.3) (46.2 – 64.8) (55.4 – 72.2) (0.21 – 0.49)
p 0.0001* 0.0299*
Data are mean ± SD with 95% confidence limits (parentheses).
* Level of significance p < 0.05. Paired t-tests comparing individual summer and winter data.
Journal of Occupational Medicine and Toxicology 2008, 3:4 />Page 5 of 6
(page number not for citation purposes)
Future experiments should aim to clarify whether leg
sweat glands have an inherently different capacity to sweat
compared with the arms. Alternatively, since legs gener-
ally have a greater workload than arms, a training effect
could occur to sweat glands in the lower limbs that results
in a greater absorptive ability due to ductal hypertrophy or
an increase in the concentration of enzymes involved in
reabsorption, a possibility given some credibility by Fox et
al [11] who showed a training effect on sweat glands. Sim-
ilar findings were reported by Hofler [12].
One criticism of using local sweat collection methods has
been that sodium concentration is usually higher than
with using whole body techniques [13]. Shirreffs and
Maughan, who measured sodium loss using whole body
washdown, reported sweat sodium as 50.8 mmol.L
-1
.
However the time of year the study was conducted is not
stated, so whether the subjects were acclimatised is not
known. The mean sweat sodium concentration in sum-
mer (44.7 mmol.L
-1
) for the current study was slightly less
than that described by Shirreffs and Maughan [13], the
winter value (63.8 mmol.L
-1
) was higher as would be
expected if unacclimatised were to be compared to accli-
matised subjects. There is sound agreement between the
two methods.
From a practical viewpoint, a number of findings from
this study can be put to use by occupational physicians. It
is common for miners and other manual workers to per-
form 12-hour shifts in hot environments. The sweat loss
can be as high as 12 litres per day [14] but 8–10 litres is
common [6]. This represents a substantial fluid loss and
demonstrates the importance of maintaining hydration
status when working in the heat. These losses represent a
substantial percentage of body weight and will rapidly
lead to dehydration unless replacement fluid is con-
sumed. In addition the sodium (Na) loss from sweating at
this rate could exceed 10 g per day equivalent to 25 g of
salt (NaCl). In this study the individual variation in both
sweat rate and sodium concentration was substantial,
however based on the mean data the sweat loss over a 10-
hour shift even in a moderate environment would be 4.7
litres in summer and 4.1 litres in winter. There is currently
no simple method to predict an individual's sweat com-
position, however on the basis of this study the average
sodium concentration would be 45 mmol.L
-1
in summer
and 64 mmol.L
-1
in winter (Table 3). The average acclima-
tised and unacclimatised sodium (Na) losses for a 10-
hour shift in a moderate environment (35°C, 50 % RH)
at 40% of VO
2
max would therefore be 4.8 g and 6 g,
assuming the sweat rates and composition measured in
this study were constant over the shift. The data predict
that sodium loss would be greater in the unacclimatised
individual (winter data) even with a lower sweat rate due
to the higher sweat sodium concentration. Replacement
of this daily electrolyte loss at regular intervals for individ-
uals working in the heat is imperative in order to avoid
possible electrolyte disturbance and impaired work per-
formance. Given that the health message is to reduce
sodium intake it becomes important that workers are edu-
cated as to the importance of eating during meal breaks
and of having sodium rich foods when working in hostile
conditions. Given the carbohydrate concentration in most
Sweat loss (L.h-1) of 29 subjects participating in summer and winter heat testsFigure 2
Sweat loss (L.h-1) of 29 subjects participating in sum-
mer and winter heat tests. The subjects worked at a set
rate (40% VO2 max) in a climate chamber set at 35°C and
50% RH for 35 mins.
0
1
2
3
4
5
6
7
8
9
10
0.1-0.19 0.2-0.29 0.3-0.39 0.4-0.49 0.5-0.59 0.6-0.69 0.7-0.79 0.8-0.89 0.9-0.99
Winter Summer
Water Loss (L.h
-1
)
Number of subjects
Sweat sodium concentration (mmol.L-1) of 29 subjects par-ticipating in summer and winter heat testsFigure 1
Sweat sodium concentration (mmol.L-1) of 29 sub-
jects participating in summer and winter heat tests.
The subjects worked at a set rate (40% VO
2
max) in a climate
chamber set at 35°C and 50% RH for 35 mins. Values are
means of samples from all anatomical sites.
0
1
2
3
4
5
6
7
8
9
<20 20-30 30-40 40-50 50-60 60-70 70-80 80-90 90-100 100-110 110-120
Winter
Summer
Sweat sodium (mmol.L
-1
)
Number of subjects
Publish with BioMed Central and every
scientist can read your work free of charge
"BioMed Central will be the most significant development for
disseminating the results of biomedical research in our lifetime."
Sir Paul Nurse, Cancer Research UK
Your research papers will be:
available free of charge to the entire biomedical community
peer reviewed and published immediately upon acceptance
cited in PubMed and archived on PubMed Central
yours — you keep the copyright
Submit your manuscript here:
/>BioMedcentral
Journal of Occupational Medicine and Toxicology 2008, 3:4 />Page 6 of 6
(page number not for citation purposes)
sports drinks recommending these would not be sound;
fluid replacement beverages should have far less carbohy-
drate and ideally more than 15 mmol.L
-1
of sodium,
although in the authors' experience palatability limits
sodium content.
Conclusion
Based on the results of the current study the following
conclusions and recommendations are provided:
1. People working in moderately hot conditions for 10 hrs
on average will lose between 4.8 and 6 g of sodium (Na)
equivalent to 12–15 g of salt (NaCl) depending on accli-
matisation. However due to the substantial interindivid-
ual variation in sweat rate and sodium concentration
individual losses may be much higher. This essential elec-
trolyte must be replaced in order to avoid fluid imbal-
ances, thus eating during the shift is a must.
2. One work session in the heat, for an acclimatised per-
son is sufficient to activate sodium-conserving mecha-
nisms. However in the unacclimatised worker longer
exposure is required. A worker starting work in harsh con-
ditions should be given 10 days or more to acclimatise
before performing heavy manual work in the heat.
3. Cordials and sports drinks are contra-indicated for peo-
ple working in hot environments due to the very high
energy content. An ideal fluid replacement beverage for
industrial use should have significant sodium content
with minimum carbohydrate.
Abbreviations
VO
2
max: Maximal oxygen uptake; RH: Relative humidity;
WBGT: Wet bulb globe temperature; TWL: Thermal work
limit.
Authors' contributions
GB conceived the study and collected the majority of the
data. VM collected some data. GB and VM analysed and
interpreted the data and prepared the manuscript for pub-
lication. Both authors read and approved the final manu-
script.
References
1. Cheuvront SN, Carter R, Castellani JW, Sawka MN: Hypohydration
impairs endurance exercise performance in temperate but
not cold air. J Appl Physiol 2005, 99:1972-1976.
2. Hancock PA, Vasmatzidis I: Effects of heat stress on cognitive
performance: the current state of knowledge. Int J Hyperther-
mia 2003, 19:355-372.
3. Marino FE, Kay D, Serwach N: Exercise time to fatigue and the
critical limiting temperature: effect of hydration. Journal of
Thermal Biology 2004, 29:21-29.
4. Pilcher JJ, Nadler E, Busch C: Effects of hot and cold tempera-
ture exposure on performance: a meta-analytic review. Ergo-
nomics 2002, 45:682-698.
5. Donoghue AM, Sinclair MJ, Bates GP: Heat exhaustion in a deep
underground metalliferous mine. Occup Environ Med 2000,
57:165-174.
6. Brake DJ, Bates GP: Fluid losses and hydration status of indus-
trial workers under thermal stress working extended shifts.
Occup Environ Med 2003, 60:90-96.
7. Miller VS, Bates G: Hydration of outdoor workers in northwest
Australia. The Journal of Occupational Health and Safety - Australia and
New Zealand 2007, 23:79-87.
8. Barlow WK, Webster HL: A simplified method of sweat collec-
tion for the diagnosis of cystic fibrosis: ; Brighton, England.
Edited by: Lawson D. John Wiley & Sons; 1984:204-205.
9. Cena K, Bates G: Measurement of electrolyte loss in conditions
of heat stress. J Occ Health Safety Aust NZ 1992, 8:401-404.
10. Kirby CR, Convertino VA: Plasma aldosterone and sweat
sodium concentrations after exercise and heat acclimation.
Am J Physiol 1986, 161:R967-R970.
11. Fox RH, Goldsmith R, Kidd JD, Lewis HE: Acclimatization to heat
in man by controlled elevation of body temperature. J Physiol
Lond 1963, 166:530-547.
12. Hofler W: Changes in regional distribution of sweating during
acclimatization to heat. J Appl Physiol 1968, 25:
503-506.
13. Shirreffs SM, Maughan RJ: Whole body sweat collection in
humans: an improved method with preliminary data on elec-
trolyte content. J Appl Physiol 1997, 82:336-341.
14. Gazey C, Bates G, Matthew B: Fluid loss and replacement in
petroleum workers from the north west of Western Aus-
tralia. The Journal of Occupational Health and Safety -Australia and New
Zealand 1996, 12:457-461.