Evapotranspiration covers for landfills and waste sites - Chapter 4 doc
Bạn đang xem bản rút gọn của tài liệu. Xem và tải ngay bản đầy đủ của tài liệu tại đây (449.9 KB, 15 trang )
35
4
Evapotranspiration
Landfill Covers
The evapotranspiration (ET) landll cover is an innovative design with two
important characteristics:
It uses natural systems with no barrier layers.•
Measurements show that the concept was successful in natural systems for •
decades and centuries.
4.1 DEFINITION
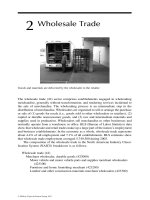
The ET landll cover works with the forces of nature rather than attempting to con-
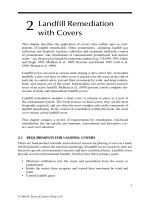
trol them. It utilizes a layer of soil covered by native grasses, and it contains no
barrier layers (Figure 4.1). The ET cover uses two natural processes to control inl-
tration into the waste: (1) the soil provides a natural water reservoir and (2) natural
evaporation from the soil and plant transpiration (ET) empties the soil water reser-
voir. At most sites, it is easy to build the ET cover to allow small or large percent-
ages of annual precipitation to enter the waste. It is an inexpensive, practical, easily
maintained, and self-renewing biological system. The ET cover will remain effective
over extended time periods, perhaps centuries.
4.1.1 mI n I m u m re q u I r e m e n t S a n d fu n c t I o n
The ET cover differs from “vegetative” covers because it requires optimization of
both cover soil properties and the plants grown on the cover. The “vegetative cov-
ers” described in the literature require neither, resulting in failure as described in
Chapter 3. The ET cover has the following minimum criteria:
The soil should hold enough water to minimize water movement below •
the cover and meet the requirements of the site.
The soil should support rapid and prolic root growth in all parts of the •
soil cover.
The vegetation established on the cover should be native to the site, adapted •
to the soil in the cover, and compatible with site remediation goals.
Because of these criteria, design and construction methods for ET covers differ from
both conventional barrier and recently reported vegetative covers that failed (see
Chapter 3).
ET covers need no barrier layers because the soil provides a reservoir that stores
and holds inltrating water. Inltrating rainfall moves downward as a saturated front,
© 2009 by Taylor & Francis Group, LLC
36 Evapotranspiration Covers for Landfills and Waste Sites
lling the soil pores as it advances deeper into
the soil. When the volume of water contained
in the saturated front is all stored in pores at
or below the eld water capacity for that soil,
downward movement becomes very slow.
Theoretical considerations and research
measurements, with evaporation controlled at
the surface, show that soil water may continue
to move downward for a long time after wet-
ting, but at a slow and exponentially decreas-
ing rate (Hillel 1998). The actual conditions
on rangeland, pasture, a cultivated eld, or on
an ET cover are different from the “covered
soil” conditions of the research site. On soils
with bare surfaces, water evaporates from the
surface soon after rain stops, thus establishing
upward gradients for water ow. Plants grow-
ing on the surface remove soil water faster than
evaporation alone. The upward hydraulic gra-
dient established by even a small amount of soil drying reverses the direction of
soil water movement, and soil water begins to move upward in response to natural
hydraulic gradients established by drying of the soil. This process reduces the rate of
downward soil water movement after the end of precipitation to a very small amount
in 1–48 h, depending on the soil. For practical purposes of plant growth and protec-
tion of landll waste, soil water is then stationary until it begins to move upward in
response to evaporation or water extraction by roots. The inltrated water is stored
within the soil mass until evaporation from the surface or plant roots removes it.
This basic process makes all plant and animal life on our planet possible. As it does
not rain every day, plants depend on stored soil water for sustenance during rainless
periods; the process has functioned for a long time.
If more water inltrates through the surface than the soil can hold at eld capac-
ity, some of it will move through the soil prole and appear as deep percolation. Good
design and construction practice controls percolation to meet site requirements.
4.1.2 So I l Wa t e r St o r a g e a n d Pl a n t ro o t S
The soil water reservoir is a major feature of an ET landll cover; it should be com-
posed of the largest possible volume of soil pores. It is desirable that much of the soil
pore volume be contained within the midsize pores because they hold much water
against the force of gravity, yet plants easily and quickly remove water from them.
Two important ingredients that control soil’s water-holding capacity are soil particle-
size-distribution and bulk density.
An ET cover controls inltrating water by storing it in the soil water reservoir.
In order to have reservoir capacity available when precipitation events occur, it is
necessary that the vegetation remove the stored water rapidly and maintain the soil
in the driest condition possible. Water removal from the soil reservoir is dependent
Foundation
Waste
Soil
Precipitation
FIGURE 4.1 Cross section of an ET
landll cover.
© 2009 by Taylor & Francis Group, LLC
Evapotranspiration Landfill Covers 37
on a large mass of healthy plant roots growing in all parts of the soil mass that
contain water. For practical purposes, plant roots must grow to the water in the soil,
because water movement to plant roots is limited to a small distance in the soil (see
Chapter 5). The soil should provide near-optimum conditions for plant root growth;
fortunately, optimum soil conditions are easy and inexpensive to create.
4.2 DIFFERENCES
Conventional landll covers (see Chapter 3) employ technology and construction
practice proved in road and dam construction, building foundations, reservoir liners,
and similar activities. That technology serves well in the applications for which it
was developed and when applied to design and construction of liners placed under
the waste. However, it produces failures when applied to an ET landll cover.
The ET landll cover applies different science and technology. Some require-
ments for ET covers are opposite from the technology adapted to conventional cov-
ers. For example, soil used as a construction material is commonly compacted to the
highest density that is practical in the eld. However, that approach when applied
to the “vegetative” covers (see Chapter 3) resulted in poor-to-unacceptable perfor-
mance. The soil in an ET cover should have low density.
4.3 CONCEPT BACKGROUND AND PROOF
The principles and technology that form the basis for the ET landll cover are well
understood, and eld measurements are available to test the concept. The measurements
prove the ET landll cover concept over periods of years, decades, and even millennia.
This chapter cites measurements from short-term experiments, decades-long
experiments, and the consequence of water movement during millennia. The long-
term measurements included measured water balance under grass during three
decades and eld measurements at other sites that demonstrated water movement
within soil proles during millennia. The measurements assessed the effect of
unusually wet periods, res, drought, and other natural events. These data demon-
strate that the ET cover can minimize movement of precipitation into stored wastes
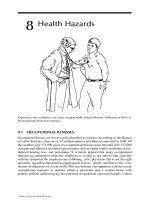
by using natural forces and the soil’s water-holding capacity. Figures 4.2 and 4.3
show the location of the measurements discussed here; they include hot, cold, wet,
and dry climates.
4.3.1 Wa t e r ba l a n c e b y So I l Wa t e r me a S u r e m e n t S
Some of the proof-of-concept measurements rely on soil water measurements.
Because there is no watertight bottom under these soil proles, some individuals
claim that soil water measurements do not provide accurate estimates of water bal-
ance or deep percolation. This claim may be true for thin soils located in wet cli-
mates or under unnatural environmental conditions.
Irrigation engineers have long used soil water measurements to estimate plant
water use under surface irrigation on level basins. The soil in irrigated elds is at or
near eld capacity several times during each growing season. Jensen (1968) stated,
© 2009 by Taylor & Francis Group, LLC
38 Evapotranspiration Covers for Landfills and Waste Sites
“The most common method of determining
water requirements of agricultural plants
under natural environmental conditions
for 5- to 20-day periods is by soil moisture
depletion. This method has been used exten-
sively in irrigated areas of the world and
in the western United States for more than
70 years.” Jensen (1967), Jensen and Haise
(1963), and Jensen and Sletten (1965) used
soil water measurements to estimate ET
from heavily irrigated sites. Their measure-
ments are widely used in irrigation design
and are similar to results of measurements
using other methods (Jensen et al. 1990).
They demonstrated that water balance esti-
mates for irrigated crops derived from soil
water content measurements are valid.
Important proof-of-concept measurements were made in the Great Plains on the
deep soils of that vast region. Under natural eld conditions found in the Great Plains,
the water content of the soil near the bottom of the potential root depth is small
and often near the wilting point year-round. Under these conditions, the unsaturated
hydraulic conductivity of soils in the lower part of the prole is diminishingly small.
Therefore, the ow rate through these dry layers in the lower part of the eld soil
prole is, for practical purposes, zero, and the water balance is dened by change in
soil water content and precipitation.
4.3.2 ex P e r I m e n t a l Pr o o f
Short-term eld experiments tested the ET cover concept at four dry sites having
signicantly different climate and soil resources and measured the performance of
the ET cover concept in a wet climate. Measurements of water balance at ve sites
in the central and northern Great Plains are available for a 30-year period and both
Canada
Short term
Wet site
Long term
Annual precipitation, mm
900
480
330
585
230
172
250 – 450
<160
FIGURE 4.2 Field verication sites.
FIGURE 4.3 Soil water-balance sites.
© 2009 by Taylor & Francis Group, LLC
Evapotranspiration Landfill Covers 39
soil water and lysimeter measurements over 33 years are available for a native grass
site in Colorado. Measurements demonstrated the result of many centuries of water
movement for a site in the southern Great Plains and for a large region in the north-
ern Great Plains.
4.3.2.1 Short-Term Experiments
There were seven experiments located at four sites in New Mexico, Idaho, Washing-
ton, and Nevada (Figure 4.2). The investigators evaluated water movement through
soil covers for 4–17 years (Nyhan et al. 1990; Anderson et al. 1993; Waugh et al.
1994; Anderson 1997; Andraski 1997; Forman and Anderson 2005; Fayer and Gee
2006). These experiments sampled annual precipitation amounts from less than
160 to 585 mm per year. They demonstrated that covers utilizing soil and natural
vegetation could minimize or prevent percolation of precipitation into the waste even
though the soil at some of these sites was not optimum for an ET cover.
4.3.2.2 Wet Climate and Modified Soil
Measurements are available for one wet site in east central Texas (Figure 4.2), where
average annual precipitation was 900 mm, and the soil resource was of poor quality.
Chichester and Hauser (1991) and Hauser and Chichester (1989) measured soil water
balance and soil chemistry for 6 years. Precipitation at the site was greater than the
long-term average during 5 of the 6 years of measurement.
They measured performance of grass grown on soils built from poor-quality
local subsoil and the undisturbed soil at the site. The eroded undisturbed soil at the
site had little topsoil, contained dense clay layers of low permeability, and had high
density beginning at a depth of 0.2 m in the prole. The clay layers in the undisturbed
soil were sufciently dense to limit root growth. The mixed subsoil plot simulated an
ET landll cover built from local soil. The subsoil plot was a mixture of several soil
layers from the local eroded soil; the soil mixture included the dense clay.
The site in east central Texas (Figure 4.2) demonstrated the performance of soil
modied in a similar fashion to that of an ET landll cover built from the poor-
quality soil–subsoil mixture. The mixed and amended subsoil produced forage yields
equal to that of the undisturbed soil. Hauser and Chichester (1989) measured both
soil water content and soil salt movement; these two measurements independently
measured the depth to which precipitation penetrated into the soil prole. Inltrating
water penetrated below 1.8 m on the undisturbed soil, but only about 0.6 m deep on
the mixed subsoil plot. The mixed subsoil had low soil density and allowed prolic
root growth; therefore, the grass removed precipitation from the soil rapidly, thus
limiting downward water movement. These measurements demonstrated success
with poor-quality soil in a wet climate.
4.3.3 lo n g -te r m Pr o o f
It is good that short-term experiments validated the concept. However, one expects
a landll cover to function as planned for decades or centuries; therefore, long-term
proof of the concept is required.
© 2009 by Taylor & Francis Group, LLC
40 Evapotranspiration Covers for Landfills and Waste Sites
4.3.3.1 Great Plains Water Balance
The classic paper by Cole and Mathews (1939) contained the results of water balance
measurements from ve locations in the Great Plains (Figure 4.3) extending over the
years 1907–1936. Two locations provided continuous water balance measurements
from native sod, and the others had partial records for native sod. In addition, they
measured soil water content under winter or spring wheat at each location. Wheat is
a grass plant, and it was grown every year (continuous wheat). Natural precipitation
was the only source of water at all sites.
Soil water measurements were complete for native sod grown on a silty clay
loam soil for 21 years at Mandan, North Dakota, and on a very ne sandy loam soil
during 25 years at North Platte, Nebraska. Cole and Mathews (1939) stated that for
both sites, water did not penetrate to depths beyond the roots of the native sod. Their
measurements also show that water did not move below the root zone of continuous
wheat at Havre, Montana; Hays, Kansas; and Colby, Kansas, where record lengths
were 21–28 years.
The review of measurements presented by Cole and Mathews (1939) demon-
strated no evidence that water moved below the root zone of native grass or con-
tinuous wheat at these ve locations. Either cool or warm season native plants grew
throughout most of the year on native sod; thus, they quickly removed water from
the soil. Winter wheat provided a more rigorous test of the concept than native sod
because continuous wheat utilized a 3-month-long fallow period during which water
accumulated in the soil prole. In spite of the fallow period between harvest and
planting of the succeeding crop, they measured no water movement below the root
zone of continuous wheat.
The water balance measurements reported by Cole and Mathews (1939) repre-
sent a large region (Figure 4.3). They measured water balance each year at each site
under both native grass and cultivated wheat during 21 to 28 year periods. The length
of their measurements is important. They found that no water moved below the root
zone of wheat or grass during the decades of measurement.
4.3.3.2
Pawnee National Grasslands
Sala et al. (1992) reported measurements of the soil water balance under native grass-
land in Northeastern Colorado (Figure 4.2). The mean annual precipitation at the site
during the 33 year study was 327 mm. The soil at the site is sandy loam in texture;
therefore, it has only moderate water-holding capacity. The authors concluded from
both eld soil and eld lysimeter measurements that it is unlikely that the soil prole
within the potential rooting depth of native range grasses would ever be completely
lled with water. Sala et al. (1992) stated, “No deep percolation beyond 135 cm was
recorded during the 33-year period.”
This is an important test site because soils with high water-holding capacity are
not available at all landll sites. The soil at the site has relatively low water-holding
capacity; however, the measurements demonstrated that no water moved below the
rooting depth of native grasses.
© 2009 by Taylor & Francis Group, LLC
Evapotranspiration Landfill Covers 41
4.3.3.3 Saline Seep Region
The saline seep region found in the Northern Great Plains of the United States and
southern Canada (Figure 4.2) provides opportunity to evaluate water movement in
soils of a vast region. The saline seep region covers parts of Montana, Wyoming,
South Dakota, and North Dakota in the United States, and Alberta, Saskatche-
wan, and Manitoba in Canada. The hydrogeology of the region was measured and
described by Ferguson and Bateridge (1982), Halvorson and Black (1974), Doering
and Sandoval (1976), Luken (1962), and Worcester et al. (1975). The soils that formed
over shale after the retreat of the glaciers provide a natural “lysimeter” covering mil-
lions of hectares.
Ferguson and Bateridge (1982) described the soils, plants, and hydrology associ-
ated with saline seeps. They state that the glacial till soils of the Northern Plains
developed from debris left by the ice ages 12,000–14,000 years ago on top of ancient
marine shales. Native short grass covered the surface and the natural subsoil contained
large amounts of soil salts beginning at depths of 0.5–1 m below the land surface.
Saline seeps rst appeared about 30 years after cultivation of dryland crops
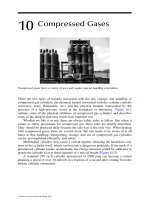
began in the region. Figure 4.4 is a conceptual cross section of soils in the saline seep
region. Summer fallow with spring wheat or winter wheat was widely practiced; it
prevented all plant growth for more than a year, thus allowing water to move below
the root zone of the crop during wetter-than-normal years. Field investigations in
Montana show that about 90 Mg/ha of salt moved downward with water percolat-
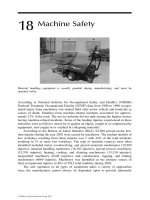
ing below the root zone of dryland crops (Ferguson and Bateridge 1982). Figure 4.5
shows measurements of the typical soil salt content estimated by electrical conduc-
tivity of the soil under both native grass and cultivated dryland. These data show
that percolating water removed signicant quantities of salt from the subsoil under
cultivated land, but not from soils under native grass.
Doering and Sandoval (1976) observed that the excess soil water accumulated
on cultivated land moved downward to natural layers of low permeability, then later-
ally to produce saline seeps at the base of slopes or other outcrops (Figure
4.4). In
contrast, excess soil water did not accumulate in soils covered continuously by native
grass. Halvorson and Black (1974) stated, “Native grasslands generally support
some actively growing vegetation throughout most of the growing season, reducing
Water Table Under Cultivation
Saline Shale
Cultivated
With Fallow
Saline Seeps
Water Table Under Grass
Soil
FIGURE 4.4 Conceptualized cross section of a saline seep.
© 2009 by Taylor & Francis Group, LLC
42 Evapotranspiration Covers for Landfills and Waste Sites
the chance of precipitation percolating beyond the root zone. As a result, saline
seeps are generally absent on rangeland.”
In summary, no water moved below the root zone of native grass. The following
process created the saline seeps (see Figure 4.4):
1. The root zone of both grass and wheat was within the nonsaline surface
soil. During occasional wet years, water percolated below the root zone of
wheat during the fallow period and dissolved salt from the saline subsoil.
2. The percolating saline water raised the water table under wheat and caused
groundwater to ow laterally.
3. Where the groundwater was near the soil surface down gradient from wheat,
plant water extraction and evaporation from the soil surface concentrated
salts in the surface soil and formed the saline seeps.
4. Where native grass grew on the land surface, no water percolated below
the root zone, the water table was stable and deep, and no saline seeps
emerged.
The saline seep region (Figure 4.2) provides a good example of how soils, plants, cli-
mate, and water interact during centuries. An ancient sea left saline shale deposits that
now lie below the modern soil. The soil–plant–climate system was in balance under
native grass and allowed no precipitation to move below about 0.9 m (Figure 4.5).
The native grass consumed water stored in the surface soil during each year, and
none moved into the shale as demonstrated by the salt prole in the shale and the lack
of saline seeps near native grass. The ecosystem of the saline seep region developed
in a cold, dry climate with long winters during which plants used little soil water.
Evaluation of the saline-seep region demonstrated that native grass prevented signi-
cant water movement through the thin soil prole during 12,000 years, because the
ice sheet melted in that region.
4.3.3.4
Texas High Plains
Aronovici (1971) measured soil water content, chloride, and salt movement in soil
proles under native grasslands, dryland wheat and sorghum, and irrigated wheat
and sorghum. His measurements extended from the surface to the 15 m depth at a
site near Amarillo, Texas (Figure 4.2). Mean annual precipitation is about 480 mm at
0
1
2
3
4
0 0.2 0.4 0.6 0.8
EC (sm
–1
)
Depth (m)
Native grass
Cultivated
1
FIGURE 4.5 Electrical conductivity of soil in saline-seep area of Montana. (Drawn from
data in Ferguson, H. and Bateridge, T., Soil Sci. Soc. Am. J., 46, 807–810, 1982.)
© 2009 by Taylor & Francis Group, LLC
Evapotranspiration Landfill Covers 43
that Southern High Plains location. The Pullman clay-loam soil at the site has a high
shrink-swell capacity and cracks extensively when dry. Prairie dogs and other small
burrowing animals historically populated it and excavated holes in the soil. The soil
throughout the 15 m depth contained many root and wormhole casts ranging in size
from less than 1 to 5 mm (Aronovici 1971). The soil offered numerous preferential
ow paths from the surface to the 15 m depth.
Figure 4.6 contains cumulative soil-water content measurements, by Aronovici
1971, in Pullman clay-loam soil and the underlying Pleistocene sediments. He stated
that two of the three sampling sites under grass were unusually dry at depth, thus
creating high soil strength that prevented sampling to the intended depth of 15.2 m.
The soil water content under grass was below the plant wilting point beginning at 1
m below the surface and extending to the 15 m depth.
The data shown in Figure 4.6 for “heavy irrigation” were from a plot that was
irrigated for 20 years; during 14 of those years, it was heavily irrigated in level bor-
ders. This condition offered the maximum potential for deep percolation below the
root zone and wetted the soil and underlying Pleistocene sediments to near the eld
capacity to the 15.2 m depth.
Soil chemistry offered a way for Aronovici (1971) to make an independent deter-
mination about water movement downward through the soil prole. Chloride and
electrical conductivity data show large accumulations of the chloride ion and salts
from 0.9 to 1.8 m under native grass (Aronovici 1971). For example, Figure 4.7 shows
signicant deposits of calcium plus magnesium measured for the Pullman soil under
native grass at the site. The high-salt layer between 0.9 and 1.8 m under native grass
is a result of natural processes. It is common for soil proles in arid and semiarid
regions to contain soil layers that are high in salt. Precipitation amount at the site
determines their depth below the land surface. Precipitation dissolves soil salts from
surface soil layers and transports them downward in the soil. Plants remove water,
but little salt from each soil layer; therefore, over time, salt accumulates at the bottom
of the soil-wetting front. This process is a strong indicator of past leaching potential
Depth Below Surface, m
0
1
2
3
4
5
08 20
Soil Water, m
Saturation
Wilting
point
Heavy irrigation
3 Grassland sites
Field
capacity
16124
FIGURE 4.6 Cumulative soil-water content in Pullman clay loam soil and underlying Pleis-
tocene sediments. (Drawn from data in Aronovici, V. S., Percolation of Water through Pull-
man Soils, Texas High Plains, Bulletin B-1110, Texas A&M University, College Station, TX,
1971.)
© 2009 by Taylor & Francis Group, LLC
44 Evapotranspiration Covers for Landfills and Waste Sites
at the site. Salt accumulation in the soil demonstrates that little or no water moved
below the depth of accumulation. In this case, little or no water moved below the
1.8 m depth.
The chloride ion is a good indicator of recent water movement in a soil prole
because it is highly soluble and moves with percolating water. Figure 4.8 shows that
on grassland, chloride accumulated below the 0.8 m depth, indicating that water
movement stopped near that depth. The chloride in the upper 4 m of the prole fell
from the historical value of 10 meq/L under grass to about 5 meq/L or less under
heavily irrigated land. The large accumulation of chloride ion in the sediments below
11 m suggests that the 11–15-m depth is the extent of leaching under irrigation during
the 20-year period (Figure 4.8).
0
5
10
15
0 10 20 30 40
0 10 20 30 40
Meq/l, Cl
Depth, m
Grassland
0
5
10
15
Meq/l, Cl
Irrigated
FIGURE 4.8 Distribution of chlorides in Pullman soil and underlying Pleistocene sedi-
ments, Bushland, Texas. (Drawn from data in Aronovici, V. S., Percolation of Water through
Pullman Soils, Texas High Plains, Bulletin B-1110, Texas A&M University, College Station,
TX, 1971.)
0.0
1.0
2.0
3.0
030
CA + Mg, Meq/l
10 20
Depth, m
FIGURE 4.7 Calcium plus magnesium content of soil at the grassland site, Bushland, Texas.
(Drawn from data in Aronovici, V. S., Percolation of Water through Pullman Soils, Texas High
Plains, Bulletin B-1110, Texas A&M University, College Station, TX, 1971.)
© 2009 by Taylor & Francis Group, LLC
Evapotranspiration Landfill Covers 45
Aronovici (1971) measured soil water content directly and independently veried
the conclusion with soil chemistry. He concluded, “There has been little or no deep
percolation on native or revegetated grassland within historic time where natural
surface drainage occurs.”
The soils at the Texas High Plains site are different and the climate at the site is
wetter than both the saline seep region and the grassland site in eastern Colorado.
Important features of the soil on the Texas High Plains include the dense clay layers
contained within the upper 1.2 m of the root zone. The upper 1 m of soil has high
shrink-swell capacity and cracks extensively when dry; it contains wormholes, ani-
mal burrows, and other openings. The dense, limiting layers in the upper 1.2 m of
soil have hydraulic conductivity of about 0.03 m/day when wet, and limit the intake
of irrigation or rainfall.
The parent material of the Texas High Plains site is Pleistocene sediment. The
root zone below 1.2 m is primarily porous, partially cemented Pleistocene mate-
rial including cracks, large pores, wormholes, animal burrows, and other openings.
Schneider and Jones (1983, 1988) demonstrated that water moves easily through the
porous parent material. They measured the water intake rate of the Pleistocene sedi-
ment and found that it was 0.4 m/day, 10 times the value for the surface layer. The
highly permeable material extended from the 1.2-m depth to the water table at 55 m.
Soil layers within the upper root zone have elevated density; they reduce root
growth, thus reducing the rate of water extraction by plants from the bottom of the
soil prole. Roots grow in the partially cemented Pleistocene material, but it is not
known if the soil strength limits total root mass.
The natural soil is fertile, but less than perfect for an ET landll cover. High-
density soil layers reduce root growth, and preferential ow pathways are present
throughout the soil and the underlying permeable sediments. Hydrologic measure-
ments demonstrated that native grass prevented signicant water movement through
the soil prole over thousands of years.
4.4 RECOVERY FROM FIRE
Fire may remove the vegetation from an ET landll cover. It is a natural part of grass
ecosystems on the Texas High Plains and the Saline Seep Region; however, there
was no evidence that water moved below the root zone of grass at either site.
Fire removes the aboveground portion of the plants in a grass ecosystem, but
kills few plants in the cover. Most of the native grass plants whose tops were burned
begin growing from the plant crowns and roots immediately. Following the rst rain
after a re, many species of plants spring up from the seed store in the soil.
Tree cover may or may not recover rapidly after a re, depending on the severity
of the re, tree size and age, and other causes. Forbs and grass may replace trees for
a few years following re.
Porro (2001) simulated the effect of re with a severe and articial condition
that is unlikely to occur in nature. He measured the effect of heavy irrigation on soil
covers built in a cold desert site where no plants grew on the soil surface during the
3-year measurement period. He saturated the soils to initiate drainage from each
prole. The average annual precipitation during the 3-year measurement period was
© 2009 by Taylor & Francis Group, LLC
46 Evapotranspiration Covers for Landfills and Waste Sites
232 mm. However, within 2 years of soil saturation, evaporation from the soil sur-
face restored the capability of the soil columns to function as intended.
Although re may cause other damage to a landll, it is unlikely to impair the
ability of an ET landll cover to control soil water movement.
4.5 COST COMPARISON
Hauser et al. (1999) reported that construction of conventional landll covers built
for the air force cost between $319,000 and $571,000 per acre of surface covered.
They also reported rm cost estimates by consulting engineers, and indicated that
construction of ET covers for similar landlls would cost less than half as much as
conventional covers.
The ET cover is less costly to build than conventional covers because it needs
no barrier layers and no drainage layers. Hauser et al. (2001) performed detailed
construction cost estimates for conventional RCRA and ET covers for the southern
Great Plains. They found that construction costs for an ET cover varied from 35 to
72% of the costs for conventional covers. Typically, ET cover construction should
cost less than half of a conventional cover.
Because the ET cover is self-renewing, its maintenance costs are small. If a
depression, crack, or hole develops on an ET cover, repair is simple and inexpensive;
it requires only lling with soil to reestablish grade and replanting the grass cover.
Repair of a conventional cover is more difcult and more expensive.
4.6 ADVANTAGES AND DISADVANTAGES
The ET cover is an effective, natural, self-renewing cover that typically meets the
requirements for a cover at a site and costs about half as much as conventional covers.
It is suitable for use at most sites. The ET cover is suitable for remediation of munici-
pal and industrial landlls, mining waste, or contaminated soil and waste piles.
The ET landll cover may satisfy differing site requirements. It applies when
the requirements for a cover demand little or no movement of precipitation into the
waste. At the other extreme, its design and construction is exible and it can allow a
small or a large percentage of average annual precipitation to enter the waste in order
to meet the requirements for a bioreactor landll. Table 4.1 summarizes advantages
and disadvantages of ET covers.
4.6.1 ad v a n t a g e S
Because the ET cover is natural and self-renewing, it is less prone to failure. These
natural attributes also lead to a long service life. It meets site-specic cover require-
ments, and it is well adapted for use on bioreactor landlls. A cover that is less prone
to fail is also more protective of the environment and public health. At most sites, it
will have low costs for both construction and maintenance.
Gas control is easy to install during construction or afterward. Conventional
horizontal collection pipes or vertical pipes may be used. Because there is no barrier
© 2009 by Taylor & Francis Group, LLC
Evapotranspiration Landfill Covers 47
layer to protect, drilling and installation of vertical gas control wells through the
ET cover does not threaten the integrity of the cover. The ET cover allows several
options for gas control, if needed, either during or after cover construction.
4.6.2 dI S a d v a n t a g e S
Each site needs a site-specic design because climate, soil, plant cover, and site
requirements are unique for each site. The U.S. EPA regulations contain design
parameters for conventional covers, but not for ET landll covers. It is impractical
to move cover soil for long distances; therefore, adequate soil should be located near
the site.
Land used as a landll was, for practical purposes, previously dedicated to the
single purpose of preserving waste; therefore, the options for reuse are limited for
any landll. The use of an ET landll cover may alter the potential reuse choices;
however, the primary restrictions are the same for all cover types.
4.7 CONCEPT USE
This chapter describes conrmation of the ET landll cover concept at 13 loca-
tions; however, it is necessary to use the concept at sites far from the measured sites
described here. Successful ET covers utilize soils and plants combined in a system
that will control precipitation and meet all cover requirements for a particular land-
ll. ET cover design is best accomplished with the aid of a suitable comprehensive
model to evaluate the numerous interactions among soils, plants, and climate in a
site-specic design.
Successful use of the ET cover concept at a specic site requires that we (1) under-
stand factors that control performance of an ET cover and (2) apply suitable design
and construction methods. Chapters 5 and 6 explain basic technology; Chapters 7
through 11 explain pertinent design and construction considerations.
TABLE 4.1
Advantages and Disadvantages of ET Landfill Covers
Advantages Disadvantages
Meets site-specic cover requirements Requires site-specic design
Natural, self-renewing system Requires adequate soil resource nearby
Less prone to fail Reuse restricted
Long life
More protective
Easily repaired
Well adapted to bioreactor landlls
Low construction and maintenance cost
More options for gas control
© 2009 by Taylor & Francis Group, LLC
48 Evapotranspiration Covers for Landfills and Waste Sites
REFERENCES
Anderson, J. E. (1997). Soil-plant cover systems for nal closure of solid waste landlls in
arid regions. In Landll Capping in the Semi-Arid West: Problems, Perspectives, and
Solutions, Reynolds, T. D. and Morris, R. C., Eds. Environmental Science and Research
Foundation, Idaho Falls, ID, pp. 27–38.
Anderson, J. E., Nowak, R. S., Ratzlaff, T. D., and Markham, O. D. (1993). Managing soil
moisture on waste burial sites in arid regions, J. Environ. Qual., 22, 62–69.
Andraski, B. J. (1997). Soil-water movement under natural-site and waste-site conditions:
A multiple-year eld study in the Mojave Desert, Nevada. Water Resour. Res., 33(8),
1901–1916.
Aronovici, V. S. (1971). Percolation of Water through Pullman Soils, Texas High Plains. Bul-
letin B-1110. Texas A&M University, College Station, TX.
Chichester, F. W. and Hauser, V. L. (1991). Change in chemical properties of constructed mine-
soils developing under forage grass management. Soil Sci. Soc. Am. J., 55, 451–459.
Cole, J. S. and Mathews, O. R. (1939). Subsoil Moisture under Semiarid Conditions. Tech.
Bulletin 637, U.S. Department of Agriculture, Washington, DC.
Doering, E. J. and Sandoval, F. M. (1976). Hydrology of saline seeps in the northern Great
Plains, Trans. ASAE, 19(5), 856–861, 865.
Fayer, M. J. and Gee, G. W. (2006). Multiple-year water balance of soil covers in a semiarid
setting, J. Environ. Qual., 35, 366–377.
Ferguson, H. and Bateridge, T. (1982). Salt status of glacial till soils of north-central Montana
as affected by the crop-fallow system of dryland farming, Soil Sci. Soc. Am. J., 46,
807–810.
Forman, A. D. and Anderson, J. E. (2005). Design and performance of four evapotranspiration
caps, Pract. Period. Hazardous, Toxic, Radioactive Waste Manage., 9(4), 263–272.
Halvorson, A. D. and Black, A. L. (1974). Saline-seep development in dryland soils of north-
eastern Montana, J. Soil Water Conserv., 29, 77–81.
Hauser, V. L. and Chichester, F. W. (1989). Water relationships of claypan and constructed
soil proles, Soil Sci. Soc. Am. J., 53(4), 1189–1196.
Hauser, V. L., Gimon, D. M., Hadden, D. E., and Weand, B. L. (1999). Survey of Air Force
Landlls, Their Characteristics, and Remediation Strategies. The Air Force Center for
Environmental Excellence (AFCEE), Brooks City Base, San Antonio, TX. http://www.
afcee.brooks.af.mil/products/techtrans/landllcovers/LandllProtocols.asp (accessed
March 14, 2008).
Hauser, V. L., Weand, B. L., and Gill M. D. (2001). Natural covers for landlls and buried
waste, J. Environ. Eng., 127(9), 768–775.
Hillel, D. (1998). Environmental Soil Physics. Academic Press, San Diego, CA.
Jensen, M. E., Burman, R. D., and Allen, R. G., Eds. (1990). Evapotranspiration and Irri-
gation Water Requirements. Manual of Practice No. 70, American Society of Civil
Engineers, Reston, VA.
Jensen, M. E. and Haise, H. R. (1963). Estimating evapotranspiration from solar radiation,
J. Irrig. Drainage Division, Am. Soc. Civil Eng., 89, 15.
Jensen, M. E. and Sletten, W. H. (1965). Evapotranspiration and Soil Moisture-Fertilizer
Interrelations with Irrigated Grain Sorghum in the Southern Great Plains. Conserva-
tion Research Report No. 5, U.S. Department of Agriculture, Washington, DC.
Jensen, M. E. (1967). Empirical methods of estimating or predicting evapotranspiration using
radiation. In Proceedings of Evapotranspiration: Its Role in Water Research Manage-
ment Conference. American Society of Agricultural Engineers, St. Joseph, MI.
Jensen, M. E. (1968). Water consumption by agricultural plants. In Water Decits and Plant
Growth, Vol. 2. Academic Press, New York.
© 2009 by Taylor & Francis Group, LLC
Evapotranspiration Landfill Covers 49
Luken, H. (1962). Saline soils under dryland agriculture in southeastern Saskatchewan (Can-
ada) and possibilities for their improvement. Plant and Soil, 17, 1–25.
Nyhan, J. W., Hakonson, T. E., and Drennon, B. J. (1990). A water balance study of two land-
ll cover designs for semiarid regions, J. Environ. Qual., 19, 281–288.
Porro, I. (2001). Hydrologic behavior of two engineered barriers following extreme wetting,
J. Environ. Qual., 30, 655–667.
Sala, O. E., Lauenroth, W. K., and Parton, W. J. (1992). Long-term soil water dynamics in the
shortgrass steppe, Ecology, 73(4), 1175–1181.
Schneider, A. D. and Jones, O. R. (1983). Basin recharge of playa water, J. Irrig. Drain. Eng.,
109(3), 309–316.
Schneider, A. D. and Jones, O. R. (1988). Ground water recharge through excavated basins.
In Articial Recharge of Ground Water Symposium, American Society of Civil Engi-
neers, Anaheim, CA, Aug. 1988. American Society of Civil Engineers, Reston, VA.
Waugh, W. J., Thiede, M. E., Bates, D. J., Cadwell, L. L., Gee, G. W., and Kemp, C. J. (1994).
Plant cover and water balance in gravel admixtures at an arid waste-burial site, J. Envi-
ron. Qual., 23, 676–685.
Worcester, B. K., Brun, L. J., and Doering, E. J. (1975). Classication and management of
saline seeps in western North Dakota, North Dakota Farm Res., 33(1), 3–7.
© 2009 by Taylor & Francis Group, LLC