Evapotranspiration covers for landfills and waste sites - Chapter 5 doc
Bạn đang xem bản rút gọn của tài liệu. Xem và tải ngay bản đầy đủ của tài liệu tại đây (1.03 MB, 32 trang )
51
5
Basic Technology
Each evapotranspiration (ET) landll cover should satisfy the requirements
of the site; this requires integration of concepts and principles from soil and
plant science as well as engineering elds. Because there are several potential
combinations of the technology, it is possible to provide a cover that meets the
unique situation at a particular site.
Robust plant growth is necessary to satisfy the requirements for a landll cover,
but some factors may limit plant growth and effectiveness. Fortunately, it is
relatively easy and economical to remove, control, or manage limitations to
plant growth in constructed soils such as in a landll cover. However, removal
of limitations requires knowledge of soil properties, the principles of plant
growth, and their interactions with other factors.
This chapter explores basic concepts that govern success of the ET landll
cover; it does not cover each scientic topic in detail. Soil water balance and
hydrology are basic technology and they incorporate basic scientic principles;
they are discussed separately in Chapter 6. Appendix A contains a reference
bibliography to assist the reader in nding additional information, if needed.
5.1 SOIL
Table 5.1 contains a list of soil properties that are important to the success of ET
landll covers, and this book contains a discussion of the most important of these.
Hillel (1998), Marshall et al. (1996), Carter (1993), and SSSA (1997) more fully
describe soil properties.
If necessary, the landll owner may change the plants growing on an ET cover
after the cover is complete. The landll owner may improve soil with fertilizer, lime,
or compost after cover construction; however, changing soil physical properties or
nutrient-holding capacity after construction is complete is very costly. It is important
to understand the soil.
5.1.1 So I l Ph y S I c a l Pr o P e r t I e S
Soil physical properties are important to successful application of the ET landll
cover, but construction of an ET landll cover modies the physical properties of
the soil used to create the cover. Soil modication during construction may either
(1) improve the soil or (2) damage the soil and reduce the opportunity for success.
© 2009 by Taylor & Francis Group, LLC
52 Evapotranspiration Covers for Landfills and Waste Sites
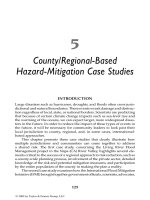
Soil is composed of solids, liquid, and air. The solid phase includes inorganic
products of rock weathering, organic products of the ora and fauna that inhabit
the soil, and highly weathered minerals such as clay. The organic matter content of
fertile soil may be near zero or up to 5% of the mineral matter of the solid phase for
most soils; peat soils are an exception and their organic matter content can be near
100%. However, peat covers small areas of the Earth, and when drained oxidizes
rapidly; thus, it should not be used in ET covers. Figure 5.1 illustrates the relative
volume of each component for a typical fertile soil.
5.1.1.1 Solids
The solid particles are highly irregular in shape and size. Their size is measured
by the sieve opening through which they pass or for ne materials, by their set-
tling velocity in water. The U.S. Department of Agriculture (USDA) standardized
particle-size descriptions for agricultural use; their system is useful for describing
soils in which plants grow and it is used throughout this book.
TABLE 5.1
Important Soil Properties and Factors
Basic Properties Other Properties Factors
Particle size distribution Available water capacity Water content
Bulk density Field capacity/wilting point Temperature
pH Tilth Oxygen in soil air
Soil salinity Soil strength Bacteria
Soil sodium content Aeration properties Fungi
Kind of clay mineral Available nutrient supply Toxic substances
Total porosity Fertility Ammonia
Percentage large pores Cation exchange capacity CO
2
from decaying OM
Humus content Hydraulic conductivity Methane
Air
Water
Organic
matter
Mineral
Matter
FIGURE 5.1 Schematic composition (by volume) of a typical medium-textured soil; the
solid matter constitutes 50% and the pore space 50% of the soil volume. The arc demonstrates
that as water content changes, air content changes in response.
© 2009 by Taylor & Francis Group, LLC
Basic Technology 53
Soil material contains particles smaller than 2 mm; however, some soils contain
stones and particles larger than 2 mm. Soils containing gravel and rock may be use-
ful construction material, but they may be unsuitable for use in ET cover soils. Stones
and particles larger than 2 mm reduce the water-holding capacity and dilute the
nutrient-supplying capacity of the soil. Only material smaller than 2 mm is included
as soil when evaluating ET cover soils.
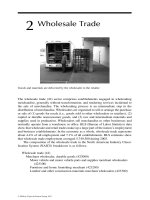
The USDA soil classication denes the particle sizes of soil material as follows:
clay less than 0.002 mm, silt between 0.002 and 0.05 mm, and sand between 0.05
and 2 mm. The relative proportions of the various separates (particle sizes) that make
up a soil dene soil texture. Figure 5.2 shows the textural triangle and names of the
conventional textural classes (SSSA 1997).
5.1.1.2 Liquid
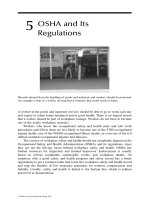
The liquid component of soil is principally water, but it contains materials dis-
solved from the soil; thus, it is soil solution although in common practice it is usually
called soil water. Soil water and air are contained within, and ll the soil pore space
(Figure 5.3). Large pores favor movement of water and air, both of which are nec-
essary for good plant growth. The force holding water contained within large soil
pores is small; however, the force holding water contained in small pores may be
very large. The forces holding part of the soil water are so great that plants cannot
effectively remove it.
Soil water below the water table exists at a positive hydrostatic head, and its
pressure is taken as zero, or atmospheric, at the water table. Soil water held in soil
above the water table exists at a negative pressure potential relative to the atmo-
sphere. The negative pressure of soil water in the vadose zone is called matric poten-
tial, matric suction, capillary potential, and soil water suction; the terms are used
100
% Sand
% Silt
% Clay
90
80
70
30
40
50
60
70
80
90
100
60
50
40
30
20
10
Clay
Silt Loam
Loam
Sandy Loam
Sand
Loamy Sand
Clay Loam
Sandy
Clay
Sandy
Clay Loam
Silt
Silty Clay
Loam
Silty
Clay
10
20
100 90 80 70 60 50 40 30 20 10
FIGURE 5.2 The soil textural classes. (Drawn from data in SSSA, Glossary of Soil Science
Terms, Soil Science Society of America, Madison, WI, 1997.)
© 2009 by Taylor & Francis Group, LLC
54 Evapotranspiration Covers for Landfills and Waste Sites
interchangeably. The negative pressure of
soil water is explained by analogy with
the negative pressures observed in small
capillary tubes inserted into pure water.
Even though no uniform, tubular capillary
shapes exist in the soil (Figure 5.3), the
analogy serves well to describe water pres-
sure in unsaturated soil. There are both cap-
illary and adsorptive forces between water
and the soil matrix; they bind the water to
the soil and produce the negative matric
potential. As the soil dries, the water lms
within the soil become thinner, resulting
in progressively more negative pressures
within the remaining water.
Soils high in total salts tend to produce soil solution with high osmotic potential.
High osmotic potential signicantly reduces the availability of soil water to plants,
and it increases the negative force or pressure against which plants must work to
remove water from the soil. The sum of the osmotic potential and matric potential
determines the negative force needed within the plant to remove water from the soil.
Osmotic potential reduces the amount of water that plants can withdraw from the
soil, and some dissolved solids may produce toxic effects on plant growth.
Immediately after rainfall or irrigation, the soil solution is dilute; however, as
plants withdraw water from the soil, the solution is concentrated. Therefore, plants
may grow satisfactorily in soils with low-to-moderate salinity when the soil is wet,
but they cannot remove water to the conventional wilting point determined by matric
suction. Thus, soils with elevated salt content may signicantly reduce the effective-
ness of ET landll covers even though plants may survive on the cover. (For addi-
tional information on water and plants, see Stewart and Nielsen 1990.)
5.1.1.3
Air
The largest soil pores drain freely by gravity, thus providing space for the soil air,
which is held primarily in the largest pores, although some air is contained or trapped
in small pore spaces, where it may be surrounded by water. The source of soil air
is atmospheric air, but plant respiration, chemical reactions, and microbial activity
modify its properties within the soil mass. Diffusion between the atmosphere and
the soil air is important in replenishing it. Drainage of large pores following rainfall
or irrigation draws fresh air into the soil, and wind turbulence enhances air exchange
between the soil mass and the air.
5.1.2 So I l Wa t e r
Soil water content is expressed as percent by wet or dry weight of the soil mass or
as volumetric water content (SSSA 1997; Hillel 1998). Units of volumetric water
content are commonly cm
3
/cm
3
; during ET cover evaluation and design, they are eas-
ily converted to millimeter, centimeter, or meter of water per unit depth of the soil.
Solid
Water
Solid
Air
Water
Saturated
Unsaturated
FIGURE 5.3 Conceptualized, saturated,
and unsaturated soil.
© 2009 by Taylor & Francis Group, LLC
Basic Technology 55
Soil-water content expressed as volumetric water content is preferred for ET cover
design and evaluation because it is compatible with other hydrologic and engineer-
ing units.
5.1.2.1 Soil Water-Holding Capacity
The water-holding properties of ET cover soils are important to success. Soils that
hold much water will achieve the desired water control with a thinner layer of soil
than those with low water-holding capacity. Important water-holding properties
include the permanent wilting point, eld capacity, and plant-available water content;
they are dened by the Soil Science Society of America (SSSA 1997). It is important
to understand the scientically correct denitions, but the following approximations
of the volumetric soil water content for each are sufciently accurate for engineering
design:
Wilting point—the laboratory-measured water content at −1.5 MPa (about •
−15 atm) pressure
Field capacity—the laboratory-measured water content at −0.03 MPa (about •
−1/3 atm) pressure
Plant-available water capacity (AWC)—volumetric water content, estimated •
by the difference between eld capacity and wilting point
The AWC for soils may range from about 7 to 25% by volume; the range for many
soils acceptable for use in ET covers is between 10 and 20% by volume. Table 5.2
contains estimates of water-holding characteristics for soil having 2.5% organic mat-
ter, no salinity or gravel and requiring no soil density adjustment. The estimates were
calculated by the Hydraulic Properties Calculator (Saxton 2005; Saxton and Rawls
2005).
Table 5.2 contains estimates derived from particle-size distribution of soils
typical of widely differing textural classes. During early planning and preliminary
engineering design, approximations of water-holding properties are adequate. Soil
properties are available in USDA soil reports or they may be estimated from soil tex-
ture by methods similar to those described by Saxton (2005) and by Saxton and
Rawls (2005). However, properties of soils intended for use in the cover should be
measured, and the measured values should be used in the nal design.
5.1.2.2
Soil Water Pressure
Most plants can survive saturated soils for only short time periods, a few hours to a
few days, depending on temperature and other factors. Phreatophytes can grow in
saturated soils having zero or positive water pressure.
Water held in soils supporting most plants exists at negative pressure for most of
the time. The negative pressure may be less than −30 atm in dry soil. The water held
in plants is also at negative pressure and plant water pressure may be below −40 atm.
In order for plants to extract water and the associated nutrients from soil, they must
exert a more negative pressure at the root–soil interface than exists in the soil in
which they grow. Plants grow best when plant and soil water pressures are relatively
© 2009 by Taylor & Francis Group, LLC
56 Evapotranspiration Covers for Landfills and Waste Sites
near zero in a well-aerated soil, in that condition, large soil pores are lled with air
and the water content is near eld capacity. The physics of water movement in the
unsaturated soil of an ET landll cover is different from that below the water table,
where pressures are positive and hydraulic conductivity of a particular soil mass is
constant.
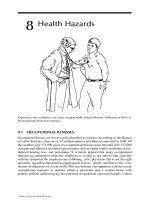
The relationship between soil water pressure and water content is a unique func-
tion for each soil, and there are large differences between these relationships for
different soils. Water-holding properties of soils are controlled by several factors,
the most important being particle-size distribution, but clay minerals, soil density,
and organic matter are also important. Figure 5.4 illustrates the relationship between
soil water content and soil water pressure calculated for two soils with the Hydraulic
Properties Calculator (Saxton 2005).
Table 5.3 contains soil properties and estimates by the Hydraulic Properties Cal-
culator for the soils illustrated in Figure 5.4 (Saxton 2005; Saxton and Rawls 2005).
Soil organic matter was 1%, salinity was 0.0 ds/m, and gravel content was 0.0% for
both soils.
Examination of Table 5.3 and Figure 5.4 reveals interesting facets of soil phys-
ics. At the wilting point and eld capacity, respectively, the water content of the clay
loam soil is 2.9 and two times greater than for the sandy loam soil. The plant-available
TABLE 5.2
Estimated Water-Holding Characteristics for Typical Soils
Texture Class
Sand
(%W)
Clay
(%W)
W P
a
(%v)
F C
b
(%v)
Sat.
c
(%v)
AWC
d
(%v)
Loamy sand 80 5 5 12 46 7
Loam 40 20 14 28 46 14
Silt loam 20 15 11 31 48 20
Silt 10 5 6 30 48 25
Sandy clay 60 25 17 27 43 10
Silty clay 10 35 22 38 51 17
Clay 25 50 30 42 50 12
Note: Numbers calculated by the “Soil Water Characteristics Hydraulic
Properties Calculator” published on the Web and available to the
public.
a
Wilting point.
b
Field capacity.
c
Saturation.
d
Plant-available water-holding capacity.
Source: From Saxton, K. E., Soil water characteristics, hydraulic properties
calculator, Agricultural Research Service, USDA, http://hydrolab.
arsusda.gov/soilwater/Index.htm (accessed March 3, 2008), 2005;
and Saxton, K. E. and Rawls, W. J., Soil water characteristic esti-
mates by texture and organic matter for hydrologic solutions, Agri-
cultural Research Service, USDA, />SPAW%20Download.htm (accessed March 3, 2008), 2005.
© 2009 by Taylor & Francis Group, LLC
Basic Technology 57
water capacity, however, is only 1.4 times greater for the clay loam than for the sandy
loam soil. The drainage from a saturated condition to the eld capacity is 2.4 times
greater for the sandy loam than for the clay loam soil. For soil water content between
eld capacity and wilting point, a small change in water content produces a large
change in soil water pressure for both soils; thus, even a small amount of soil drying
at the surface can create upward soil water gradients.
–0.001
–0.01
–0.10
–1.0
–10.0
0.0 0.1 0.2 0.30.4 0.5
Soil Water, v/v
MPa
Sandy Loam
Clay Loam
WP
WP
FC
FC
Sat
0
FIGURE 5.4 Water pressure as a function of water content for two soils, showing wilting
point (WP), eld capacity (FC), and saturation (Sat.).
TABLE 5.3
Calculated Water Content, Water Pressure and Hydraulic
Conductivity for Two Soils Described in Figures 5.4 and 5.5
Soil and Particle-
Size Distribution
(% by wt.) Property
Water
Content
(v/v)
Water
Pressure
(MPa)
Hydraulic
Conductivity
(cm/day)
Sandy loam
(sand: 60%, silt:
30%, and clay: 10%)
Wilting point 0.07 −1.5 0.0000001
Field capacity 0.17 −0.03 0.004
Saturation 0.41 0 90
Clay loam
(sand: 33%, silt:
33%, and clay: 33%)
Wilting point 0.20 −1.5 0.000006
Field capacity 0.34 −0.03 0.06
Saturation 0.44 0 8
Note: Numbers calculated by the “Soil Water Characteristics, Hydraulic Properties
Calculator” published on the Web and available to the public.
Source: From Saxton, K. E., Soil water characteristics, hydraulic properties calcu-
lator, Agricultural Research Service, USDA, />soilwater/Index.htm (accessed March 3, 2008), 2005; and Saxton, K. E.
and Rawls, W. J., Soil water characteristic estimates by texture and organic
matter for hydrologic solutions, Agricultural Research Service, USDA,
(accessed
March 3, 2008), 2005.
© 2009 by Taylor & Francis Group, LLC
58 Evapotranspiration Covers for Landfills and Waste Sites
5.1.3 hy d r a u l I c co n d u c t I v I t y o f So I l
The physics of water movement within the soil is important for an understanding
of the principles that govern the performance of an ET landll cover. The modern
understanding of water movement in unsaturated soils has been under development
for at least 150 years, and the development of new concepts continues in the modern
era. Darcy (1856) provided the earliest known quantitative description of water ow
in porous mediums. The basis for modern equations for both saturated and unsatu-
rated soil water ow is Darcy’s equation.
The actual ow pathways for water in either saturated or unsaturated soil are so
irregular and tortuous that it is impossible to describe ow in microscopic detail;
therefore, ow is described macroscopically. The discharge rate, Q, through a col-
umn or dened soil mass is the ow volume, V, per unit time, t. Q is directly propor-
tional to the cross-sectional area of ow, A, and to the change in hydraulic head, ∆H,
across the ow length, and inversely proportional to the ow length, L:
QVtAHL=∝//()∆
The change in hydraulic head is the total head relative to a reference level, at the
inow boundary, H
i
, minus the total head relative to the same reference level at
the outow boundary, H
o
. Therefore, ∆H is the difference between these heads:
∆HHH
io
=−
Obviously, ow is zero when ∆H = 0.
The change in head in the direction of ow (∆H/L) is the “hydraulic gradient,” and
it is the force driving the ow. The volume of ow through a unit of cross-sectional
area of soil per unit of time, t (Q/A), is called the ux density (or simply the ux) and
is indicated by q. Therefore, the ux is proportional to the hydraulic gradient:
qQAVAt HL== ∝// /∆
The proportionality factor, K, is called the “hydraulic conductivity”:
qKHL= ()∆ /
(5.1)
Equation 5.1 is known as Darcy’s law after Henry Darcy, a French engineer
(Darcy 1856).
Darcy’s law was developed for saturated ow through sand lters; however, it
is applied to both saturated and unsaturated ow. In either application, it has limi-
tations. Darcy’s law applies only to laminar ow; therefore, it may not accurately
describe high-velocity ow in gravel or other coarse material. At low gradients in
ne materials (e.g., clay), Darcy’s law may appear to fail. Darcy’s law is applicable
mainly to relatively homogeneous and stable systems of intermediate scale and pore
size. It has proved highly useful in many estimates of both saturated and unsaturated
ow in soils. However, it is now widely employed far beyond the use for which it was
© 2009 by Taylor & Francis Group, LLC
Basic Technology 59
developed. In spite of these limitations, it is still the best unifying theory available
for water ow in soils and generally produces reliable estimates.
The currently used equations for water ow in unsaturated soil are based on
Darcy’s law and the assumption that soils are similar to a bundle of capillary tubes.
Given these assumptions, water ow can be approximated by the Hagen–Poiseuille
equation (Marshall et al. 1996). Although it is obvious that the pore space in soil is
not the same as a bundle of capillary tubes, the assumed concept has proved highly
useful and is currently used in mathematical descriptions of water ow in soil.
Figure 5.5 illustrates the relationship between soil water content and hydraulic
conductivity for the same soils illustrated in Figure 5.4 and shown in Table 5.3. The
hydraulic conductivity relationships differ greatly between soils; they depend on
particle-size distribution, soil structure, and on other factors. Figure 5.5 and Table 5.3
present calculated values of hydraulic conductivity for two soils of differing texture.
The hydraulic conductivity of saturated soils is constant; however, in unsaturated
soils, it varies over several orders of magnitude as soil water content changes. The
shapes of the curves differ between the wetting and drying cycle of soils in the eld;
the difference is called hysteresis. Hysteresis is not illustrated in Figures 5.4 and 5.5.
5.1.4 So I l Wa t e r mo v e m e n t
The illustrative data in Figure 5.5 reveals the mechanism that allows the ET landll
cover to control water within the cover soil. The soil water content in the wetted soil
layers drains to the eld capacity quickly when rainfall ends because of the high
values of K for saturated and near-saturated soils (Figure 5.5). At eld capacity, the
sandy loam and clay loam soils depicted have hydraulic conductivities (K) of 0.004
and 0.06 cm/day, respectively. The gravitational force tends to move the water down-
ward, but the possible rate of water movement downward in the soil is very small for
small values of K. The K value decreases rapidly in response to small additional soil
drying (Figure 5.5).
Examination of Table 5.3 and Figure 5.5 reveals interesting facets of soil phys-
ics. At saturation, the K value for sandy loam soil is 11 times the value for clay
0.000001
0.0001
0.01
1.0
100.0
Soil Water, v/v
cm/day
WP
WP
FC
Clay Loam
Sandy Loam
Sat
Sat
0.0 0.1 0.2 0.30.4 0.5
FC
FIGURE 5.5 Hydraulic conductivity as a function of water content for two soils, showing
wilting point (WP), eld capacity (FC), and saturation (Sat).
© 2009 by Taylor & Francis Group, LLC
60 Evapotranspiration Covers for Landfills and Waste Sites
loam; however, at eld capacity, the relationship reverses: the K value for clay loam
is 15 times greater than for sandy loam (Table 5.3 and Figure 5.5). The differences
between the two soils are more pronounced at lower water contents. The K value for
either soil at eld capacity is small and decreases by several orders of magnitude as
soil water content approaches the wilting point.
Theoretically, and as measured in the eld, soil water never stops moving (Hillel
1998). In eld or laboratory experiments, investigators measuring water movement
for long times prevent evaporation from the soil surface. However, surface drying
begins soon after rainfall ends on an ET landll cover, and even a small amount of
soil drying at the surface can reverse the hydraulic gradient and may effectively stop
drainage from the soil prole. Therefore, for practical purposes water is held in sus-
pension within the soil in less than 2 days after rainfall ends for most soils.
During landll cover design, hydraulic conductivity relationships may be needed
to model water ow in the nished landll cover soil. The landll cover soil is
likely to be a mixture of several layers of soil and will be disturbed during place-
ment in the cover; thus, its hydraulic properties should be estimated or measured on a
disturbed and mixed soil sample. Appropriate methods for measuring soil properties
are readily available in methods published by the SSSA (Dane and Topp 2002).
Cost constraints or other factors may make it necessary to estimate the hydrau-
lic conductivity relationship rather than measure it. Several authors have developed
methods for estimating the hydraulic conductivity functions from simpler and more
easily measured soil parameters. For example, Savabi (2001) employed methods
described by 12 different authors to estimate hydraulic conductivity in his model
evaluation of the hydrology of a region in Florida. Van Genuchten et al. (1991),
Zhang and van Genuchten (1994), and Othmer et al. (1991) each developed computer
code to estimate hydraulic functions for unsaturated soils. The revised Hydraulic
Properties Calculator is easy to use (Saxton 2005; Saxton and Rawls 2005).
5.1.4.1
Water Movement to Plant Roots
The ET landll cover should quickly remove stored water from all the soil mass in
the cover after precipitation. That requires a large, dense mass of plant roots.
The movement of water from soil to plant roots is a critical part of the ET landll
cover performance. When the soil is wet near a plant root, water moves rapidly to
the root because the soil hydraulic conductivity is high. The plant consumes the soil
water closest to the plant root rst, thus drying the soil near the root. As the soil near
the root dries, the rate of water movement to the root decreases rapidly because of the
reduction in hydraulic conductivity of the soil near the root. As a result, a single plant
root can effectively dry only a small volume of soil. Where soil conditions are good
for root growth, plants can produce a large mass of roots that explore all the wet soil
quick enough to maintain a high water extraction rate.
When the soil mass dries, and the plants are in water stress, many or perhaps
most of the small feeder roots that extract soil water die. When the soil is again wet-
ted, new roots must replace those that died. Within a particular soil mass, roots may
grow and die more than once per season. As a result, it is necessary to provide soil
physical conditions that allow rapid and prolic plant root growth.
© 2009 by Taylor & Francis Group, LLC
Basic Technology 61
Soils with high density often contain cracks. It is normal for roots to grow in the
cracks, but the high soil density between the cracks limits or prevents root growth
into the soil blocks between cracks. The roots within the soil cracks can extract soil
water from the surface of the dense blocks between cracks. As a result, plants can
extract some water from dense cracked soils, but they cannot effectively remove
water from most of the soil mass.
5.1.4.2 Preferential Flow
The SSSA (1997) denes preferential ow as “the process whereby free water and
its constituents move by preferred pathways through a porous medium.” However, a
group of Swiss research workers stated, “[I]t is fascinating how the expression ‘pref-
erential ow’ has been adopted by various scientic communities without having
been properly dened” (Fluhler et al. 2001). Two national symposiums on preferen-
tial ow examine numerous concepts pertaining to the topic in 95 papers published
by the American Society of Agricultural Engineers (ASAE) in 1991 and 2001. At
this time, there is consensus on a few, but not all, factors related to preferential ow
and no adequately tested models with which to predict its effect on water move-
ment during engineering design. Fluhler et al. (2001) explain that preferential ow
depends on the saturation of the soil.
Preferential ow can occur through soil cracks, wormholes, macropores in the
soil, root networks, burrows, and other large openings. However, preferential ow is
possible only if the water in the large pores exists at atmospheric or greater pressure.
In most instances, this requires that two conditions be true: (1) a large opening in the
soil extends to the soil surface, for example, a crack in a clay soil; and (2) water is
ponded over the opening on the surface.
Preferential ow of water through soil cracks, wormholes, or animal burrows
may offer a means for precipitation to move deep into the soil and bypass the active
root system. However, this requires that water be ponded above an opening to a
preferential ow pathway. On landll covers, the land surface is smooth, thus allow-
ing little water to pond on the surface. Animals and worms commonly block the
ow of water from the surface into their holes. Gee and Ward (1997) reported the
results of irrigated lysimeter tests of landll covers performed at an Animal Intru-
sion Lysimeter Facility; they stated that “the presence of small-mammal burrows
does not appear to have a signicant inuence on the deep percolation of water
through the barrier.” Under grass, growing on soil built with adequate density for an
ET cover, soil cracks are closely spaced and small; they close rapidly in the surface
soil during rain. There is limited opportunity for water to enter cracks in the soil on
an ET landll cover.
Preferential ow is cited as a mechanism for failure of vegetative landll covers.
Although the concept has theoretical merit, eld observations indicate that it has
little or no impact on performance of ET covers with properly constructed covers.
In each of the long
-term tests cited in Section 4.3, the following conditions were
present: cracking soils, wormholes, ant tunnels, and both large and small animal
burrows. The soil contained preferential ow paths for hundreds of years. However,
in each case, these preferential ow pathways produced no apparent effect on water
© 2009 by Taylor & Francis Group, LLC
62 Evapotranspiration Covers for Landfills and Waste Sites
movement through the soil prole (Cole and Mathews 1939; Luken 1962; Aronovici
1971; Halvorson and Black 1974; Worcester et al. 1975; Doering and Sandoval 1976;
Ferguson and Bateridge 1982; Sala et al. 1992).
Preferential ow is unlikely to contribute signicantly to water ow in an ET
landll cover for the following reasons:
The soil placement and cover construction process thoroughly disrupts con-•
tinuous pathways through the soil, for example, ancient root networks and
wormholes.
Landll covers have a continuous slope of 2% or greater and allow no ponds •
on the surface.
Burrowing animals protect their burrow from surface runoff by a diversion •
dam or mound; in addition, their presence is discouraged on landll covers.
Measurements and historical evidence presented in Chapter 4 demonstrated •
that in spite of known pathways for preferential ow, water did not penetrate
below the root zone of native grasses.
5.1.5 So I l ch e m I c a l Pr o P e r t I e S
All plants need an adequate amount of nutrients. Rapid water use by plants is essen-
tial for successful use of the ET landll cover. Rapid water use by plants requires
robust plant growth, which in turn requires sufcient soil nutrient supply and sat-
isfactory soil pH. Plant growth, and thus water use, may be reduced by inadequate
amounts of only one plant nutrient. The water use by plants can be no greater than
allowed by the most limiting plant nutrient found in the soil.
The soil nutrient store and the plant-available nutrients should be adequate to
support robust plant growth via nutrient cycling, both immediately and for decades
into the future. Because it is likely that maintenance of the cover will have low pri-
ority in the future, the soil should contain an ample store of nutrients and have the
capacity to capture and release to plants, nutrients recycled from decaying vegetation
on the cover.
5.1.5.1 Soil pH
Soil pH is the pH of a solution in equilibrium with soil under dened conditions.
Low soil pH receives great attention because it is widespread in arable soils and, for
many conditions, it is practical to correct low soil pH. Soils with excessively high pH
are difcult or impossible to remediate. “Soil pH is probably the single most infor-
mative measurement that can be made to determine soil characteristics” (Thomas
1996). He describes soil pH and its standard measurement.
Plants grow best in soils with neutral pH in the range of 6–7.5. For example,
nitrogen is readily available at soil pH 5.8 and greater, whereas availability of phos-
phorus may be limited for pH below 6.2 or greater than 8.5. Merva (1995) more
fully explains the relationship between soil pH and availability of several nutrients
to growing plants.
Thomas (1996) presents useful values for soil pH. Soils with pH greater than 7.6
normally contain adequate to abundant calcium; however, pH below 5.5–6.0 indicates
© 2009 by Taylor & Francis Group, LLC
Basic Technology 63
possible need for lime addition. Soil pH values of 2 or 3 indicate free acid in the soil
and may result in excessive cost to remediate them; plants will not grow in these soils
without amendment. At pH values below 5.5, toxic amounts of aluminum may be
present in the soil. Soils with pH values of 7.6–8.3 are probably calcareous; adapted
plants grow in them but other plants may suffer zinc and iron deciencies. Where pH
is 8.3 or higher, the soil solution may contain excess sodium, and at pH above 9, the
soil probably contains excess sodium, which disperses both clay and organic matter
resulting in “black alkali soils.” Few, if any, plants grow in these soils.
5.1.5.2 Soil Nutrients
Soil nutrients are the elements essential as raw materials for plant growth and devel-
opment. The nutrient used in the largest amount in plant growth is nitrogen, followed
by phosphorus and potassium. Sulfur, magnesium, and calcium are required plant
nutrients, but in smaller amounts. Important trace elements include iron, manganese,
boron, chlorine, iodine, zinc, copper, and molybdenum (Sauchelli 1969).
If the native soils at the landll site contain adequate nutrients for good plant
growth, it is likely that they will hold and provide adequate nutrients for plants grow-
ing on an ET cover with minimal maintenance. Fertilization of soils decient in
nitrogen, phosphorus, or potassium nutrient supply is usually successful and rela-
tively inexpensive.
The mere presence, as indicated by laboratory measurements, of large amounts
of essential plant nutrients in soil does not assure robust plant growth. Soils of the
western United States containing excess calcium may also contain large amounts of
phosphorus, which may be relatively unavailable to plants because, in these soils, it
may form compounds that are relatively insoluble.
Iron is a trace element for plant growth; however, it offers an important example
of nutrient availability. Iron is an abundant element in primary and secondary min-
erals found in most soils. However, iron may be relatively unavailable to plants in
alkaline or calcareous soils, where it may have low solubility. Conversely, soils with
low pH may contain sufcient iron in solution to be toxic to plant growth (Loeppert
and Inskeep 1996).
Water percolating below the plant rooting depth may leach nutrients from the
soil prole, and soils with low pH tend to suffer the greatest leaching losses. As a
result, soils available for use in building ET covers may be decient in plant nutrients
in regions where annual precipitation is high. For example, permeable acid soils of
the eastern United States may have experienced signicant natural leaching and thus
contain an inadequate nutrient supply. Potassium may be decient in leached soils,
particularly those that are acidic. Leached soils may need chemical amendment to
satisfy plant nutrient needs.
5.1.5.3
Cation Exchange Capacity
The cation exchange capacity (CEC) of a soil is an important measure of its capac-
ity to hold and exchange nutrients with the soil solution. Cation exchange sites are
located on the edges of ne soil materials, primarily clay and soil organic matter.
The clay content dominates the CEC properties of most soils because soil organic
© 2009 by Taylor & Francis Group, LLC
64 Evapotranspiration Covers for Landfills and Waste Sites
matter is less than 5% of the soil mass for most soils and is rarely higher than 3 or
4%. High values of CEC are preferred for soils used in ET landll covers to provide
an ample store of plant nutrients.
The CEC of soil is the sum of exchangeable bases plus total soil acidity at a
specic pH (usually 7 or 8). CEC values are expressed in centimoles of charge per
kilogram of exchanger (cmol/kg); however, older literature may use the numerically
equivalent milliequivalents per gram (meq/g; SSSA 1997). Standard methods are
available for its measurement (Sumner and Miller 1996).
The total number of exchange sites is large even for soils with low CEC capacity;
however, only a fraction of the sites actively exchange ions for plant use at any time.
As a practical result, productive soils are those with large values of CEC.
Clay minerals differ greatly in their typical CEC values, ranging from 3–15 for
kaolinite to 80–150 cmol/kg (meq/g) for smectite (montmorillonite) (Grim 1968).
The clay fraction of most soils is a mixture of clay minerals; thus, the CEC of the
clay usually lies between these limits. Because clay is a fraction of the typical soil
mass, the CEC values of soils are typically much less than for clay minerals alone.
Mathers et al. (1963) measured soil properties for seven soils of the Southern
Great Plains; their data provide an example of CEC values and its variability between
soils. Three soils located in the semiarid environment of the Texas High Plains
and adjoining “South” Plains, of West Texas provide examples of soil CEC con-
tent and its variability. The Pullman silty clay loam soil was located near Amarillo,
Texas; the Amarillo ne sandy loam soil was located near Lubbock, Texas; and the
Gomez ne sandy loam soil was located near Midland, Texas. The depth-weighted
clay content of the upper 4 ft (1.2 m) of each soil was 40, 23, and 16%, respectively,
for Pullman, Amarillo, and Gomez soils. Figure 5.6 presents the CEC for soil layers
within the Pullman soil prole and for its clay fraction to the 1.35 m (53 in.) depth.
The variability of CEC values between soil layers in natural or undisturbed soils may
be greater than shown by the measurements for Pullman soil shown in Figure
5.6.
0–13
13–23
23–46
46–71
71–96
96–135
Depth, cm
CEC, cmol/kg
200 40 60 80 100
Soil
Clay Fraction
FIGURE 5.6 Cation exchange capacity (CEC) for soil layers and the respective clay fraction
in Pullman silty clay loam soil. (Drawn from data in Mathers, A. C., Gardner, H. R., Lots-
peich, F. B., Taylor, H. M., Laase, G. R., and Daniell, R. E., Some Morphological, Physical,
Chemical and Mineralogical Properties of Seven Southern Great Plains Soils, ARS 41–85,
Agricultural Research Service, USDA, Beltsville, MD, 1963.)
© 2009 by Taylor & Francis Group, LLC
Basic Technology 65
Figure 5.7 presents depth-weighted average values in the upper 1.1 m (45 in.) of
the prole for soil clay percentage, and CEC values for the soil clay and the whole
soil for Pullman, Amarillo, and Gomez soils. The clay content was signicantly
different among these soils, resulting in differences in CEC values between them.
The kind of clay mineral present also affected the CEC values. Montmorillonite
dominated the clay mineral content of the Pullman and Amarillo soils; however, the
Gomez soil minerals included illite and kaolinite with only minor amounts of mont-
morillonite. As a result, both smaller clay content and kind of clay mineral resulted
in small values of CEC for the Gomez soil.
5.1.5.4 Soil Humus
Humus is an important component of soils; it is composed of organic compounds in
soil exclusive of undecayed organic matter. Manure, compost, and grass clippings
are organic matter, but they are not humus. Many years or decades may be required
to create humus in soil. Humus decays slowly; it provides signicant additional CEC,
and improves soil structure. The organic matter of naturally formed and undisturbed
soils is primarily humus.
A common misconception is that a large amount of humus is necessary for good
plant growth; this is seldom true. Plants can grow well in fertile soils that contain
little humus, such as soils of the southern Great Plains and the 11 western states
where soil organic matter content is commonly less than 2% of the soil mass. The
dark soils found in cold moist regions, such as the Corn Belt, the northeastern states,
and Canada typically contain large amounts of humus; it contributes to the fertility
of these soils. Soil layers containing natural humus are valuable; they should be pre-
served and used carefully.
The addition of organic material to soil to improve its properties may improve
soil tilth and fertility, temporarily. However, it may not be worth the expense in
Pullman scl
Amarillo fsl
Gomez fsl
CEC, cmol/kg or % Clay
Clay %
200 40 60 80 100
CEC, Soil
CEC, Clay
FIGURE 5.7 Depth-weighted average clay percentage, and cation exchange capacity of
whole soil and clay fraction to the 1.1 m (45-in.) depth. (Drawn from data in Mathers, A.
C., Gardner, H. R., Lotspeich, F. B., Taylor, H. M., Laase, G. R., and Daniell, R. E., Some
Morphological, Physical, Chemical and Mineralogical Properties of Seven Southern Great
Plains Soils, ARS 41–85, Agricultural Research Service, USDA, Beltsville, MD, 1963.)
© 2009 by Taylor & Francis Group, LLC
66 Evapotranspiration Covers for Landfills and Waste Sites
a landll cover because most of the added material oxidizes and disappears in a
relatively short time, after which soil properties revert to those of the original soil
material. In most situations, little of the added organic material is converted to long-
lasting humus.
5.1.5.5 Harmful Soil Constituents
Landll cover soils should be free of harmful constituents, such as synthetic chemi-
cals, oil, and natural salts. The salts of calcium, magnesium, and sodium may occur
naturally, and can create high salinity in the soil solution. Soil salts may raise the
osmotic potential of the soil solution high enough to prevent plants from using all of
the soil water. In addition to its contribution to soil salinity, sodium can cause deoc-
culation of clay particles, thereby causing hard soil crusts as well as poor soil tilth,
structure, and aeration. Stewart and Nielsen (1990) discuss soil salinity and sodicity
in detail.
5.1.6 So I l Pr o P e r t I e S a n d ro o t gr o W t h
Successful ET covers employ robust plant growth, and rapid, complete removal of soil
water from the soil cover. In order to meet this requirement, the soil should support
fast and robust root growth to facilitate removal of stored water from the soil cover.
5.1.6.1 Soil Tilth and Other Factors
Good soil tilth is a requirement for robust root growth. Soil tilth is “[t]he physical
condition of soil as related to its ease of tillage, tness as a seedbed, and its imped-
ance to seedling emergence and root penetration” (SSSA 1997). Several factors
affect soil tilth, including particle-size distribution, water content, aggregation, soil
chemistry, and bulk density. There are no useful direct measures of soil tilth; how-
ever, the effect of tilth on root and shoot growth as it may affect ET cover perfor-
mance may be evaluated by other measurements. Soil strength and bulk density are
closely related to tilth and they control quality of soil in an ET landll cover; they
are discussed in separate topics below.
Aggregation is the process that binds primary soil particles (sand, silt, and clay)
together, usually by natural forces and substances derived from root exudates and
microbial activity. Aggregation of soil particles is important; however, it is a com-
plex property. Most soils with little or no aggregation are similar to concrete and
allow minimum root growth. Repeated wheel trafc or excessive tillage destroys soil
aggregates. Once destroyed, it is difcult to create new soil aggregates. Provisions
for low soil strength and density, as discussed in the following text, promote adequate
soil aggregation in a nished ET cover soil.
The size and distribution of soil particles tend to control the size and distribution
of soil pores. Sandy soils naturally tend to have larger pores in which plant roots can
grow; they usually have good aeration, but low water-holding capacity. Clay soils
tend to have smaller pores; however, aggregated soils with high clay content provide
© 2009 by Taylor & Francis Group, LLC
Basic Technology 67
excellent soil material for an ET landll cover. Loam soils often provide superior
material for ET landll covers.
Oxygen is required in the root respiration process, and it must be available to
roots from the soil air. Soil physical properties, and particularly bulk density, affect
oxygen and soil air movement and availability to roots. Low or high soil pH can limit
or stop root growth. Ammonia generated by large amounts of fresh plant or animal
biomass incorporated into the soil can temporarily stop root growth. Saline condi-
tions caused by high concentrations of fertilizer in bands or layers can also limit or
stop root growth.
The lm Cotton Root Growth available from the American Society of Agron-
omy graphically illustrates several soil conditions that are unfavorable to plant root
growth (referenced in Appendix A).
5.1.6.2 Soil Strength and Density
Soil strength is related to tilth. One of the major potential obstacles to robust root
growth is high soil strength (Taylor et al. 1966; Taylor 1967; Rendig and Taylor 1989;
Raper and Kirby 2006). Several factors determine soil strength, including water
content, bulk density, particle-size distribution, and possibly others (Jones 1983).
Fortunately, where soil density is controlled within a desirable range, soil strength is
normally adequate for good root growth. Soils with optimum soil density for plant
growth usually have adequate tilth.
5.1.6.3 Soil Density
Soil bulk density is the mass of dry soil per unit bulk volume (Hillel 1998); the units
for bulk density are Mg/m
3
or gm/cm
3
. It is easy to measure and relatively easy to
control soil density during ET landll cover construction. Soil bulk density greater
than 1.5 Mg/m
3
reduces root growth; values above 1.7 Mg/m
3
may effectively pre-
vent root growth (Monteith and Banath 1965; Taylor et al. 1966; Eavis 1972; Jones
1983; Gameda et al. 1985; Timlin et al. 1998). Grossman et al. (1992) summarized
18 laboratory studies and found that root growth was only one-fth of optimum for
soil bulk density greater than 1.45 Mg/m
3
except for three soils in which root growth
was restricted at soil bulk density of 1.3 Mg/m
3
.
Particle-size distribution in the soil combines with soil density to control root
growth. Roots grow in some sandy soils with elevated density, but their low water-
holding capacity discourages their use in ET landll covers. Jones (1983) demon-
strated that plant root growth is reduced (1) at soil bulk density greater than 1.5 Mg/m
3
for most soils and (2) to less than 0.2 optimum root growth for all soils containing
less than 70% sand and having bulk density greater than 1.6 Mg/m
3
.
Sharpley and Williams (1990) used the work of Jones (1983) to develop func-
tions relating soil sand content, bulk density, and plant root growth, and they used
them in the successful EPIC computer model. The solid lines in Figure 5.8 show the
functional relationship between soil sand content and bulk density developed for use
in the EPIC model. The success of the EPIC model suggests that this approach is a
realistic way to estimate the effect of soil strength on plant root growth.
© 2009 by Taylor & Francis Group, LLC
68 Evapotranspiration Covers for Landfills and Waste Sites
In addition to inhibiting root growth, high values of soil bulk density result in low
soil water-holding capacity because pore space is limited in dense soils. Soil com-
paction and the resulting high soil density destroy the large soil pores, which results
in reduced water-holding capacity and limited oxygen movement through wet soil.
Oxygen diffusion to roots in high-density soils may be so low that roots cannot sur-
vive, particularly when the soil is wet and many pores are lled with water. Wetting
a dense soil reduces its strength substantially, thus potentially favoring root growth;
however, wetting the dense soil may reduce oxygen diffusion rates low enough to kill
roots. The effect of high soil density is more severe for a ne- than a coarse-textured
soil because the soil pores in a compacted, ne-textured soil are smaller.
Fine-textured soils contain large amounts of clay and silt and have high water-
holding capacity. When soil density is properly controlled, these ne-textured soils
retain an adequate volume of large soil pores and produce good ET landll cover
soil.
Soil bulk density should be controlled during ET landll cover construction to
optimize soil properties for root growth. Soil densities between 1.1 and 1.5 Mg/m
3
ensure robust root growth in most soils.
5.1.7 So I l mo d I f I c a t I o n
Within limits, soil may be modied to improve ET cover performance. Modica-
tion may include tillage, addition of nutrients as fertilizer, or pH modication with
limestone. It is easy to amend some chemical properties of soils, for example, low
pH, or deciencies of nitrogen, phosphorus, or potassium. Other chemical properties
may be more costly or impractical to amend. Physical soil properties are difcult or
impractical to amend after severe damage. Therefore, it is better to select soils with
desirable properties and handle them properly to maintain them in good condition
for plant growth when used in an ET landll cover.
1.0
1.5
2.0
Sand, Percent
Bulk Density
Root Growth Zero
Optimum
Restricted
200406080 100
FIGURE 5.8 Limits for plant root growth imposed by soil bulk density and sand content.
(Drawn from data in Jones, C. A., Soil Sci. Soc. Am. J., 47, 1208–1211 1983; and Sharpley,
A. N. and Williams, J. R., Eds., EPIC—Erosion/Productivity Impact Calculator: 1. Model
Documentation, USDA, Washington, DC, 1990.)
© 2009 by Taylor & Francis Group, LLC
Basic Technology 69
5.1.7.1 Natural Changes of Physical Properties
Freezing and thawing increases saturated hydraulic conductivity of soil; therefore,
it is natural to assume that freezing and thawing can correct soil structure problems
created by excessive compaction. However, Sharratt et al. (1998) present evidence
that adverse effects of soil compaction by steel wheels was not remediated by a cen-
tury of freezing and thawing under native grass cover in Minnesota. They cite other
short- and long-term research that demonstrated similar long-lasting adverse effects
of high soil density on plant growth.
Raper and Kirby (2006) discussed natural alleviation of compaction. They point
out that freezing and thawing of soil does not produce long-lasting alleviation of high
soil density resulting from vehicle compaction because the soil quickly returns to its
original compacted condition. They provide evidence that soil compaction resulting
in increased soil density below 40 cm is particularly resistant to change by natural
processes. They state that subsoiling, when correctly carried out, can remediate most
compacted soils; but if it is incorrectly applied, it may cause additional damage to
the soil.
5.1.7.2 Chemical and Physical Modification
Agricultural interests have successfully amended existing soil chemical and physical
properties; their experience demonstrates the power of knowledge of soil properties.
In the agricultural setting, cost of soil amendment severely limits possible solutions
because the return to prot from sale of agricultural products is small. For practical
purposes, the cost of soil amendment is a relatively small expenditure for ET landll
covers because of the normal, large construction costs for landll covers.
Deep plowing mixes topsoil with subsoil, reduces the density of the soil in the
prole, and improves water intake rate. Soils modied by deep plowing to achieve
lower soil density, produce more plant biomass, store more plant-available water in
the soil prole than the native soil, and allow increased rooting depth and root den-
sity (Taylor 1967; Unger 1979). Moreover, plants use water quickly and efciently
from soils modied by deep plowing. The benets of deep plowing remain effective
for decades (Musick et al. 1981; Unger 1993; Allen et al. 1995); the possible life of
good soil properties should extend to centuries with good care during maintenance.
Four eld-scale soil covers built with subsoil or minespoil having poor chemi-
cal and physical properties, produced equivalent or better forage production than
undisturbed soil because they were properly modied during placement (Hauser and
Chichester 1989; Chichester and Hauser 1991). They controlled soil density to near
the optimum for plant growth, modied soil pH by addition of lime, and added fertil-
izer to supply plant nutrients. The improvement in physical and chemical properties
of both soils during placement was critical to success.
Both chemical and physical modication of soil properties may be more com-
plete during construction of a landll cover than in the examples provided above.
Therefore, modication of ET cover soils has potential for maximum effectiveness.
Control of ET cover soil properties has potential to enhance cover performance and
adds relatively little to total construction cost; it is discussed in Chapter 11.
© 2009 by Taylor & Francis Group, LLC
70 Evapotranspiration Covers for Landfills and Waste Sites
5.2 PLANTS
The performance of an ET landll cover is optimum when the only limitation to
plant growth is soil water content. Plants naturally consume water and nutrients rap-
idly when they are available and growing conditions are good. Healthy plants dry the
soil cover and minimize percolation through the cover.
Aboveground biomass in the ET cover is an indicator of the effective use of
water from the soil because biomass production and plant water use are linearly
related for most situations. For example, Figure 5.9 shows the relation between yield
of grain sorghum and ET by the crop (Stewart et al. 1983).
Several factors may limit plant growth, including soil properties, incorrect spe-
cies selection, soil and air temperature, humidity, disease, and insect attack. More
than one limitation may be in effect at any given time, and there may be interactions
among limiting factors.
5.2.1 Pl a n t Se l e c t I o n
ET landll covers should include a diverse mixture of grass species that are native to
the site. Native plant mixtures evolved under the conditions of the site and, therefore,
they are predisposed to survive there and successfully perform as desired. During
any particular year, one or more species may encounter less than optimum condi-
tions for growth. However, as natural systems “abhor a vacuum,” other species in a
native grass mixture thrive and dry the soil prole. Native grass mixtures are par-
ticularly well adapted to rapid regrowth after re or drought.
Grass cover is preferred because it provides optimum erosion control and an
extensive brous root system. However, woody plants are appropriate at some sites.
Perennial species are preferred at most locations, although annuals should be used
where they are the predominant native species; for example, in central and southern
California, annual grasses dominate the native grasslands. The growing season of
individual species within a native grass mixture often differ, and may extend the
season for active soil water use from the cover soil beyond that for a single species.
0
2
4
6
8
10
2000 400 600 800
ET, mm
Yield, Mg/ha
FIGURE 5.9 Relation between the yield of grain sorghum and plant water use under lim-
ited irrigation or dryland production. (Drawn from data in Stewart, B. A., Musick, J. T., and
Dusek, D. A., Agron. J., 75, 629–634, 1983.)
© 2009 by Taylor & Francis Group, LLC
Basic Technology 71
Native species evolved at the site; as a result, they are hardy and persistent. They
utilize resources efciently and produce near the maximum possible biomass and
water use that is possible under the conditions at the site. Native plants developed
under both favorable and unfavorable conditions at the site, yet they survived for
centuries. They survived extended drought, insect attack, disease, periodic re, and
other adverse factors.
Many introduced species threaten existing ecosystems; some are ofcial noxious
weeds. Some introduced species will displace native species and form a monoculture;
such a cover is vulnerable to unexpected insect or disease attack (Schuman et al.
1982). Introduced plants may have been hardy in the place where they developed;
however, there is often no proof that they will be equally hardy at a different site.
Introduced species may be highly susceptible to disease or an insect found occasion-
ally at the site. Introduced species may invade the site.
A mixture of native species will provide protection during periods when nat-
ural factors cause individual species to grow poorly. The mixture should include
several grasses and forbs. Although seeds of cultivated plants have short lives in
the soil, native plant seeds remain viable in the soil for many years and, if present,
provide a source for natural landll cover renewal. Native grasses and forbs will
create a seed bank in the soil if the plants in the cover produce mature seeds during
each year.
The seeds of native grasses and forbs may be difcult to get because they are
difcult to grow and harvest. There are, for almost all locations in the United States,
selections derived from native plants that will be available and are often highly sat-
isfactory. Native grasses perform best if they have a few native forbs in the planting.
Some of the broad-leaf forbs are legumes, and if inoculated, will supply needed
nitrogen to the grasses. The forbs, although small in total number and total biomass,
make a major contribution to the health and natural renewal of the grass cover. Seeds
of forbs are often difcult to get, but planting even one legume species will substan-
tially improve the probability for success. Native grasses and forbs not planted may
invade the site after establishment and add species diversity.
5.2.2 So d a n d bu n c h gr a S S e S
Sod-forming grasses produce dense ground cover and leave little bare ground; they
may be established from seed or vegetatively. Individual plants spread by lateral
creeping stems or rhizomes to establish new plants in the space between plants. The
creeping stems grow laterally from the plant near the ground. The rhizomes grow
under the soil surface and appear to be part of the root system. New plants form
along the lateral stems and rhizomes and produce a dense interconnected cover of
grass. A dominant characteristic of sod grasses as compared to bunch grasses is the
density and completeness of ground cover achieved by sod-forming grasses. Sod-
forming grasses provide excellent soil erosion control and can withstand concen-
trated water ow to depths of 2–3 ft (60–90 cm) on steep slopes. Figure 5.10 shows
Bermuda grass, an introduced sod-forming grass, that is now widely distributed in
warm climates.
© 2009 by Taylor & Francis Group, LLC
72 Evapotranspiration Covers for Landfills and Waste Sites
Bunch grasses grow as individual plants, and they spread by germination of
seeds to establish new plants. Some of them spread vegetatively; in that case, the
crown of the bunch grass produces a ring of new plant material on the outer edge
of the crown, thus increasing the size of the bunch. Where water supply is limited,
the grass plants (bunches) are widely separated, leaving bare ground between them.
The roots, however, spread laterally and utilize all the soil water between plants. At
arid sites, bunch grasses provide adequate water erosion control if plant litter and
stems cover the ground between bunches. Following re, erosion control by bunch
grasses is reduced until new growth emerges. In humid regions, bunch grasses usu-
ally grow so close together that they overlap and provide excellent water and wind
erosion control. Figure 5.11 compares bunch grasses in an arid climate with those
growing in a humid climate.
A good mixture of grasses may include both bunch and sod-forming grasses
because a primary goal for the vegetation is the most complete ground cover pos-
sible. The selection of species should follow as closely as possible the native plant
distribution at the site.
5.2.3 tr e e S a n d Sh r u b S
Trees and shrubs can effectively remove soil water from the cover soil. Shrubs and
trees are native vegetation in some areas; however, even in these areas, native grasses
are suitable for an ET cover. A properly constructed ET cover soil will provide excel-
lent conditions for grass production in any area.
The claim is sometimes made that trees use more water than grass. Several fac-
tors that control plant water use from the soil are similar between grass and trees:
Source of energy to evaporate water is the sun.•
Stomata in the leaves controls water ow through most plants.•
Stomata control the evaporation of water from the leaves of most plants to •
maintain optimum leaf temperature (Wanjura et al. 1992; Evett et al. 1996).
FIGURE 5.10 Bermuda grass, a low-growing, sod-forming grass. (Photo courtesy of USDA
Natural Resources Conservation Service.)
© 2009 by Taylor & Francis Group, LLC
Basic Technology 73
It is unlikely that trees planted in a forest will consume signicantly more water than
grasses unless they provide green growing vegetation for a longer time during the year.
There is one notable exception: large trees growing in isolation may use more water
than grass on an ET landll cover when winds provide signicant advective energy.
Some shrubs and trees produce allelopathic materials that suppress plant growth
under and near the tree. The soil under trees and shrubs may be bare because of water
consumption and interception of light by the tree. In either case, bare soil or sparse
ground cover under and around trees and shrubs may create a soil erosion hazard.
The rooting depth of plants may be important for ET cover applications. Even
though some trees and shrubs have taproots that may penetrate deeply, their primary
root activity is in the same upper soil layers occupied by grass roots.
5.2.4 Se l e c t I n g na t I v e Pl a n t SP e c I e S
Local agricultural extension agents employed by the USDA or a state, are excellent
sources of information regarding plants native to the site. The yearbook of agricul-
ture entitled Grass (USDA 1948) is an excellent source of information about grass
plants for each region of the United States.
A recent reference including both native and introduced grasses is the USDA
book on grass varieties (Alderson and Sharp 1994). The USDA Plant Database
(USDA-NRCS 2006) provides useful descriptions of plant species. They also cre-
ated a Web site that is useful in planning an individual site called Vegetative Practice
Design Application (VegSpec 2006).
FIGURE 5.11 Bunch grasses growing in an arid climate (left); and in a humid climate
(right). (Photo courtesy of USDA Natural Resources Conservation Service.)
© 2009 by Taylor & Francis Group, LLC
74 Evapotranspiration Covers for Landfills and Waste Sites
State highway departments maintain recommendations for plant cover on right-of-
way property. State highway departments select plants for right-of-way for their ability
to survive on thin, infertile soils and under harsh environments. Although these recom-
mendations are good for roadway embankments and right-of-way, they are unlikely to
match the needs of plants growing on an ET landll cover. Plants selected from USDA
recommendations should perform much better on ET landll covers.
Almost all plants experience a dormant season when they use little water. Some
or all of the plants selected for the cover should actively grow and use water during
the season with greatest precipitation. Native plant species usually grow during the
season of greatest precipitation. Cool- and warm-season native grasses may suc-
cessfully grow together at many sites. The combination of cool- and warm-season
grasses substantially increases the length of the growing season and the soil-drying
action of the grass cover.
5.3 PLANT ROOTS
ET landll covers are highly dependent on the action of plant roots, so it is necessary
to understand the role of roots in the system and their requirements because plant
roots control water removal from the soil; they control success. Several factors affect
water removal from soil by plant roots, and roots serve many complex functions
(Rendig and Taylor 1989; Klepper 1990), including the following:
Roots provide the plant with water and nutrients absorbed simultaneously •
from deep and shallow soil layers, from moist and partially dry soil, and
from soil zones of different biological, chemical, and physical properties.
Roots provide anchorage for the plant.•
Fleshy roots store nutrients.•
Some plants develop adventitious shoots after damage to the main root.•
Roots and shoots (aboveground plant parts) are interdependent. Shoots are the source
of organic metabolites used in growth and maintenance, and roots are the source of
inorganic nutrients and water. Pruning, clipping, or mowing the top of a plant reduces
root mass.
Plants remove water, nutrients, and oxygen from the soil via the plant root sys-
tem. Plant feeder roots (the smallest roots) extract the water, plant nutrients, and
oxygen from the soil and the soil atmosphere. When soil layers dry, plants become
stressed, the mass of aboveground shoots may be reduced, and roots may die. When
conditions for robust plant growth return, it is necessary for the plant to replace dead
roots quickly; that requires a favorable soil environment.
In order for the ET cover to be effective, the plants should maintain the soil in
the driest possible condition at all times, resulting in signicant loss of plant root
mass, several times during each season. After rainfall, it is important that the plants
produce new roots in the wet soil as quickly as possible. Native plants naturally tend
to grow new roots rapidly because through competitive selection during the evolu-
tionary process, only those plants capable of rapid root and shoot growth survived
to become part of what we dene as “native plants.” It is possible, with little or no
© 2009 by Taylor & Francis Group, LLC
Basic Technology 75
additional construction expense, to produce ET cover soils with few restrictions to
root growth, thus allowing optimum plant performance.
Roots grow rapidly if soil conditions are favorable; this requires that the soil have
low soil strength, adequate fertility, and that the soil atmosphere contain adequate
levels of oxygen. Low soil strength requires low bulk density. As stated earlier, low
soil density is vital to success, affects other soil conditions, and is easy to control
during ET cover construction and maintenance activities.
5.3.1 ro o t dI S t r I b u t I o n W I t h I n t h e So I l
The distribution and density of living plant roots in soil controls the drying of each
soil layer. Figure 5.12 illustrates general root distribution patterns that are possible
during a growing season for a soil with good tilth. When all layers are adequately
wetted, roots often develop as shown for condition 1 early in the growing season; the
majority of the roots are near the surface in the upper 15–30 cm. Plants extract water
and nutrients in greatest quantity from the uppermost soil layers when they are wet;
as a result, the natural rooting pattern dries the upper layers rst. After surface soils
dry, the root distribution, water, and nutrient extraction may shift to a pattern similar
to condition 2. After a signicant period of drought, when most of the extractable
water is deeper in the soil or at the end of the growing season, most of the active
roots will be deep in the soil prole (condition 3). As the soil dries during condition
2 or 3, soil water is held at greater negative pressure by the soil; as a result, plants
may wilt during part or all of the day, and both water used and active growth rate
may be reduced.
Parts of the root system, particularly small feeder roots, die in response to soil
drying or other stresses in a particular layer, whereas, at the same time, new roots
may be growing rapidly in another soil layer. Soil temperature, soil oxygen, and other
factors may limit root density and water use from a particular soil layer. The density
of living and active roots in each layer may increase and then decrease more than
once during the growing season because of changing conditions. Thus, the distribu-
tion of actively growing and functioning roots may change from upper to lower and
back to upper soil layers during one growing season in response to soil water content
Live Root Mass
0
Depth
1
2
3
FIGURE 5.12 Possible distribution of living roots at different times during the growing
season for a soil with good tilth.
© 2009 by Taylor & Francis Group, LLC