Evapotranspiration covers for landfills and waste sites - Chapter 8 potx
Bạn đang xem bản rút gọn của tài liệu. Xem và tải ngay bản đầy đủ của tài liệu tại đây (248.47 KB, 13 trang )
99
8
ET Landfill Cover
Design Steps
The design of evapotranspiration (ET) landll covers ts within the framework
normally used for landll remediation. This chapter includes design informa-
tion that is specic to ET covers.
Each landll cover should satisfy site requirements to protect public health and
the environment over many decades or even centuries. Federal rules and regu-
lations (USEPA 1991) prescribe the important design requirements for con-
ventional landll covers, and a model is accepted for their design (Schroeder
et al. 1994a,b). As a result, the accepted conventional covers tend to be similar
to one another.
The technology that governs performance of the ET cover dictates a unique
design for each landll cover so that it can meet the requirements of the site.
Federal rules and regulations provide no guidance for alternative landll cov-
ers. Each ET landll cover is designed for its location. The four-step risk-
based/performance-based (RB/PB) process described in Chapter 2 applies to
ET landll covers and should precede the following six design steps:
1. Site characterization
2. Performance criteria
3. Cover type
4. Preliminary design
5. Site-specic design
6. Final design
Because each site is unique, these design steps may need modication or itera-
tion of the steps for a particular site.
8.1 SITE CHARACTERIZATION
Site characterization includes measurement and description of parameters that are
important to the decision process and preliminary ET landll cover design. It may
include information listed in Table 8.1 and Chapter 2, Section 2.3. Characterization
may involve two steps. The rst is the information needed for site evaluation and pre-
liminary design; it should be relatively brief and inexpensive. The second is for nal
design and requires additional measurements; it may require substantial amounts of
time and expense.
© 2009 by Taylor & Francis Group, LLC
100 Evapotranspiration Covers for Landfills and Waste Sites
The measurements of site characteristics listed in Table 8.1 should demonstrate
current or potential complete pathways between contaminants in the landll and
receptors. It is important to measure the risks added by the landll and their relation
to remediation activities. For example, landlls located above tight shale formations
or other low-permeability materials are unlikely to harm the local groundwater. At
the opposite extreme, some old landlls contain waste in contact with groundwater
and, therefore, a landll cover cannot prevent movement of contaminants to ground-
water; however, the landll may need a cover.
8.2 PERFORMANCE CRITERIA
As explained in Chapter 2, all landll covers should:
a. Control inltration of precipitation into the waste
b. Isolate the waste and prevent its movement by wind or water
c. Control landll gases
Federal regulations contain design requirements for the water ow barrier, the drain-
age layer, the thickness and function of the soil and plant cover, and other parts of
TABLE 8.1
Site Characteristics That Are Important to Evaluation and Design of an ET
Landfill Cover
Characteristic Measured Parameters
Hydrogeology Geology, permeability of strata, seismic activity, groundwater connection to waste,
native groundwater quality and use, domestic or other use of groundwater
Groundwater Depth, separation from waste, rate and direction of movement, native quality,
potential use of native groundwater, current groundwater use, and contaminants both
upgradient and downgradient from the landll
Landll liner Lined or unlined, kind of lining, thickness, permeability, and durability
Waste Kind, age, degradability, toxicity, and radioactivity
Gas production Current gas production, potential gas production, and gas quality
Climate Wet, dry, cold, hot, weather extremes, ice and snow accumulations, hurricanes and
storms, monthly average precipitation and temperature, length of growing season,
and variability of weather
Seismic risk Seismic risk for the area, geological factors affecting seismic risk to the landll, and
waste properties that affect seismic risk
Soil resource Quality of soil near site, haul distance, volume available, quality of subsoil, soil salt,
alkalinity, contamination, fertility, cation exchange capacity (CEC), pH, organic
matter content, and total salt
Plant resource Native species, annual or perennial, potential rooting depth, growing season, water use,
density of ground cover, ease of establishment, availability of seed, and ability to
control soil erosion
Site reuse Rural or urban location, value of surrounding land, and distance to national forest and
parks
© 2009 by Taylor & Francis Group, LLC
ET Landfill Cover Design Steps 101
conventional covers. As a result, criterion (a) receives little thought when designing
conventional landll covers to meet these regulations because of the presumption
that the mandated barrier is adequate.
Allowable inltration of precipitation through the cover is likely to be the most
contentious requirement for most landll covers. Because an inltration criterion is
needed for each ET landll cover, all concerned parties should agree upon inltra-
tion and other performance criteria before cover selection begins. Agreement on
cover requirements will then allow use of any cover that provides adequate remedia-
tion for the site. The ET landll cover will satisfy requirement (a) at many sites.
Performance criteria (b) and (c) are easily met by ET landll covers. Most covers
that satisfy the inltration requirement also satisfy criterion (b), that is, isolation of
waste and prevention of its movement. The exception may be in a dry climate where
an ET cover that is too thin to isolate the waste can control inltration; in that case,
it is easy to increase the thickness.
Because there is no barrier within the ET cover, it is less prone to collect gas
generated within the landll, creating less need for gas collection. It is easy to install
conventional gas extraction systems under an ET landll cover where needed, for
example, for fresh waste, the known presence of toxic gases, or where large volumes
of methane are expected. In addition, vertical gas extraction wells inserted through
a completed ET cover do not threaten cover performance.
An RB/PB evaluation of a landll is the rst step in establishment of perfor-
mance criteria and precedes the selection of a cover concept. An RB/PB evaluation
of a landll (Chapter 2, Section 2.2) utilizes the site characterization data and allows
application of the best engineering and scientic knowledge to selection of perfor-
mance criteria.
The RB/PB process includes the following steps:
Identify releases•
Assess exposure•
Assess risk•
Establish site-specic performance requirements•
Because site-specic conditions control the requirements for a landll cover, the
RB/PB process is important for selection of remediation criteria.
8.2.1 co v e r re q u I r e m e n t S
Table 8.2 contains basic requirements for success for conventional and ET covers
that meet landll cover demands. Five of the eight requirements for ET covers differ
substantially from those for conventional covers. The ET cover needs site-specic
design in the same way that other remediation efforts do.
All the factors listed in Tables 8.1 and 8.2 and others specic to the site may be
important for the performance of an ET cover; however, one or more of them may
be most important for a particular site. Therefore, site characterization and RB/PB
site evaluation are needed to identify the factors that control performance require-
ments and, thus, are important for the design of a specic ET landll cover.
© 2009 by Taylor & Francis Group, LLC
102 Evapotranspiration Covers for Landfills and Waste Sites
8.2.2 al l o W a b l e le a k a g e t h r o u g h co v e r S
A performance standard or guide is needed for criterion (a), that is, control inltra-
tion of precipitation into the waste, to assist in dening requirements for a landll
site. A reference point for allowable leakage through the cover would be helpful dur-
ing planning and design.
Recent research suggests that inltration of precipitation into landll waste may
be benecial. Hicks et al. (2002) found that increasing surface inltration into land-
ll waste by recirculation of waste liquid or by pumping groundwater could “reduce
the time required for biological stabilization of the landll waste.” The innovative
bioreactor landll requires the addition of extra water to the top of the waste to
increase the rate of waste decay (Reinhart and Townsend 1998; ITRC 2006).
The measured leakage rates for conventional landll covers presented in Chapter 3
provide a basis for estimating the allowable leakage through landll waste. The mea-
surements of leakage through conventional landll covers included sites with wide
climatic variation (see Table 3.1). Because conventional covers are widely accepted
as adequate, these measurements provide guidance for a general allowable inltration
requirement for landll covers. The measurements summarized in Table 3.1 repre-
sent expected performance of new barrier-type covers under good conditions because
the experimental sites were carefully built, and only a few years old.
Table 8.3 summarizes annual leakage at sites with more than 300 mm per year
precipitation. The conventional compacted-clay barrier covers leaked, on average,
10% of the precipitation falling on the cover. The composite-barrier cover controlled
leakage better than the other covers; but it leaked, on average, 2% of the precipitation
falling on the cover. The maximum annual average leakage through compacted soil,
compacted clay, and composite covers was 20, 25, and 7%, respectively.
It is widely accepted that barrier covers are satisfactory. One may conclude that
the currently used barrier covers perform satisfactorily in spite of signicant move-
ment of precipitation into the waste.
TABLE 8.2
Basic Requirements for Success of Conventional and ET Landfill Covers
Conventional Cover ET Landfill Cover
Controls inltration resulting from precipitation Controls inltration resulting from precipitation
Isolates waste and prevent movement Isolates waste and prevent movement
Good design/construction Good design/construction
Gas collection usually needed Gas collection if needed
Effective barrier layer Adequate precipitation storage
High soil density Low soil density
Drainage layer Robust plant cover
Barrier layer often assumed to be impermeable Requires site-specic design
© 2009 by Taylor & Francis Group, LLC
ET Landfill Cover Design Steps 103
8.2.3 a le a k a g e cr I t e r I o n
The leakage criterion for landll covers proposed in the following text is based on the
measured leakage rates for conventional-barrier landll covers shown in Table 3.1,
and summarized in Table 8.3. The performance measurements demonstrated that
conventional covers leak and that some might leak a surprising amount. In spite
of the measured leakage quoted here, the author found no evidence suggesting that
conventional-barrier landll covers fail to protect the public health and the environ-
ment. This suggests that some leakage is acceptable. Common sense suggests that
there is a limit beyond which leakage is too much; however, the author found no
guidance on how much that might be.
The following leakage criterion is proposed for municipal waste:
The average allowable annual deep percolation rate through municipal •
waste should not exceed 3% of average annual precipitation.
Where waste decay or other factors require more water, the allowable leak-•
age may be greater.
The proposed criterion is 1% more than the average leakage through composite-
barrier covers, but less than half the maximum value. It is less than one-third the
average measured for compacted-soil and compacted-clay barrier covers (Table 8.3).
The criterion is conservative, yet allows latitude in design and performance.
Average annual precipitation in the United States varies from less than 250 mm
to greater than 1500 mm per year (ASCE 1996). Table 8.4 contains typical allowable
deep percolation amounts using the proposed criterion.
8.3 COVER TYPE
After establishment of the site characteristics and performance criteria, the next step
is to select an appropriate cover type for review. The cover choices should include
TABLE 8.3
Annual Percentage of Precipitation Leaking
through Conventional Covers at Sites with
More Than 300 mm per Year Precipitation
(see also Chapter 3, Table 3.1)
Cover Type
Sites
Number
Annual Leakage
Range (%) Mean (%)
Compacted-soil barrier 3 1–20 10
Compacted-clay barrier 5 Trace–25 10
Composite barrier 9 < 0.5–7 2
© 2009 by Taylor & Francis Group, LLC
104 Evapotranspiration Covers for Landfills and Waste Sites
both conventional and alternative covers, and their characteristics should be com-
pared to site requirements. If a conventional-barrier cover best meets site require-
ments, the design process reverts to conventional methods.
If an ET cover appears appropriate for the site, the rst review for an ET cover
should be a regional evaluation using the methods explained in Chapter 7. After
selecting an ET landll cover for a site based on a regional analysis, the next step is
preliminary design to ensure that an ET cover will meet the requirements of the site
and that adequate soil resources are available.
8.4 PRELIMINARY DESIGN
A preliminary design is needed to justify expenditure of funds for a complete ET
landll cover; it should be inexpensive. Adequate preliminary design should be pos-
sible with data gathered during site characterization. The preliminary design should
evaluate alternate ET cover designs and expected future performance of the cover to
determine whether it will meet the requirements for the site.
8.4.1 de S I g n mo d e l
The model used should be exible, easy to run, and produce summary data that is
pertinent to ET cover design. It should not require calibration or adjustment of model
parameters. It should estimate water balance for each day of a 100 year period. The
model should stochastically generate future daily weather having statistical variabil-
ity similar to measured precipitation records at the site. In addition, cumulative and
extreme events should be statistically similar to measured events. It should estimate
missing soil chemical and physical parameters, and run with readily available soil
properties from standard soil surveys. The environmental policy integrated climate
(EPIC) model is suitable for both preliminary design and nal design of an ET land-
ll cover (see Chapter 9).
8.4.2 co v e r So I l Pr o P e r t I e S
Soil properties sufciently accurate and complete for preliminary design are easily
available with little or no cost for most sites. The Natural Resources Conservation
TABLE 8.4
Proposed Criterion for Allowable, Average
Annual Deep Percolation into Municipal Waste
Annual Precipitation
(mm)
Average Annual Deep Percolation
(%) (mm)
200 3 6
500 3 15
1000 3 30
1500 3 45
© 2009 by Taylor & Francis Group, LLC
ET Landfill Cover Design Steps 105
Service (NRCS) of the U.S. Department of Agriculture (USDA) has already mapped
and measured soil properties for most counties in the United States (USDA, NRCS
2006). They usually dened the soil proles downward to the top of parent mate-
rial. Soil scientists and engineers from within and outside the agency reviewed each
description for accuracy. They describe typical properties for each soil series, so the
soil at a particular site may differ slightly from the USDA description.
The data contained in the standard USDA, NRCS survey are adequate for
detailed farm planning and for use in preliminary design of ET landll covers. The
EPIC model (Sharpley and Williams 1990) and the “Hydraulic Properties Calcula-
tor” (Saxton 2005; Saxton and Rawls 2005) estimate soil properties not found in
USDA soil survey data; they are adequate for preliminary design.
8.4.3 Pl a n t co v e r
Selection of one native grass species should provide an adequate preliminary design.
At sites where tree or shrub cover may be the nal vegetation, grass data should pro-
vide an adequate preliminary design. Both trees and grass get the energy for evapo-
rating water from the sun, both evaporate water to cool the plant, and both utilize
stomata as the gas exchange mechanism. Actual ET should be similar between trees
and grass cover with full canopies. Chapter 5 contains suggestions regarding sources
for data describing plants.
8.4.4 Pr e l I m I n a r y co v e r th I c k n e S S
The purpose of estimating minimum cover thickness at this stage of planning and
design is to verify that the ET cover will satisfy site requirements when using avail-
able resources and to provide a reasonable estimate of soil volumes needed. After
this initial estimate of cover thickness, choose a cover type, collect data for nal
design, and begin the nal design, including a new estimate of cover thickness.
8.4.4.1 Sensitivity Analysis and Calibration
Some design recommendations propose use of “sensitivity analysis” to estimate
cover thickness (ITRC 2003). Sensitivity analysis is the systematic change in one or
more model parameters to determine the resulting change in a parameter of inter-
est. Model developers use sensitivity analysis to guide model revision by showing
which of several parameters within the model caused greatest effect on the desired
answer; the results of sensitivity analysis should be tested against eld measure-
ments. Sensitivity analysis is part of model calibration and testing. The estimation of
cover thickness is not “sensitivity analysis.” Model calibration or sensitivity analysis
during design is inappropriate for several reasons, including the following:
Adequate measured data is seldom, if ever, available to test the results for •
the site.
Because of model complexity, modication of some parameters within a •
model to t calibration data may produce unintended consequences and
signicant errors in model estimates for a particular site.
© 2009 by Taylor & Francis Group, LLC
106 Evapotranspiration Covers for Landfills and Waste Sites
8.4.4.2 Thickness Estimate
Simple single-equation estimates of cover thickness based on long-term averages are
unlikely to capture the effect of limits on water use by plants and on the water bal-
ance. Interactions between soil, plants, and weather produce highly variable water
use from day to day. The limitations on growth reduce plant water use below the
potential for the site on most, but not all days. Water may be used at the optimum
rate from one soil layer, but reduced or zero from other layers on any given day. Plant
water use may be limited because dry soil, soil temperature, or other factors limit
water extraction. A simple equation based on averages is inadequate for estimating
cover thickness.
Using an adequate model, perform several model runs with a range of soil thick-
ness to estimate the required soil thickness. The computer model should simulate,
as closely as possible, daily plant water use from the ET cover soil, and all terms of
the water balance for each day of a minimum 100-year period. The model should
be capable of making reasonable estimates with incomplete data, because at this
stage of design complete data are seldom available. A comprehensive model meets
the requirements. After a suitable model is set up for the rst run, it is normally fast
and easy to rerun the model to evaluate alternative designs for a particular site. The
range of soil thickness should include extremes to verify that an optimum depth was
included within the range. Choose the thinnest cover that meets the remediation
objectives for the site.
A preliminary estimate of ET landll cover thickness for a site in Oklahoma
City illustrates the process. Table 8.5 shows soil properties found in soil surveys and
those estimated by the EPIC model. The plant cover for this preliminary estimate
was a monoculture of switchgrass, a plant native to Oklahoma. The model used plant
parameters stored within the EPIC database.
TABLE 8.5
Soil Properties Available in Soil Survey Data
and Those Calculated by the EPIC Model
for Preliminary Estimates of Cover Thickness
for an ET Cover at Oklahoma City
Soil Survey Calculated by EPIC
Sand/silt content (%) 14/43 Clay content
Soil density (Mg/m
3
) 1.4 Soil porosity
pH 6.8 Layer thickness
Organic carbon (%) 0.8 Saturated hydraulic conductivity
CaCO
3
content (%) 0.4 Aluminum saturation
CEC, CMOL/kg 22 Labile phosphorus
Wilting point (v/v) 0.12 Phosphorus absorption ratio
Field capacity (v/v) 0.37 Nitrate content
Albedo 0.13 SCS curve number for each day
Hydrologic soil group D Root zone soil water content
© 2009 by Taylor & Francis Group, LLC
ET Landfill Cover Design Steps 107
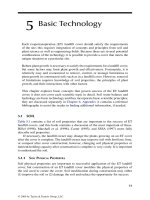
Figure 8.1 shows average annual deep percolation estimates computed from
daily estimates by the EPIC model during each day of a 100-year period at Okla-
homa City for ve different cover thicknesses. The average annual precipitation at
the site is about 810 mm. If the 3% guideline (Section 8.2.2) meets site requirements
for average annual deep percolation, then a cover producing less than 24 mm of deep
percolation is adequate. A cover that is 1.5 m thick is more than needed (Table 8.6),
if the available soil has properties similar to those used.
However, before making a nal decision regarding cover soil thickness, examine
the extreme events expected at the site. Table 8.6 contains data that are useful in
examining extreme events. A cover that is 1.5-m thick produced about 224 mm of
deep percolation during one year of a 100-year design period; however, the leakage
was greater than 100 mm in only 3 years, and zero during 74 years. The 1.5-m-thick
cover performed well. A 2-m-thick cover performed very well; it had 99 years of
zero deep percolation. A 3-m-thick cover produced no deep percolation; it is much
thicker than needed.
0
50
100
150
02
Soil ickness, m
mm
Average Annual Deep Percolation
31
FIGURE 8.1 Effect of cover thickness on the estimated average annual deep percolation at
Oklahoma City.
TABLE 8.6
Preliminary Estimates of Average Annual Deep
Percolation through a Silty Clay ET Cover
at Oklahoma City (100 Year Estimate)
Cover Thickness (m) 1.5 2.0 3.0
Average annual percolation (mm) 14.9 0.9 0.0
Greatest annual amount (mm) 224 89 0
Number of years zero or less 74 99 100
Number of years greater than 100 mm 3 0 0
© 2009 by Taylor & Francis Group, LLC
108 Evapotranspiration Covers for Landfills and Waste Sites
8.5 SITE-SPECIFIC DESIGN
Chapter 4 describes conrmation of the ET landll cover concept at 13 locations;
however, one must apply the concept at other sites where no measurements exist.
Successful ET covers utilize soils and plants combined in a system that will con-
trol precipitation under the inuence of weather at the site and meet all other cover
requirements for a particular landll. Successful use of the ET cover concept at a
particular site requires that one understands the factors that control performance of
an ET cover. This section presents examples of weather, soil, and plant variability, as
well as their integration for application at a particular site.
8.5.1 We a t h e r
Daily weather may be the most variable parameter affecting ET cover performance
estimates for a particular site. Weather variability from day to day and the magnitude
of extreme events have profound inuence on performance of landll covers.
Existing weather records are measurements of past events; it is unlikely that
future weather will repeat site historical records. The new cover should meet require-
ments for the site with unknown future weather. Current engineering design practice
assumes that the statistical properties of future climate will be similar to those of
accurate existing records. Therefore, stochastically generated daily weather param-
eters are adequate for design if the generated statistical properties match those from
measured records. The preliminary design should provide performance estimates for
each day of a 100-year period to provide information about long-term performance
of an ET landll cover. Stochastic estimates of future daily weather generated by a
tested model provide a realistic basis for design.
8.5.2 So I l S
Soil properties may vary horizontally on a scale of meters or hundreds of meters. In
addition, soil proles at any spot usually contain multiple layers, each having differ-
ent properties from the other layers.
The soils of eastern Oklahoma present an example of the differences that may
exist between soils near a landll site. The region has high rainfall, but plants requir-
ing abundant water and deep fertile soils grow poorly on some upland soils. Some
upland soils have cemented or acid layers in the prole; they may limit or restrict
root growth. Plants growing on upland soils often cannot extend an adequate number
of roots into all soil layers to remove the stored soil water; they may suffer drought
stress. Some of these soils in their native condition may appear to be poor soil mate-
rial for an ET landll cover.
River-terrace soils of eastern Oklahoma present a signicant contrast to upland
soils. Many are deep, fertile, and have near-neutral pH. The thick river-terrace soils
have desirable properties because the source of the sediments that formed them was
the fertile, neutral-to-calcareous soils of western Oklahoma, Kansas, and Texas. River-
terrace soils have few limitations to plant growth. Plants suited to the climate thrive on
© 2009 by Taylor & Francis Group, LLC
ET Landfill Cover Design Steps 109
river-terrace soils, and they remove water from deep in the soil prole. River- terrace
soils may be suitable for use in ET landll covers with little or no modication.
There are at least three ways to use the available soil resources at or near a site: (1) by
using borrow soils that naturally meet requirements, (2) by selection of appropriate lay-
ers from local soils, and (3) by modication or mixing locally available soil material.
Upland soils of eastern Oklahoma commonly contain layers of soil that would be
suitable for use in an ET landll cover. Thorough mixing of soil layers may produce
soil material that is suitable for ET landll covers. One must exclude some soil layers,
for example, acid or sandy material, from the mixture to ensure suitable cover soil.
Subsoil that meets other requirements may be satisfactory soil material (Chi-
chester and Hauser 1991). Mix suitable subsoil with fertile topsoil, if available;
amend the mixture with nutrients and lime, if needed. Properly amended mixtures
containing subsoil should be suitable for ET cover soil at many sites.
8.5.3 Pl a n t S
The denition for the ET landll cover states that the plants on the cover should be a
mixture that is native to the site. Native plants became “native” because they elimi-
nated the competition; as a result, they are well adapted to the climate, soil, plant
diseases, and insects found at the site. Plants native to a site are typically a mixture
or a community of plants. Success with the ET landll cover requires that the plant
cover grow profusely every year to remove stored soil water quickly. A mixture of
native grasses satises that requirement. In addition, grasses provide superior soil
erosion control.
It is desirable that the plant cover on an ET landll cover provide green growing
vegetation for the longest possible growing season. A mixture of native plants is an
excellent way to ensure that plants will be growing when water is available in the
soil. Because of the extreme competition among plants during development of the
modern “native” plant community, the native mixture includes plants able to grow
when the resources for plant growth are available. The resources include soil water,
energy, nutrients, and adequate air and soil temperature.
Almost all native plants have the potential to establish a robust root system deep
in the soil; indeed, most of them can root deeper than soil and climate allow. The abil-
ity of plants growing on the cover to consume the soil water stored in the bottom of
the cover depends on their ability to produce a robust root system deep in the soil.
The native grass communities of Oklahoma offer an example of widely differ-
ing plants. In eastern Oklahoma, where water supply is abundant, native plants on
deep fertile soil include tall prairie grasses and forbs; the mixture produces dense
plant mass more than 2 m tall, with roots growing an equal distance into good soil.
In the Oklahoma panhandle, where the climate is semiarid to arid, native plants on
deep fertile soil include short grasses and associated forbs; the mixture produces a
relatively dense growth of plants up to 0.6 m tall, with roots capable of penetrating
more than 2 m deep in fertile soil. The difference between native plants found in
eastern and western Oklahoma is primarily the result of the water supply available
to the plants.
© 2009 by Taylor & Francis Group, LLC
110 Evapotranspiration Covers for Landfills and Waste Sites
8.5.4 In t e g r a t I o n a n d In t e r a c t I o n
Chapters 5 and 6 describe individual parts of the technology that controls ET landll
cover performance. However, application of that technology in design introduces
complexity because important factors interact with others to limit and control the
function of the cover. An adequate design and evaluation of an ET landll cover
for any site employs integration of site-specic properties of plants, soil, and cli-
mate into the hydrologic estimates. Plant variables that control cover performance
include biomass-to-energy ratio, optimal and minimum temperature for growth,
maximum potential leaf-area index, leaf-area development curve, maximum sto-
matal conductance, critical soil aeration, maximum root depth, nutrient supply, and
aluminum toxicity. Daily plant growth and water use respond to soil water content,
air temperature, soil temperature, frost, soil salt, disease, and insects. Basic soil
variables that control performance include particle size distribution, gravel and rock
content, soil density, water-holding properties, pH, CEC, nutrients, heat transfer, and
oxygen transfer rate. Weather variables that control performance include solar radia-
tion, precipitation, air temperature dew point, and wind. Weather is often highly
variable from day to day.
There are numerous interactions between variables. Accurate estimates require
a robust model that uses site-specic factors and their interactions for local plants,
soil, and weather; it should correctly use those that limit plant growth and water use.
Because of the potential for weather variability from day to day, the model should
estimate a complete hydrologic water balance for each day.
A suitable design includes estimates of future hydrologic water balance for each
day of a long time period (100 years is often appropriate). With the aid of a good
model and site-specic soil, plant, and weather data, one can make a good estimate
of the performance of an ET landll cover at a site.
8.6 FINAL DESIGN
After the preliminary design shows that the ET cover is appropriate for the site, addi-
tional measurements of soil properties, assessment of potential plant materials, and
collection of the best possible weather data will be needed. Final design is similar to
preliminary design, but uses the best site-specic measured information. It should
be complete.
Before nal design starts, the borrow source for the soil cover should be identi-
ed and the properties of the soil measured. Natural soils contain layers; therefore,
the designer should select layers that are suitable for mixing and use in the cover.
Collect and analyze several samples of each proposed soil mixture separately to pro-
vide a measure of the expected variability from the average. Where the properties of
the borrow soil vary, the design should be based on soils that provide the least plant
available water capacity.
8.6.1 la y e r e d So I l co v e r S
It is common to assume that ET cover soils should be uniform mixtures. However,
it may be an advantage to place the soil in layers with differing properties to satisfy
© 2009 by Taylor & Francis Group, LLC
ET Landfill Cover Design Steps 111
requirements at some sites. For example, a site with high rainfall may need a small
amount of deep percolation. Inclusion of a high clay soil between the depths of 0.2 and
0.5 m with a layer of sandy loam on the surface may substantially increase surface
runoff and satisfy site needs. Soils with high clay content near the surface produce
more surface runoff than uniform soils, and a sandy loam soil on the surface will
ensure robust grass growth. There may be other reasons for using layered soils.
REFERENCES
ASCE (1996). Hydrology Handbook, 2nd ed. Manual 28, American Society of Civil Engi-
neers, New York.
Chichester, F. W. and Hauser, V. L. (1991). Change in chemical properties of constructed
minesoils developing under forage grass management, Soil Sci. Soc. Am. J., 55(2),
451–459.
Hicks, J., Downey, D., Pohland, F., and McCray, J. (2002). Impact of Landll Closure Designs
on Long-Term Natural Attenuation of Chlorinated Hydrocarbons. Parsons Corpora-
tion, Denver, CO. (Final report to, Environmental Security Technology Certication
Program, Arlington, VA, contract no. DACA72-00-C-0013.) Also available at: http://
www.afcee.brooks.af.mil/products/techtrans/landfillcovers/LandfillProtocols.asp
(accessed March 17, 2008).
ITRC (2003). Technical and Regulatory Guidance for Design, Installation, and Monitor-
ing of Alternative Final Landll Covers. Interstate Technology & Regulatory Council,
Washington, DC. Also available at: (accessed
March 17, 2008).
ITRC (2006). Characterization, Design, Construction, and Monitoring of Bioreactor Land-
lls. Interstate Technology & Regulatory Council, Washington, DC. Also available at:
(accessed March 17, 2008).
Reinhart, D. R. and Townsend, T. B. (1998). Landll Bioreactor Design & Operation. Lewis
Publishers, Boca Raton, FL.
Saxton, K. E. (2005). Soil Water Characteristics, Hydraulic Properties Calculator. USDA,
Agricultural Research Service.
(accessed October 28, 2005).
Saxton, K. E. and Rawls, W. J. (2005). Soil Water Characteristic Estimates by Texture and
Organic Matter for Hydrologic Solutions. USDA, Agricultural Research Service http://
users.adelphia.net/~ksaxton/SPAW%20Download.htm (accessed October 28, 2005).
Schroeder, P. R., Dozier, T. S., Zappi, P. A., McEnroe, B. M., Sjostrom, J. W., and Peyton, R. L.
(1994a). The Hydrologic Evaluation of Landll Performance (HELP) Model: User’s
Guide for Version 3. EPA/600/R-94/168a. U.S. Environmental Protection Agency, Risk
Reduction Engineering Laboratory, Cincinnati, OH.
Schroeder, P. R., Dozier, T. S., Zappi, P. A., McEnroe, B. M., Sjostrom, J. W., and Peyton,
R. L. (1994b). The Hydrologic Evaluation of Landll Performance (HELP) Model:
Engineering Documentation for Version 3. EPA/600/R-94/168b. U.S. Environmental
Protection Agency, Risk Reduction Engineering Laboratory, Cincinnati, OH.
Sharpley, A. N. and Williams, J. R., Eds. (1990). Erosion/Productivity Impact Calculator: 1.
Model Documentation. Technical Bulletin 1768. USDA, Washington, DC.
US EPA (1991). Design and Construction of RCRA/CERCLA Final Covers. EPA/625/4-91/025.
U.S. Environmental Protection Agency, Ofce of Research and Development, Wash-
ington, DC.
USDA, NRCS (2006). NRCS Soils Web Site. or http://websoilsurvey.
nrcs.usda.gov/app/ (accessed May 25, 2006).
© 2009 by Taylor & Francis Group, LLC