Evapotranspiration covers for landfills and waste sites - Chapter 9 potx
Bạn đang xem bản rút gọn của tài liệu. Xem và tải ngay bản đầy đủ của tài liệu tại đây (420.83 KB, 19 trang )
113
9
Models for Design
and Evaluation
Items of interest in design include estimates of evapotranspiration (ET), sur-
face runoff, and deep percolation. In addition, the evaluation should estimate
probability for success, thus requiring daily estimates of performance over
many years or decades.
Interacting processes govern ET landll cover performance; the interaction
introduces complexity into the modeling challenge. A model that incorporates
all of the important elements of engineering design, including the interactions
between weather, plants, and soil, best serves engineering design and evalu-
ation of ET covers. The model used for design or evaluation of an ET landll
cover should produce estimates that allow the user to evaluate the cumulative
effect of each day’s water balance activity and thus identify critical events.
9.1 A MODEL PHILOSOPHY
All numerical models calculate an approximation to a specic real-world topic of
interest. When used for their intended purpose, they are often useful. However, it
is inappropriate to use a model created for one purpose to estimate a solution to a
problem not within the scope of the original purpose of the model. For example, an
economics model is not suitable for design of a landll cover. In the same way, it
may not be appropriate to use a model developed for design of conventional-barrier
landll covers to estimate performance of an ET landll cover. The engineer should
select a design model that is appropriate for the problem.
9.2 REQUIREMENTS FOR ET LANDFILL COVER MODELS
The requirements for model estimates of ET cover performance are different from those
for conventional landll covers. Conventional cover design focuses on barrier-layer
design and performance. The focus in an ET cover design is on water balance within the
cover as controlled by weather, plant growth, soil properties, and related ingredients.
The ET landll cover relies on using the soil as a water reservoir, and grass or
other plants to empty the reservoir rapidly and completely after a precipitation event.
Therefore, the model should accurately estimate daily values of actual evapotranspi-
ration, surface runoff, and deep percolation (ET, Q, and PRK).
© 2009 by Taylor & Francis Group, LLC
114 Evapotranspiration Covers for Landfills and Waste Sites
9.2.1 Wa t e r ba l a n c e
The model must solve the water balance within the cover soil. The hydrologic water
balance is the accounting of all water entering and leaving an ET landll cover: a
mass balance. The complete mass balance (Chapter 6, Equation 6.1) may be simpli-
ed for design as
incoming water = outgoing water, or
P = ET + Q + PRK + ΔSW (9.1)
where
P = Precipitation (includes irrigation, if applied)
ET = Evapotranspiration (the actual amount)
Q = Surface runoff
PRK = Deep percolation (below cover or root zone)
∆SW = Change in soil water (SW) storage
Two terms in Equation 6.1 are not included in Equation 9.1. Within the cover soil,
there is little or no lateral ow, and it is assumed zero. Although the error term is
not zero, it should be small if one uses a good model, and it is usually impossible to
estimate its size. The error term is unknown and dropped from the design equation.
9.2.2 ac t u a l et
Because the amount of water that may percolate through the cover and into the waste
is a major design issue for landll remediation, estimates of deep percolation (PRK)
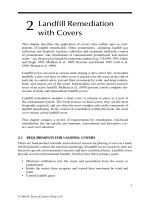
are important. However, both PRK and Q are much smaller than ET, as illustrated
in Figure 9.1. Daily estimates of water balance are central to ET cover design; it is
noteworthy that during most days, ET is 100% of the outgoing water from an ET
cover. Evapotranspiration controls the amount of water available for deep percola-
tion. The accuracy with which a model predicts ET may dene its usefulness in ET
0% 25% 50% 75% 100%
Coshocton, 70–79
Coshocton, 87–93
Bushland, Alfalfa
Bushland, Corn
PRK & Q
ET
FIGURE 9.1 Annual outgoing water balance for irrigated crops at Bushland, Texas, and for
rain-fed meadow at Coshocton, Ohio. (Drawn from data in Hauser et al. 2005. Environ. Sci.
Technol. 39(18), 7226–7233.)
© 2009 by Taylor & Francis Group, LLC
Models for Design and Evaluation 115
landll cover design even though PRK is the focus of cover performance. Because
ET is the largest part of the outgoing water balance, its accurate estimation is a high
priority for models.
Plant growth, soil water content, root growth and distribution, and related param-
eters control the amount of actual ET. The way in which a design model estimates these
parameters has profound effects on the accuracy of ET estimates. For example:
There are several methods of estimating potential evapotranspiration (PET). •
Because ET is calculated from PET, errors in PET estimates affect all other
model calculations. Using the wrong method for a site may introduce large
errors in estimates of actual ET.
The density of soil may control the presence, absence, or number of roots •
found in a particular soil layer. The density of plant roots in a soil layer
determines how much water plants can remove from the layer and its rate
of removal. A model that does not consider the effect of soil density on root
growth may not accurately estimate actual ET.
Much of the root mass of perennial plants dies during drought or during •
dormant periods every year. During a growing season, dryness of a par-
ticular soil layer may signicantly reduce the living root mass in that layer;
however, new roots grow when the soil is rewet. The entire root system of
annual plants dies each year. Therefore, it is important for the model to
estimate the changes and the growth of new roots.
9.2.3 mo d e l S a n d ca l I b r a t I o n
Some computer-based models are accurate only after “calibration” for the problem
in question. In order to make the model output match calibration data, one or more
parameters within the model are changed. A complex model suitable for ET cover
design may contain parameters that the user may change. Changes in a few internal
parameters may create unexpected or unknown changes in other parts of the model.
The calibrated model may match the calibration data but become less accurate for
general use.
A model used to estimate performance of an ET cover should not require cali-
bration for two reasons. First, measurements suitable for use in model calibration
are seldom, if ever, available for a particular landll site. Second, a requirement for
calibration raises the question, “Does this model truly mimic the real world of a
landll cover?”
9.2.4 de S I g n mo d e l re q u I r e m e n t S
As noted earlier, the focus in an ET cover design is soil, plant growth, and water
balance. Scientists use models to estimate the same variables but from a different
perspective. Their models often require calibration and trial-and-error testing for
every problem; they usually estimate the water balance for a few months or a crop-
growing season. Scientists typically use more time to perfect their models for each
problem or site than a design engineer can afford.
© 2009 by Taylor & Francis Group, LLC
116 Evapotranspiration Covers for Landfills and Waste Sites
The factors that affect the hydrologic design of ET covers encompass several sci-
entic disciplines, and all of them should be included in a comprehensive computer
model. The model should effectively incorporate soil, plant, and climate variables;
include their interactions; and estimate their effects on hydrology and water balance.
It should be capable of estimating long-term performance for 100 years or more, and
the water balance for each day of the evaluation period. The model should correctly
estimate the impact of many ingredients on the water balance, including plant bio-
mass production, effect of soil density, temperature, plant growth stage, and avail-
able plant nutrients. Estimates of long-term performance should include an estimate
of long-term loss of primary plant nutrients from the ecosystem.
An engineering design model for ET landll covers should be robust and simu-
late the entire hydrologic cycle. Model requirements include the following:
1. The model should be tested against eld measurements of P, ET, Q, and
PRK, and proved to produce small error.
2. It should be tested and proved in different climates.
3. No calibration should be needed; ready to use.
4. Input data should be easily available.
5. It should provide reliable answers with less than optimum input data.
6. The model should estimate missing input data.
7. It should stochastically generate precipitation (rain and snow), air tempera-
ture, wind, solar radiation, and humidity from known local parameters.
8. The model should realistically simulate all parts of the water balance
equation.
9. It should simulate daily values of all parameters for decades or centuries.
10. It should contain les of basic data inside the model for numerous site-
specic climates, plants, and soils.
11. The model should realistically simulate effect of plant growth and biomass
production on water balance.
12. Output data should be complete, user-selectable, exible, and easy to import
into other design software.
9.3 POTENTIAL MODEL ACCURACY
Designers, owners, and regulators should understand the limits of accuracy that are
reasonable to expect from design, construction, and implementation of remediation
measures on landlls. Therefore, knowledge of possible limits to model accuracy is
helpful when choosing a model for design.
Field measurements and observations typically provide the basis for model
development and testing. Because the accuracy of eld measurement is limited, it is
unlikely that the models developed from the data will be perfect. In order to improve
the quality of the model, the developer should use eld measurements from sev-
eral sources during development and testing, thus reducing the potential error of
the model during general use. An understanding of the potential accuracy of eld
research measurements provides useful insight into possible model accuracy.
© 2009 by Taylor & Francis Group, LLC
Models for Design and Evaluation 117
Hauser et al. (2005) evaluated measurements by three high-quality lysimeter
facilities that measured all parts of the hydrologic water balance. The records
included 17 years of measurements from Coshocton, Ohio, and two lysimeter records
of 2 years each from Bushland, Texas. These experimental sites are among the best
in the world, and the precision of the lysimeters was better than that of a single class-
A rain gage measurement. The lysimeter at Coshocton is sufciently sensitive to
provide accurate measurements of daily ET, and those at Bushland are capable of
measuring hourly values of ET. The precision of the Coshocton and Bushland lysim-
eters was 0.25 and 0.045 mm/day, respectively. The data were independent mea-
surements of all parts of the water balance; as a result, one can readily estimate
measurement errors. The annual water balance errors from these high-quality lysim-
eter facilities, with widely differing climate, ranged between 5 and 15% of precipita-
tion, measured by a standard rain gage at each site. Model developers usually use
measured data from several sites during development and testing. Models developed
from measurements at several locations are expected to be more accurate for general
use than those developed at a single site. As a result, one should expect annual total
water balance estimates by good models to be in error by about 5%, with possible
errors up to 10% of annual precipitation.
9.4 MODELING SOIL WATER MOVEMENT
In order to estimate deep percolation below a soil prole, it is rst necessary to esti-
mate water movement within the soil prole. There are two leading methods to
estimate water ow within the soil. Some numerical programs compute water ow
within the soil using the “Richards’ equation.” These models are sometimes called
theoretical or scientic models because they use the Richards’ equation. Other mod-
els employ “water storage routing” to simulate water movement within the cover.
9.4.1 rI c h a r d S ’ eq u a t I o n
The “theoretical” models utilize numeric approximations to a complex set of equa-
tions based on Richards’ equation (Richards 1931). Warrick (1990) discusses both the
development and status of this equation. No one has mathematically solved the equa-
tion, but assumptions allow a numeric solution. Warrick (1990) presents four different
forms of Richards’ equation. Numeric methods employ numerous calculations using
complex equations; therefore, computer simulation is required for their solutions.
Important assumptions are used to allow numeric solutions for the Richards’
equation; they may compromise the theoretical basis of the equation. They include
the following:
1. Darcy’s law is incorporated into the solution.
2. The density of water is constant.
3. A unique relationship exists for each soil between water content (theta) and
water pressure (head) for unsaturated soil.
4. A unique relationship exists for each soil between water content (theta) and
unsaturated hydraulic conductivity (K
unsat
).
© 2009 by Taylor & Francis Group, LLC
118 Evapotranspiration Covers for Landfills and Waste Sites
Darcy’s law was developed for saturated sand lters. ET cover soils are unsaturated
soil; thus, the assumption that Darcy’s law applies may be questionable. The density
of water in unsaturated soil is beyond the scope of this book.
When applied to the ET landll cover problem, the denition of the relationship
between theta and head or between theta and K
unsat
is particularly troublesome. The
relationships are logarithmic, and small changes in water content may cause large
changes in the value of head or K
unsat
. Small changes in particle size distribution,
particle arrangement, organic content, or soil density can signicantly alter these
relationships. In addition, the soil within an ET cover or natural eld is not homoge-
neous. It is difcult to dene these logarithmic functions with sufcient accuracy for
use in model estimates of ET cover performance. To add to the difculty, the relation
between these parameters is different for the wetting and drying soil situations.
There are other assumptions, but these are important and serve for discussion
purposes. In spite of the possible discrepancies introduced by the assumptions, the
numerical solutions to Richards’ equation have produced good results when applied
to scientic studies of unsaturated ow that are limited in time and space. Richards’
equation is superior to other methods in many applications; however, it may or may
not be superior for engineering design of ET covers.
9.4.2 Wa t e r St o r a g e ro u t I n g
Some models use water storage routing to simulate water movement through the soil.
This section describes water storage routing by the Environmental Policy Integrated
Climate (EPIC) model; other models use similar methods.
Within the model, ow out of a soil layer occurs when the soil water content
exceeds eld capacity. Water drains downward from the layer until the storage returns
to eld capacity. The saturated hydraulic conductivity controls ow rate through the
layer. The routing process applies layer by layer from the surface downward through
the deepest layer.
Because the hydraulic conductivity of some layers may be lower than that for
layers above them, the routing scheme can create the impossible situation where the
water content of the layer exceeds the pore volume. For that situation, a back pass
upward moves water into upper layers until none holds more water than the volume
of the pore space.
EPIC may move water upward from a layer if that layer’s storage exceeds eld
capacity, but movement is dependent on the water tension in that layer and the layer
immediately above. When the water content of all layers is less than or equal to the
eld capacity, the water storage routing method does not allow water to move upward
through the prole. The water storage routing method assumes a simplistic model
of water ow within the soil. In spite of its limitations, this method performs well in
the EPIC and other models.
9.5 PREVIOUS MODEL EVALUATIONS
There are several reports of model evaluations for vegetative landll covers. One
report compared 18 models with one another and evaluated them against incomplete
eld measurements. They stated, “Drainage could be estimated to within about
© 2009 by Taylor & Francis Group, LLC
Models for Design and Evaluation 119
±64% by most codes” (Scanlon et al. 2002). Others evaluated one or more models
(Roesler et al. 2002; Khire et al. 1999; Khire et al. 2000; Choo and Yanful 2000;
Anderson et al. 1993).
These investigations had common characteristics. All compared model esti-
mates against predictions by other models or incomplete eld measurements of short
duration. Even though actual ET is the largest and most important part of the site
water balance, none measured it; instead, they either calculated potential ET from
weather measurements or estimated actual ET by difference from the other measure-
ments. None of the investigators assessed the accuracy of the measurements that
they used to test model accuracy.
Neither the models nor the tests met the requirements for designing ET landll
covers contained in Section 9.2.4. Although these comparisons may be useful to
model developers or others, none provided recommendations that are useful to the
landll cover design engineer.
9.6 EVALUATION OF THREE MODELS
This section compares estimates by three models with excellent quality eld mea-
surements made by three lysimeters at two locations. The models are (1) the Hydro-
logic Evaluation of Landll Performance (HELP) model, version 3.07 (Schroeder
et al. 1994a,b), (2) the Environmental Policy Integrated Climate (EPIC) model, ver-
sion 8120 (Mitchell et al. 1998; Sharpley and Williams 1990; Williams et al. 1990;
Williams 1995), and (3) the HYDRUS-1D version 3.0 (Simunek et al. 2005). The
HELP and EPIC models are engineering models; HYDRUS-1D was developed as a
scientic model, but it has been used to solve engineering problems. These models
are uniquely different from one another and represent three classes of models. The
developer and others extensively tested each of them; they were widely acclaimed
for their intended use.
The purpose was to evaluate fully developed and tested models for use in engi-
neering design of ET landll covers. The models estimated the major input and out-
put terms of the water balance (P, ET, Q, and PRK). The model estimates were
compared to independent eld measurements of all terms in the water balance. The
accuracy of the eld measurements was known.
9.6.1 helP mo d e l
The HELP model was developed during the early deployment of barrier landll cov-
ers. It is an engineering model designed for analysis and design of barrier-type land-
ll covers. It is widely used and accepted for that purpose. The primary purpose of
the HELP model is to provide water balance estimates with which to examine the
expected performance of barrier design alternatives and the resulting effect on land-
ll contents.
The HELP model uses climate, soil, and design data to estimate daily landll
hydrologic performance as expressed by surface storage, snowmelt, runoff, inltra-
tion, ET, soil moisture storage, leachate recirculation, and leakage through barrier
layers. It is capable of modeling landll systems for up to 100 years. The HELP model
© 2009 by Taylor & Francis Group, LLC
120 Evapotranspiration Covers for Landfills and Waste Sites
was extensively tested during development; however, it failed to meet expectations for
the evaluation of vegetative covers (Benson and Pliska 1996; Khire et al. 1997).
9.6.2 ePIc mo d e l
The EPIC model is an engineering model designed to estimate all parts of the daily
water balance, soil erosion, plant production, and soil’s physical and nutrient status.
The development of EPIC began in 1981; from the beginning, it was built for use
on ungaged watersheds. EPIC estimates the hydrologic water balance, including all
terms in Equation 9.1. It uses a daily time step to simulate climate and hydrologic
parameters for a wide range of soils, climates, and plants. EPIC uses readily avail-
able input data and can simulate hydrologic response for hundreds of years.
The EPIC model was tested for water balance estimates in dry and wet cli-
mates, including sites with signicant accumulation of snow in winter. Gassman
et al. (2004) cite 200 research papers reporting testing and use of the EPIC model
worldwide. Testing of the EPIC model against measured eld data demonstrated that
it estimated PRK with satisfactory accuracy (Chung et al. 1999; Chung et al. 2001;
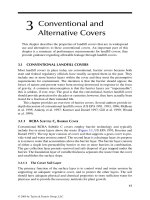
Hauser et al. 2005). In addition, Meisinger et al. (1991) offered convincing evidence
that EPIC estimates PRK accurately (see Figure 9.2).
EPIC has no easy provisions to model barrier layers, although it would be pos-
sible to specify soil layers with very low hydraulic conductivity. It can estimate lat-
eral ow; however, it would be difcult to describe layer properties for solid waste
and the barrier-layer -drainage system under the waste.
9.6.3 hydruS-1d mo d e l
HYDRUS-1D is primarily a scientic model, although it has been used to solve
engineering problems. The model numerically solves Richards’ equation for variably
saturated water ow and convection-dispersion type equations for heat and solute
transport. HYDRUS-1D is available in three versions: one-, two-, and three-dimen-
sional water, heat, and solute ow. HYDRUS-1D is the one-dimensional model and
0
20
40
60
80
100
mm
EPIC
Measured
DNOSAJJMAMFJ
FIGURE 9.2 Lysimeter measured, monthly percolation during 3 years at Coshocton,
Ohio, compared with estimates by the EPIC model. (Drawn from data in Meisinger et al.
1991. Proceedings, Cover Crops for Clean Water. Soil Conservation Society, Ankeny, Iowa,
pp. 57–68.)
© 2009 by Taylor & Francis Group, LLC
Models for Design and Evaluation 121
is most suitable for ET landll cover design. It is described in the manual and in the
online Web page, PC-Progress Discussion Forums (Simunek et al. 2005).
HYDRUS-1D estimates actual ET; however, the user must separately calculate
and enter daily values of precipitation, potential soil evaporation, and potential plant
transpiration. The user obtains actual ET from the model output by adding the model
estimates for “actual root uptake” and “actual surface evaporation.” It estimates inl-
tration with a model-supplied inltration equation, and surface runoff as the differ-
ence between precipitation and inltration. HYDRUS-1D is sensitive to time-step
denition, and may require iterative runs to nd an acceptable time-step denition
for a particular problem.
9.6.4 mo d e l dI f f e r e n c e S
There are signicant differences between the models. The EPIC model contains a
complete plant growth model, as well as hydrological estimates. The others provide
less complete plant growth simulation.
The estimate of ET dominates hydrologic modeling accuracy, because it is the
largest part of the water balance and it controls the size of the other terms esti-
mated by the model. The mass of plant roots in a soil layer limits the amount of
water that plants can remove from the layer during each day; therefore, root mass
and rate of root growth are important for accurate ET estimates. The stage of plant
growth, soil density, and temperature control root mass and growth rate processes.
Table 9.1 shows the differences between model characteristics that are important to
root growth estimates.
The HELP model treats frozen soils as impermeable; however, the EPIC model
treats them as having reduced permeability. The HYDRUS-1D model allows snow
accumulation, but the manual does not indicate how it handles inltration into frozen
soil. These differences may signicantly affect water balance estimates.
Both EPIC and HELP are engineering models that estimate all hydrologic terms
important to ET landll cover design. They have different origins, but both evalu-
ate the hydrologic cycle and satisfy basic requirements for engineering design. The
HELP model was designed to evaluate barrier covers; EPIC was designed to simu-
late the water balance in a soil prole in response to weather, plant growth, and soil
TABLE 9.1
Characteristics of the EPIC, HELP, and HYDRUS-1D
Models That Are Important for Root Growth Estimates
Characteristic EPIC HELP HYDRUS-1D
Actual root growth
a
Yes No Y/N
b
Soil density vs. root growth Yes No No
Soil temperature vs. root growth Yes No No
a
Root growth in response to season, soil conditions, and plant parameters.
b
Estimates root growth one time, and no further change.
© 2009 by Taylor & Francis Group, LLC
122 Evapotranspiration Covers for Landfills and Waste Sites
properties. The HYDRUS-1D model began as a scientic model for soil physics
investigations; it does not share the same focus as the other two.
9.7 MODEL TEST DATA
The models were tested against accurate eld measurements made by the Agri-
cultural Research Service (ARS) of the U.S. Department of Agriculture (USDA)
at two locations. At Coshocton, Ohio, the ARS measured the hydrologic response of
meadow with a lysimeter for a total of 17 years. At Bushland, Texas, ARS measured
the hydrologic response of alfalfa and corn with two lysimeters for 2 years.
At both locations, the investigators measured all parts of the water balance
directly (P, ET, Q, and PRK). The lysimeters measure ET and P by weighing the
mass of the lysimeter each hour of the day or more often. Percolation from the soil
and surface runoff were continuously measured. The measurements of Q and PRK
were independent of each other and the ET and P measurements. These model tests
used daily measurements of each parameter of the water balance. Hauser et al. (2005)
described the data.
9 . 7 . 1 c o S h o c t o n da t a
ARS, USDA personnel made the Ohio measurements at the North Appalachian
Experimental Watershed (NAEW). The site is located about 16 km (10 mi) northeast
of Coshocton, Ohio, at 40.4° N latitude and 81.5° W longitude. The vegetation was
meadow and similar to plant cover that might be established on an ET landll cover
in that region.
The dimensions of the soil block contained in the lysimeter are 4.3 m (14 ft) long,
1.9 m (6.2 ft) wide, and 2.4 m (8 ft) deep, with the long dimension up- and down-
hill. The lysimeter soil block is an undisturbed natural soil prole from the site; it
includes bedrock in the bottom layers, thus ensuring natural percolation processes.
The land slope is about 23%, and the lysimeter precision was 0.25 mm/day. The
lysimeter is similar to that shown in Chapter 6, Figure 6.3.
Precipitation, air temperature, humidity, wind, and solar radiation measurements
were available from a nearby weather station, and precipitation was measured at
the site. Percolation outow was about 31% of precipitation (Harrold and Dreibelbis
1958,1967; Malone et al. 1999).
9.7.2 bu S h l a n d da t a
Personnel at the Conservation and Production Research Laboratory, ARS, USDA,
made the Texas measurements. The lysimeters were located near Bushland, Texas, on
the Texas High Plains in a semiarid climate at 35.2° N latitude and 102.0° W longitude
(about 24 km west of Amarillo). The two weighing and recording monolithic lysim-
eters contained undisturbed columns of Pullman clay loam soil with surface area of
9 m
2
. The soil depth was 2.3 m. Irrigated corn grew in one lysimeter during 1989 and
1990, and irrigated alfalfa grew in the other lysimeter during 1996 and 1997.
Precipitation, air temperature, humidity, wind, and solar radiation measurements
were available from a weather station operated at the site over irrigated grass and from
© 2009 by Taylor & Francis Group, LLC
Models for Design and Evaluation 123
another station at laboratory headquarters located over mowed native grass (Marek
et al. 1988; Howell et al. 1989). In spite of heavy irrigation, percolation outows were
small or zero from these lysimeters.
9.8 COMPARISON OF THREE MODELS
The models used available data, duplicating their use in an engineering design. The
models were not calibrated, even though measured results were available. They dif-
fered in their input data needs and their handling of plant, plant–soil interaction, and
ET estimates.
The estimates by the models and the measured values used to test them were
daily values. The daily variability in weather created signicant variations in ET,
Q, and PRK in both the measurements and model estimates. Monthly and annual
sums are less variable and are more easily statistically evaluated and compared to
measurements. The comparisons between measured values and the model estimates
are based on annual or monthly sums of ET, Q, and PRK.
9.8.1 da t a ev a l u a t I o n
Many preferred statistical measures for evaluating hydrological data are based on
the assumption that the data came from a normally distributed population. Hauser
et al. (2005) evaluated the input data for Coshocton and Bushland and found that
the annual totals and the maximum month totals for each year for ET and PRK
were normally distributed; but the Q measurements were not normally distributed.
Therefore, annual and monthly averages of the model estimates for ET and PRK,
and the median values for model estimates of Q are compared with similar data from
the measurements. It is also useful to examine the total value and associated error of
each term in the water balance over the duration of the measurements.
The reference value used to estimate the “percentage error” term inuences the
interpretation of results. For example, the error of the PRK estimate by HELP for
corn at Bushland is −16.5 mm/year. The percentage error based on the measured
PRK value is −75%, but it is only −2.0% if based on precipitation. The intuitive
assumption is that percentage error should be based on measured parameter values.
There are valid reasons for also examining error estimates based on total precipita-
tion, including the following:
The relative size of the water balance terms is important. Even though •
the error of PRK, for example, may be only a few millimeters, the percent-
age error may be large when calculated from a small measured amount.
Small parts of the hydrologic water balance, such as PRK, are measured •
directly and independently in lysimeter measurements. However, model
estimates of PRK are not independent; they contain increased error caused
by errors made by the model in estimating the larger terms.
It is important to dene the error in a way that is consistent with the intended •
use of the model estimates. A major concern in landll cover design is the
fraction of annual precipitation that may inltrate through the cover and
into the waste.
© 2009 by Taylor & Francis Group, LLC
124 Evapotranspiration Covers for Landfills and Waste Sites
Error estimates presented here used both measured parameter values and precipi-
tation as reference values. Table 9.2 contains average annual estimates of ET, Q,
and PRK by the EPIC, HELP, and HYDRUS-1D models, as well as the comparable
measured values; error estimates are based on measured values. Table 9.3 contains
totals for the period of record shown (10, 7, 2, and 2 years), and error estimates are
based on precipitation.
9.8.2 et eS t I m a t e S
All of the models estimated ET with errors less than 4% for alfalfa at Bushland
(see Tables 9.2 and 9.3). Both EPIC and HELP models accurately estimated ET for
corn at Bushland. The Coshocton measurements provide important tests because of
their length; neither the HELP nor HYDRUS-1D models estimated ET with ade-
quate accuracy for the Coshocton data. Only the EPIC model consistently estimated
average annual ET with small errors for all of the eld measurements, as shown in
Tables 9.2 and 9.3.
9.8.3 q eS t I m a t e S
Surface runoff (Q) is more difcult to estimate than ET because the methods avail-
able to estimate Q are less accurate than those available for ET. Because the measured
amount is small, relatively small errors in runoff amount result in large percentage
errors when compared against the measured amount.
It is natural to think that the difference between rainfall rate and inltration
rate should produce superior estimates of Q. However, it is not that simple. Instan-
taneous rainfall rates are generally unavailable; therefore, the design engineer must
use total daily rainfall in model estimates. The inltration rate decreases exponen-
tially with time during a storm for any soil; in addition, the curve relating inltration
rate and time varies with the beginning soil water content and unknown factors. The
inltration rate may be controlled by soil properties, or it may be controlled by the
soil crust. Soil crusts typically have different properties compared to the soils from
which they are created. Available methods do not adequately explain the soil crust
issue. As a result, the “curve number method” is widely used, perhaps because it is
easier to understand, and provides estimates equal to or better than those of other
methods. The EPIC and HELP models used the curve number method in these tests.
EPIC has the alternative of using an inltration method. HYDRUS-1D uses only an
inltration equation method. The models produced poor estimates of Q, except for
Bushland, where the lysimeters allowed no runoff; it was easy to set each of the three
models to produce zero surface runoff (Table 9.2). The error in total Q estimates by
each of the models was small when measured against precipitation, because Q is so
much smaller than P (Table 9.3).
9.8.4 Prk eS t I m a t e S
The EPIC model consistently produced the smallest errors in PRK estimates
(Table 9.2). EPIC errors were all less than 4% of measured precipitation (Table 9.3).
© 2009 by Taylor & Francis Group, LLC
Models for Design and Evaluation 125
TABLE 9.2
Annual Average of ET and PRK, and Median of Annual Values of Q for Coshocton and Bushland
Measurements and Model Estimates
Measured
Model
Model Estimates
P
Mean
(mm/yr)
ET
Mean
(mm/yr)
Q
Median
(mm/yr)
PRK
Mean
(mm/yr)
ET Q PRK
Mean
(mm/yr)
Error
a
(%)
Median
(mm/yr)
Error
(%)
Mean
(mm/yr)
Error
(%)
Coshocton, Meadow, 1970–1979
1107 767 4.4 368 EPIC 753 −2 3.4 −23 318 −14
HELP 547 −29 71 +1500 492 +34
HYDRUS 1000 +30 <0.1 −98 106 −71
Coshocton, Meadow, 1987–1993
1024 764 1.2 276 EPIC 732 −4 0.0 −100 259 −6
HELP 570 −25 7 +500 429 +55
HYDRUS 984 +29 <0.1 −92 31 −89
Bushland, Alfalfa, 1996 and 1997
1476 1514 0 0 EPIC 1460 −4 0 0 0 0
HELP 1478 −2 0 0 71 >+100
HYDRUS 1532 +1 0 0 2 >+100
Bushland, Corn (Growing Season)
b
, 1989 and 1990
832 809 0 22 EPIC 867 +7 0 0 31 +41
HELP 869 +7 0 0 5.5 −75
HYDRUS 506 −37 0 0 0.4 −98
a
Percentage error based on measured parameter value.
b
Bushland corn: average of May 1 to December 31 only for 1989 and 1990.
© 2009 by Taylor & Francis Group, LLC
126 Evapotranspiration Covers for Landfills and Waste Sites
TABLE 9.3
Total P, ET, Q, and PRK Measured at Coshocton and Bushland for the Periods Shown,
and the Model Estimates
Measured
Model
Model Estimates
P
(mm)
ET
(mm)
Q
(mm)
PRK
(mm)
ET Q PRK
(mm) (%) (mm) (%) (mm) (%)
Coshocton, Meadow, 1970–1979
11,067 7,670 63 3,678 EPIC 7,532 −1 312 2 3,177 −4
HELP 5,472 −20 669 6 4,917 11
HYDRUS 9,997 −21 0.2 −1 1,064 −24
Coshocton, Meadow, 1987–1993
7,170 5,351 14 1,930 EPIC 5,125 −3 185 2 1,815 −2
HELP 3,987 −19 159 2 3,005 15
HYDRUS 6,890 22 0.8 <−1 214 −24
Bushland, Alfalfa, 1996 and 1997
2,953 3,028 0 0 EPIC 2,920 −4 0 0 0 0
HELP 2,957 −2 0 0 142 5
HYDRUS 3,065 1 0 0 2 <1
Bushland, Corn (Growing Season)
2
, 1989 and 1990
1,664 1,616 0 44 EPIC 1,734 7 0 0 62 1
HELP 1,738 7 0 0 11 −2
HYDRUS 1,013 −36 0 0 0.8 −3
a
Percentage error based on total precipitation.
b
Bushland corn—totals for May 1 to December 31 only during 1989 and 1990.
© 2009 by Taylor & Francis Group, LLC
Models for Design and Evaluation 127
The HELP model produced errors in PRK estimates between 34 and 100% when
evaluated against measured values (Table 9.2). The HYDRUS-1D model produced
errors in PRK estimates between 71 and 100% when evaluated against measured
values (Table 9.2). All models produced smaller errors in PRK estimates when they
were compared with P (Table 9.3).
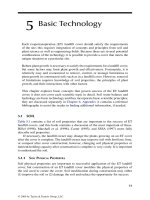
9.8.5 mo n t h l y eS t I m a t e S
A model should mimic the measured natural pattern as well as the annual or total
amount of ET, Q, and PRK. Figures 9.3 and 9.4 present the average monthly ET and
PRK estimates by each model along with the measured values during the 10 year
period 1970–1979 at Coshocton.
In North America, ET for the month of June is generally higher than for any
other month, but the measured ET was low in the Coshocton record, as seen in
Figure 9.3. June is often the month for the rst hay harvest from meadow, which is
most likely the cause of the reduced average ET measured during this month. The
EPIC model closely approximated the measured amounts in all months except June.
The HELP model underestimated ET during May through September, the critical
0
50
100
150
200
Month
ET, mm
Measured
EPIC
HELP
HYDRUS-1D
D N O S A J J M A M F J
FIGURE 9.3 Monthly ET at Coshocton during 1970–1979.
0
50
100
150
Month
PRK, mm
Measured
HELP
EPIC
HYDRUS-1D
D N O S A J J M A M F J
FIGURE 9.4 Average monthly deep percolation at Coshocton during 1970–1979.
© 2009 by Taylor & Francis Group, LLC
128 Evapotranspiration Covers for Landfills and Waste Sites
growing season months, when maximum energy is available to evaporate water. The
HYDRUS-1D model estimated too much ET for March through July, and again for
November. The EPIC model estimated ET with little error during the whole year;
the others did not.
Figure 9.4 presents the average monthly PRK estimate by each model with the
measured value for each month during the 10 year period 1970–1979 at Coshocton.
The EPIC model estimates generally paralleled the measured amounts, whereas the
other models produced signicant departures from the pattern. Figure 9.2 presents a
comparison of the measured PRK from a different Coshocton lysimeter along with
estimates by the EPIC model (Meisinger et al. 1991).
9.9 MODEL CHOICE
This discussion refers to model choice for the design of ET landll covers. The HELP
model was developed and tested for design of barrier covers; it is a good model for
that purpose, but not for ET cover design. The HYDRUS-1D model was developed
and tested for use in scientic investigations of water, solute, and heat ow in soils; it
is a good model for that purpose, but has proved not useful for ET cover design.
9.9.1 helP mo d e l
New users should nd the HELP model relatively easy to learn. The output data are
suitable for engineering design use. Even though this model is superior for barrier-
type landll cover design, it has characteristics that limit its usefulness when used
for ET cover design:
Soils descriptions are incomplete.•
It describes the root system by a single parameter, “evaporative depth.”•
It does not account for the effects of soil density or temperature on soil •
water use.
It contains insufcient plant parameters that are important to ET estimates.•
9.9.2 hydruS-1d mo d e l
New users may encounter difculty in learning to use this model; however, extensive
help is available at the model Web site. The output data may not be easy to use for
some engineering design purposes. It has characteristics that limit its usefulness
when used for ET cover design. For example:
Soil descriptions do not include plant nutrient information.•
It assumes that the plant root system is static for all time.•
It contains insufcient plant parameters that are important to ET estimates.•
A signicant strength of the HYDRUS-1D model is its use of Richards’ equation to
estimate water ow in unsaturated soils.
© 2009 by Taylor & Francis Group, LLC
Models for Design and Evaluation 129
9.9.3 ePIc mo d e l
The EPIC model is suitable for ET landll cover design and produces water balances
with accuracy similar to that of high-quality hydrologic measurements. EPIC is a
exible model and can create multiple runs and different landll cover designs with
little additional effort after it is set up for the site. The model output data is highly
satisfactory for engineering design; it allows the user to select the amount (daily,
monthly, annual, or other) and content of the output numbers.
The EPIC model is exible because there are multiple independent input data
les. Each of them may be used in different estimates for a given site. Therefore,
the exibility of EPIC requires organization by the user; assistance is available from
the source. Appendix C contains additional discussion of model use and sample
forms to assist the EPIC 8120 user.
9.9.4 mo d e l co n c l u S I o n
Several models estimate water balance or water movement within the soil. This
evaluation represents a snapshot in time; each of these models may be redeveloped
or improved, and other models may appear that should be considered. Of the three
models tested, the EPIC model appears to be best suited for ET landll cover design
and evaluation.
REFERENCES
Anderson, J. E., Nowak, R. S., Ratzlaff, T. D., and Markham, O.D. (1993). Managing soil
moisture on waste burial sites in arid regions. J. Environ. Qual. 22, 62–69.
Benson, C. H. and Pliska, R. J. (1996). Final covers: HELP needs help from the eld. Waste
Age 27, 89–98.
Choo, L. and Yanful, E. K. (2000). Water ow through cover soils using modeling and experi-
mental methods. J. Geotech. Geoenvion. Eng. 126, 324–334.
Chung, S. W., Gassman, P. W., Huggins, D. R., and Randall, G. W. (2001). EPIC tile ow and
nitrate loss predictions for three Minnesota cropping systems. J. Environ. Qual. 30,
822–830.
Chung, S. W., Gassman, P. W., Kramer, L. A., Williams, J. R., and Gu, R. (1999). Validation
of EPIC for two watersheds in Southwest Iowa. J. Environ. Qual. 28, 971–979.
Gassman, P. W., Williams, J. R., and Benson, V. W. et al. (2004). Historical Development
and Applications of the EPIC and APEX Models. ASAE/CSAE Meeting Paper number
042097, available from: American Society of Agricultural Engineers, 2950 Niles Rd.,
St. Joseph, MI 49085.
Harrold, L. L. and Dreibelbis, F. R. (1967). Evaluation of Agricultural Hydrology by Mono-
lith Lysimeters, 1956–62. USDA, Tech. Bull. 1367. U.S. Department of Agriculture:
Washington, DC.
Harrold, L. L. and Dreibelbis, F. R. (1958). Evaluation of Agricultural Hydrology by Mono-
lith Lysimeters, 1944–55. USDA, Tech. Bull. 1179. U.S. Department of Agriculture,
Washington, DC.
Hauser, V. L., Gimon, D. M., Bonta, J. V., Howell, T. A., Malone, R. W., and Williams, J. R.
(2005). Models for hydrologic design of evapotranspiration landll covers. Environ.
Sci. Technol. 39(18), 7226–7233.
© 2009 by Taylor & Francis Group, LLC
130 Evapotranspiration Covers for Landfills and Waste Sites
Howell, T. A., Copeland, C., Schneider, A. D., and Dusek, D. A. (1989). Sprinkler irrigation
management for corn—Southern Great Plains. Trans. ASAE 32, 147–154.
Khire, M. V., Benson, C. H., and Bosscher, P. J. (1997). Water balance modeling of earthen
nal covers. J. Geotechnical Geoenviron. Eng. 123, 744–754.
Khire, M. V., Benson, C. H., and Bosscher, P. J. (1999). Field data from a capillary barrier and
model predictions with UNSAT-H. J. Geotech. Geoenvion. Eng. 125, 518–527.
Khire, M. V., Benson, C. H., and Bosscher, P. J. (2000). Capillary barriers: Design variables
and water balance. J. Geotech. and Geoenvionmental Eng. 126, 695–708.
Malone, R. W., Stewardson, D. J., Bonta, J. V., and Nelson, T. (1999). Calibration and quality
control of the Coshocton weighing lysimeters. Trans. ASAE 42, 701–712.
Marek, T. H., Schneider, A. D., Howell, T. A., and Ebeling, L. L. (1988). Design and construc-
tion of large weighing monolithic lysimeters. Trans. ASAE 31, 477–484.
Mitchell, G., Griggs, R. H., Benson, V., and Williams, J. W. (1998). The EPIC model, envi-
ronmental policy integrated climate, formerly erosion productivity impact calculator.
Texas Ag. Exp. Sta. and Agric. Research Service, USDA, 808 East Blackland Road,
Temple, Texas.
Meisinger, J. J., Hargrove, W. L., Mikkelsen, R. L., Williams, J. R., and Benson, V. W. (1991).
Effects of cover crops on groundwater quality. Proceedings, Cover Crops for Clean
Water. Soil Conservation Society, Ankeny, Iowa, pp. 57–68.
Richards, L. A. (1931). Capillary conduction of liquids through porous media. Physics
1: 318–333.
Roesler, A. C., Benson, C. H., and Albright, W. H. (2002). Field Hydrology and Model Predic-
tions for Final Covers in the Alternative Assessment Program–2002. Geo Engineering
Report No. 02–08. Geo Eng. Program, Univ. of Wisconsin, Madison, WI 53706.
Scanlon, B. R., Christman, R. M., Reedy, R. C., Porro, I., Simunek, J., and Flerchinger, G. N.
(2002). Intercode comparisons for simulating water balance of surcial sediments in
semiarid regions. Water Resources Research 38(12): 1323–1382.
Schroeder, P. R., Dozier, T. S., Zappi, P. A., McEnroe, B. M., Sjostrom, J. W., and Peyton,
R. L. (1994a). The Hydrologic Evaluation of Landll Performance (HELP) Model:
User’s Guide for Version 3. EPA/600/R-94/168a. US EPA, Risk Reduction Engineering
Laboratory, Cincinnati, Ohio.
Schroeder, P. R., Dozier, T. S., Zappi, P. A., McEnroe, B. M., Sjostrom, J. W., and Peyton,
R. L. (1994b). The Hydrologic Evaluation of Landll Performance (HELP) Model:
Engineering Documentation for Version 3. EPA/600/R-94/168b. US EPA, Risk Reduc-
tion Engineering Laboratory, Cincinnati, Ohio.
Sharpley, A. N. and Williams, J. R. (Eds.), (1990). Erosion/Productivity Impact Calculator:
1. Model Documentation. Tech. Bull. 1768. U.S. Department of Agriculture: Washing-
ton, DC.
Sharpley, A. N. and Williams, J. R. (Eds.), (1990). Erosion/Productivity Impact Calculator: 2
User Manual. Tech. Bull. No. 1768. U.S. Department of Agriculture, Washington, DC.
Simunek, J., van Genuchten, M. Th., and Sejna, M. (2005). The HYDRUS-1D Software
Package for Simulating the One-Dimensional Movement of Water, Heat, and Multiple
Solutes in Variably-Saturated Media, Version 3.0. Department of Environmental Sci-
ences, University of California at Riverside, Riverside, California. Available from:
(accessed February 10, 2008). Online forum at: http://www.
pc-progress.cz/_forum/. (accessed February 10, 2008).
Warrick, A. W. (1990). Nature and dynamics of soil water. In Irrigation of Agricultural Crops,
Stewart, B. A., and Nielsen, D. R. (Eds.), pp. 69–92. Agronomy No. 30. American Soc.
of Agronomy, Crop Science Soc. of America, and Soil Science Soc. of America, Madi-
son, Wisconsin, USA.
© 2009 by Taylor & Francis Group, LLC
Models for Design and Evaluation 131
Williams, J. R. (1995). The EPIC model. In Computer Models of Watershed Hydrology, V. P.
Singh (Ed.), pp. 909–1000. Water Resources Publications, Highlands Ranch, CO.
Williams, J. R., Dyke, P. T., Fuchs, W. W., Benson, V. W., Rice, O. W., and Taylor, E. D.
(1990). EPIC—Erosion/Productivity Impact Calculator: 2. User Manual. Technical
Bulletin 1768. USDA, Washington, DC.
© 2009 by Taylor & Francis Group, LLC