báo cáo hóa học: " Hydration status and physiological workload of UAE construction workers: A prospective longitudinal observational study" pptx
Bạn đang xem bản rút gọn của tài liệu. Xem và tải ngay bản đầy đủ của tài liệu tại đây (359.04 KB, 10 trang )
BioMed Central
Page 1 of 10
(page number not for citation purposes)
Journal of Occupational Medicine
and Toxicology
Open Access
Research
Hydration status and physiological workload of UAE construction
workers: A prospective longitudinal observational study
Graham P Bates*
†1
and John Schneider
†2
Address:
1
School Public Health, Curtin University, Perth, Australia and
2
Department of Community Medicine, Faculty Medicine and Health
Sciences, UAE University, Al Ain, United Arab Emirates
Email: Graham P Bates* - ; John Schneider -
* Corresponding author †Equal contributors
Abstract
Background: The objective of the study was to investigate the physiological responses of
construction workers labouring in thermally stressful environments in the UAE using Thermal
Work Limit (TWL) as a method of environmental risk assessment.
Methods: The study was undertaken in May 2006. Aural temperature, fluid intake, and urine
specific gravity were recorded and continuous heart rate monitoring was used to assess fatigue.
Subjects were monitored over 3 consecutive shifts. TWL and WBGT were used to assess the
thermal stress.
Results: Most subjects commenced work euhydrated and maintained this status over a 12-hour
shift. The average fluid intake was 5.44 L. There were no changes in core temperature or average
heart rate between day 1 and day 3, nor between shift start and finish, despite substantial changes
in thermal stress. The results obtained indicated that the workers were not physiologically
challenged despite fluctuating harsh environmental conditions. Core body temperatures were not
elevated suggesting satisfactory thermoregulation.
Conclusion: The data demonstrate that people can work, without adverse physiological effects,
in hot conditions if they are provided with the appropriate fluids and are allowed to self-pace. The
findings suggested that workers will self-pace according to the conditions. The data also
demonstrated that the use of WBGT (a widely used risk assessment tool) as a thermal index is
inappropriate for use in Gulf conditions, however TWL was found to be a valuable tool in assessing
thermal stress.
Background
The United Arab Emirates and other Gulf States have
thousands of expatriate workers performing physical tasks
in very hostile environmental conditions during summer.
To date there have been few studies to document the
hydration status and possible fatigue of these workers
whilst working in the heat. The environmental conditions
in the summer are some of harshest in the world. As a con-
sequence it is frequently proposed that it is beyond the
physiological thresholds of these workers to work safely,
however, little data has been gathered to better under-
stand the physical strain imposed on these workers. In
addition the hydration status of these workers has not
been documented.
Published: 18 September 2008
Journal of Occupational Medicine and Toxicology 2008, 3:21 doi:10.1186/1745-6673-3-21
Received: 30 January 2008
Accepted: 18 September 2008
This article is available from: />© 2008 Bates and Schneider; licensee BioMed Central Ltd.
This is an Open Access article distributed under the terms of the Creative Commons Attribution License ( />),
which permits unrestricted use, distribution, and reproduction in any medium, provided the original work is properly cited.
Journal of Occupational Medicine and Toxicology 2008, 3:21 />Page 2 of 10
(page number not for citation purposes)
Maintaining a stable core body temperature in the face of
changing environmental conditions and metabolic work-
loads allows humans to function in diverse climates and
surroundings. In hot conditions, thermoregulation
depends upon the dissipation of body heat to the environ-
ment. Sweating cools the skin by evaporation and is the
principal heat loss mechanism when working in very hot
environments. Increased blood flow to the periphery of
the body can also cause significant heat loss through con-
vective currents and radiation.
Hydration
The rate of perspiration varies considerably, depending
upon the climatic conditions, exercise intensity and cloth-
ing worn [1]. Sweat rates between 0.3 and 1.5 L per hr can
be expected of workers in hot climates [2], resulting in
large volumes of fluid loss over the course of a day. This
can result in dehydration if adequate fluid replacement
does not occur. In thermally stressful conditions such as
occur in the UAE during summer, structured rehydration
maybe required, as discretionary fluid consumption to
avoid thirst may not be adequate to prevent dehydration.
Drinking at mealtimes is important because eating
encourages fluid intake, and electrolytes in food promote
water absorption as well as replacing sweat losses [3].
The major short-term implications of dehydration are the
result of a depleted blood volume and the consequent car-
diovascular strain. Sweat is hypotonic to blood and causes
water loss from both the intracellular and extracellular
compartments, with most significant effects occurring due
to plasma depletion. The reduced blood volume causes a
compensatory increase in heart rate of around 10
beats.min
-1
for every one percent of body weight lost [4].
Heat causes additional cardiovascular strain because
blood is required for heat loss as well as maintaining ade-
quate perfusion to working muscles. Thus evaporative and
convective heat loss become less efficient when an indi-
vidual is dehydrated, as sweating [5] and skin blood flow
[6] are both reduced. Consequentially, core temperature
rises, with increases occurring at 1% hypohydration. Core
temperature continues to rise as dehydration progresses,
with no advantage being conferred by acclimatisation
[7,8]. Core body temperature increases at a greater rate in
hypohydrated subjects, and at the same time, they exhibit
reduced tolerance to elevated temperature [9].
Studies have shown that core body temperature, heart rate
and cardiac output reach certain critical values at the point
of exhaustion [10]. Thus it follows that dehydration,
which elevates both heart rate and core temperature,
causes significant physical performance decrements.
Water deficits of 1–2% of body weight in a moderate envi-
ronment results in a 6–7% reduction in physical work
capacity, water loss of 3–4% of body weight in the same
environment causes a reduction of 22% physical work
capacity [11]. The additional cardiovascular strain
imposed by a hot environment means that a 4% body
water loss can cause a physical work capacity reduction of
around 50% [12]. Other factors associated with dehydra-
tion that accelerate fatigue are increased rate of glycogen
depletion, greater metabolite accumulation and decreased
psychological drive for work or exercise [13].
Dehydration also has marked cognitive effects. Perform-
ance in intellectual tests is affected at 2% hypohydration,
and becomes progressively worse as water deficit increases
[14]. Impaired concentration, reasoning and mood can
occur due to dehydration and the concomitant increase in
core body temperature. Not surprisingly, workplace acci-
dents are more common in hot environments, and are
often associated with heat stress and dehydration [15].
More deleterious health effects can occur if dehydration is
allowed to progress, as it increases the likelihood of heat
related illness. A number of conditions are associated with
heat stress and dehydration, namely heat rash, heat
exhaustion, heat cramps, heat oedema, heat syncope
(fainting), and chronic heat fatigue. Thermoregulatory
failure can occur in severe cases of dehydration and hyper-
thermia, resulting in heat stroke, an often fatal condition
[16].
Several long-term health consequences of dehydration
have been documented. There is a well-known link
between inadequate fluid intake and renal calculi (kidney
stones), and a recent study illustrated a high incidence of
bladder cancer in subjects who had experienced chronic
dehydration [17].
It is therefore imperative that workers performing physical
work in hot conditions maintain their hydration status in
order to maintain health as well as prevent accidents due
to associated reduced cognitive capabilities. One of the
objectives of this study was to document the hydration
status of workers throughout the 12 hr work duration.
Physical Fatigue
Intense or prolonged physical activity especially in the
heat may result in fatigue. Though the causes, symptoms
and performance consequences of fatigue are complex
and variable, physical fatigue can be classified as either
local or systemic. Local fatigue develops when the blood
flow to a working muscle is inadequate, resulting in a
reduced O
2
supply and metabolite clearance. As O
2
levels
drop, the tissue relies increasingly on anaerobic metabo-
lism with the production of lactic acid. Increased acidity
and the accumulation of metabolites reduce the efficiency
of energy production, limiting the work duration of the
tissue. Local fatigue normally occurs in static or high
Journal of Occupational Medicine and Toxicology 2008, 3:21 />Page 3 of 10
(page number not for citation purposes)
intensity work. However light to moderate, long duration
work is more commonly associated with systemic, or
whole body fatigue. Systemic fatigue can be quantified by
measuring the heart rate, O
2
uptake, blood pressure, respi-
ration rate, core body temperature, or perceived fatigue of
a worker. Continuous heart rate recording is the most
practical and informative measure, as it provides informa-
tion about the total, peak and specific muscle work loads,
the thermal stress of the environment, the work-rest pat-
tern and the work pace or mental stress associated with
the occupation [18].
Heart rates can be used to provide guidelines for accepta-
ble work intensities. The World Health Organisation
(WHO) has recommended that an average heart rate over
the duration of a working shift should not exceed 110
beats min
-1
. This is somewhat below research findings
that suggest performance deteriorates when mean work-
ing heart rates exceed 120 beats min
-1
[19]. An individual's
maximum heart rate can be approximated by subtracting
their age from 220 beats.min
-1
. Though the physiological
basis for such guidelines is scant, ISO9886 advises that a
person's heart rate should never exceed their maximum
heart rate minus 20 beats.min
-1
[20].
A useful measure calculated from heart rates is the cardiac
reserve, being the difference between the maximum and
basal heart rates of an individual. When mean working
heart rate is presented as a percentage of the cardiac
reserve, this gives an indication of the sustainability of the
workload being carried out. Percentage of cardiac reserve
is approximately equivalent to % VO
2max
, or maximum
oxygen uptake [21]. Increments in work intensity will
increase heart rate and oxygen uptake (VO
2
) proportion-
ally and therefore % cardiac reserve and % VO
2max
. Several
studies have shown that a given work load is sustainable
if % VO
2max
doesn't exceed 33–35% [22,23]. Core body
temperature begins to rise if the % VO
2max
exceeds about
50%. The type of exercise being performed also influences
VO
2max
. Upper body exercise is more demanding on the
cardiovascular system than lower body work, consequen-
tially the VO
2max
during arm work is about 70% that of
work performed by the legs [24].
Central Fatigue
Central fatigue refers to reduced central nervous system
performance, experienced as mental tiredness or exhaus-
tion. In cases where physical and mental fatigue occur
simultaneously, there is often a perceived increment in
the level of exertion required to complete a given task.
Central fatigue however, often occurs without physical
fatigue, particularly in occupations that are mentally or
perceptually demanding [6].
Lack of sleep is a common cause of central fatigue. Per-
formance decrements due to sleep loss are greatest in long
duration tasks that are mentally demanding. Reduced
CNS arousal in mentally fatigued subjects has been illus-
trated using EEG, which shows diminished electrical activ-
ity in the brain in response to auditory signals. Fatigue due
to lack of sleep can also cause prolonged heart rate recov-
ery periods after exertion, and increased resting heart
rates. There is also a higher prevalence of sleep depriva-
tion in night-shift workers [6].
Fatigue can be considered in a broader sense to encom-
pass the lifestyle, health and welfare implications of work-
ing in a stressful or taxing environment. Industrial
workers away from family and friends in the UAE present
a myriad of psychosocial issues that may affect not only
the workers, but also their spouse and families. Separation
from partners and children may exacerbate fatigue.
The work-centered lifestyle and minimal leisure time of
these workers means they have little time for recreational
activities and exercise. Other health risk behaviours such
as smoking and a poor diet may also present long-term
implications for the health of these workers.
Assessment of the Physical Environment
Physical labour in a hot and humid environment imposes
considerable physical strain on the workers, with signifi-
cant associated health risks. In order to maximise produc-
tivity without compromising a duty of care to employees,
industrial operations in hot climates must carry out quan-
titative heat stress assessment of the workplace.
The degree of thermal stress imposed by a given environ-
ment depends upon a number of variables. These are the
'dry bulb' temperature, 'wet bulb' temperature (measuring
humidity), wind speed (convection) and radiant heat.
However, calculation of a threshold for 'safe' versus
'unsafe' work also requires consideration of factors affect-
ing the individual worker. The work intensity, clothing
worn, and the heat tolerance of the subject will all affect
the risk of heat related illness or injury.
Several indices have been developed in an attempt to
quantify thermal strain. A widely used index has been the
Wet Bulb Globe Temperature (WBGT), which is still the
standard in many industries. It has been used by the
National Institute for Occupational Safety and Health
(NIOSH) and the International Organisation for Stand-
ardisation (ISO) to set work limits and guidelines for
work/rest cycling in thermally excessive environments.
Calculated using the natural wet bulb, dry bulb and globe
temperatures, the WBGT is compared to estimated meta-
bolic work loads for the task or tasks being performed.
From this it is established whether the environment is
Journal of Occupational Medicine and Toxicology 2008, 3:21 />Page 4 of 10
(page number not for citation purposes)
excessive given the required workload. The WBGT is rela-
tively easy to measure and the instrumentation is not
overly expensive, however it has several shortcomings as a
measure of thermal stress. It does not incorporate direct
measure of wind speed, and requires estimation of meta-
bolic rates, which can have a margin of error up to 50%
[25]. The guidelines are also unrealistic, as stringent appli-
cation of the protocol would demand shutdown of virtu-
ally every construction site in the UAE during summer.
Recently developed indices have addressed the inadequa-
cies of the WBGT to provide more meaningful and useful
measures of environmental heat stress. Of these the most
practical and informative is the Thermal Work Limit
(TWL) [26], developed from published studies of human
heat transfer and established heat and moisture transfer
equations through clothing. The TWL is an integrated
measure of the dry bulb, wet bulb, wind speed and radiant
heat. From these variables, and taking into consideration
the type of clothing worn and acclimatisation state of the
worker, the TWL predicts the maximum level of work that
can be carried out in a given environment, without work-
ers exceeding a safe core body temperature and sweat rate.
In excessively hot conditions, the index can also deter-
mine the safe work duration, thus providing guidelines
for work/rest cycling. Sweat rates are also calculated, so
the level of fluid replacement necessary to avoid dehydra-
tion can be established. The TWL guidelines have been
implemented in several Australian mines, and have pro-
duced a substantial and sustained decrease in the number
of cases of heat related illness. Measured in Watts.m
-2
, the
TWL can also be used to calculate loss of productivity due
to thermal stress and compare the cost of interventions
(refrigeration, ventilation) with the decrement in produc-
tivity [26]. The current study used TWL as a thermal stress
index during the working 12-hour day, whilst also com-
puting WBGT for comparison.
Methods
This study was carried out at a building construction site
in Al Ain, an inland city in the United Arab Emirates, dur-
ing May (approaching the summer months).
All participants were volunteers who gave their written
and informed consent to participate in the study, which
was authorised by management and approved by the Al-
Ain Medical District Human Research Ethics Committee.
At the commencement of the study general demographic,
health-risk behaviours, and lifestyle data was obtained by
interview, as was anthropometric data in the form of
height, weight, and BMI for each individual worker.
A total of 22 subjects (divided into 3 groups) were stud-
ied, each group over 3 consecutive days (a total of 66 sub-
ject/day records over 9 study days). The first group was
comprised of carpenters, the second steel fixers, and the
third general labourers. All workers were male expatriates
working 12-hour shifts, 6 days per week. All were
employed by a labour hire company, and were provided
with air-conditioned sleeping quarters at the labour camp.
Twelve had been recruited from India and ten from Bang-
ladesh.
The workers were engaged in the construction of a large
concrete water feature outside of a multi-story office
building. The nature of the work precluded any provision
of shade other than that offered by the nearby building.
An air-conditioned mess hall was used for the 1-hour
meal break and ample supplies of cool water were readily
available on site, and their consumption encouraged by
the contractor.
The objectives of the study were:
• To determine if workers were becoming physically
fatigued during the 12 hr shift and over a 3 day period,
using heart rate monitoring
• To identify and assess any trends in the hydration status
of workers over the shift duration and from day 1–3.
• To perform a workplace heat-stress risk assessment using
the Thermal Work Limit as an index.
Worker Monitoring
Fluid intake
Fluid consumption was determined by allocating a sepa-
rate water container to each worker participating in the
study. This personal water container was located in a cen-
tral point and a record was kept of the number of times it
required refilling. From this and the residual water left in
the container at the end of the shift fluid consumption
could be calculated. A record was also kept of additional
fluid intake in the form of tea, coffee, or soft drinks con-
sumed during the shift.
Hydration status
Hydration status was determined by measuring the spe-
cific gravity (SG) of urine samples collected from subjects
at the start, middle, and completion of each shift. SG was
measured using a handheld, calibrated, "Atago" optical
urine refractometer.
Physiological strain
Volunteers were fitted with Polar S720i heart rate moni-
tors, which supplied continuous HR data (1 recording
every 30 sec). The data was downloaded at the end of each
shift and the data used to calculate mean and maximum
working heart rates as well as percentage of cardiac
Journal of Occupational Medicine and Toxicology 2008, 3:21 />Page 5 of 10
(page number not for citation purposes)
reserve. Resting heart rates were taken while the subject
was at rest before the start of the first shift. The partici-
pants each wore the monitors for 3 consecutive days.
Average heart rates for the morning and afternoon sec-
tions of the shift were calculated to identify physical
fatigue developing through the shift.
Core body temperature measurement was also recorded at
the beginning and end of each shift using tympanic ther-
mometers with disposable probe shields, which were dis-
carded after each use.
Workplace monitoring of environmental conditions
In order to quantify the level of environmental heat stress,
the environmental conditions were monitored at the
workplace on 4 occasions (9 am, 12 md, 2 pm and 4 pm)
during each shift. A Calor Heat Stress meter was used to
determine wet (WB) and dry bulb temperature (DB),
black globe temperature (radiant heat), wind speed, and
barometric pressure and from these measurements calcu-
lations of mean radiant temperature, relative humidity,
WBGT and Thermal work limit (TWL) values were deter-
mined.
Statistics
Pearson's correlation was performed on all data sets.
Results
Table 1 summarises the average results over all groups for
each of the three days (1–3) of the study; Pearson correla-
tion coefficients between fluid consumption and both
urine SG and working heart rates are given in table 2.
Figures 1, 2, 3, 4, 5 show the breakdown by time of day for
subject variables and environmental conditions.
The environmental conditions were recorded on four
occasions per day. Table 3 shows mean and range for each
parameter over the nine days of the study and the WBGT
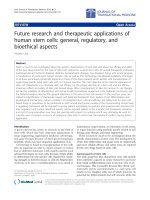
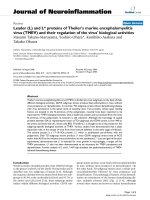
and TWL values computed from these. The environmental
stress as measured using the TWL, altered considerably
over the duration of the day (fig 1). The stress was lower
in the morning and late afternoon readings; whilst at mid-
day it was harsher as indicated by the lower TWL readings
on all 3 days. Despite this there were no significant differ-
ences in subject variables either within or between days,
and in fact TWL rarely fell below the limit for performance
of unrestricted work by self-paced workers (table 4). In
comparison WBGT values consistently exceeded 27.5°C,
the recommended limit for moderate work, especially
during the middle of the day [27].
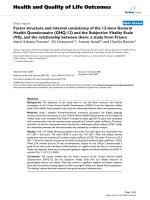
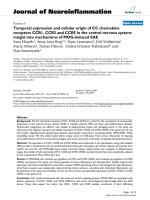
Figure 2 shows that the aural temperatures of the workers
(n = 22) were constant over the 3 days of the study, and as
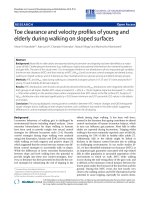
shown in figure 3, heart rates did not alter significantly
throughout the shift or from day to day, despite a signifi-
cant increase in environmental thermal stress, suggesting
that the workers were not being physically fatigued during
their shift.
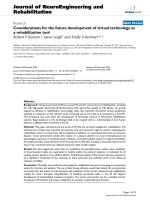
The hydration data (fig 4) demonstrate that the workers
commenced work well hydrated and maintained their
hydration status throughout the shift and from day 1 to
day 3 (n = 66).
The average fluid intake of workers (n = 22) was reasona-
bly consistent during the day and from day 1-day 3 (fig 5).
The constancy of working heart rate throughout the shift
and the absence of environmental influence is demon-
strated in (fig 6), a typical recording over a full shift, from
one of the workers. The lunchtime meal break is clearly
evident.
Discussion
Hydration
Maintaining body fluid levels whist working in a hot envi-
ronment is essential, not only for health and safety of the
worker, but in order to optimise performance and produc-
tivity.
Urine specific gravity is a measure of urine osmolarity and
is related to the hydration status of the subject. It is recog-
nized that false negatives can occur in persons consuming
large volumes of caffeinated beverages, however, it is a
very useful indicator for worksite screening of the hydra-
tion status of workers. Low readings are indicative of
appropriate fluid levels in the body. From previous work
on the hydration status of workers exposed to heat, a urine
SG below 1.020 at the commencement of a shift is opti-
mal to prevent hypohydration or dehydration further into
the shift. It has been reported that workers are unlikely to
Table 1: Average total fluid consumption, urine SG and working heart rate for each day of the study
Average Day 1 Day 2 Day 3
Fluid consumption (mL) 6001 ± 1396 5235 ± 1388 5044 ± 1133
Urine SG (mean of three samples per day) 1.011 ± 0.008 1.013 ± 0.007 1.013 ± 0.006
Heart rate (beats.min
-1
) 90.5 ± 8.1 90.0 ± 5.9 86.9 ± 6.5
Values are mean ± SD, n = 22 subjects
Journal of Occupational Medicine and Toxicology 2008, 3:21 />Page 6 of 10
(page number not for citation purposes)
improve their hydration status during work [2]. Thus it is
imperative that good hydration prior to the shift com-
mencement is achieved. The results of this study have
illustrated very good hydration prior to the commence-
ment of the shift, which is also maintained over the course
of the shift. Workers who begin well hydrated are likely to
maintain good levels of hydration during the shift.
Indeed, most participants in this study commenced work
in a euhydrated state, the average SG over the 3 days being
1.012 (fig 4).
This highlights the need for an active education program
promoting awareness about the importance of hydration
and offering practical advice to workers. Key components
of such a program would be discussion of the health,
safety and performance implications of adequate hydra-
tion, as well as information regarding what, when and
how much to drink. The average intake of hydrating fluids
per 12-hour shift was 5.44 litres (fig 5), which was ade-
quate, as SGs were maintained during the shift. Further-
more, the type and calorific content of any hydrating fluid
needs consideration, given that juice, cordial and other
sweet beverages are often more than 10% sugar. Caffein-
ated beverages such as tea, coffee, cola and energy drinks
may dehydrate rather than hydrate workers. Another fac-
tor that may have significant bearing on the hydration sta-
tus of these workers is cultural. Most reported no alcohol
consumption due to their religious beliefs. Maintenance
of an adequate hydration level maybe learnt, becoming in
effect a physiological 'set point', as some workers sus-
tained consistently lower SGs than others. (Interpretation
of urine specific gravity and associated hydration levels is
provided in table 5)
Fatigue
Fatigue is a complex process with physiological, psycho-
logical and sociological components and implications. A
major consequence of any type of fatigue is reduced pro-
ductivity due to diminished work efficiency. Fatigue also
increases the likelihood of workplace errors and accidents,
and as a consequence, is a significant concern in industrial
operations such as the construction and oil industry.
The primary objective of this study was to assess the phys-
iological stress associated with working for long periods
in a hot environment. The continuous heart rate monitor-
Table 2: Correlations between individual fluid consumption and average urine SG and heart rate
Variables (n = 22) Pearson correlation coefficient
Average fluid consumed
Average SG for 3 days
-0.519*
Average fluid consumed for 3 days
Average heart rate over 3 days
0.719**
*Significant at the 0.05 level (2-tailed)
**Significant at the 0.01 level (2-tailed)
Thermal Work Limit (TWL)Figure 1
Thermal Work Limit (TWL). The Thermal Work Limit
was recorded on four occasions per day, and averaged for
each of the three study days.
150
175
200
225
250
275
Day1 Day 2 Day 3
TWL (W.m
-2
)
8:00 AM midday 2:00 PM 4:00 PM
Aural Temperature am & pmFigure 2
Aural Temperature am & pm. Core temperature was
monitored by measurement of aural temperature twice daily.
Averages for each day of the study are shown.
35.0
35.5
36.0
36.5
37.0
Day 1Day 2Day 3
Aural Temperature (
o
C)
AM PM
Journal of Occupational Medicine and Toxicology 2008, 3:21 />Page 7 of 10
(page number not for citation purposes)
ing demonstrated no significant change in heart rate
between the morning and afternoon shift periods or from
day 1 to day 3, suggesting that workers are not fatiguing
over the duration of a shift (am vs pm) or from day to day
(fig 3). There may be two possible explanations for this;
either workers are not becoming fatigued, or they are self-
pacing, that is, slowing down to avoid over-exertion. The
latter seems most likely, and would appear to be the key
factor in avoiding heat related injury. Other work has
shown similar results [28]. The environment (thermal
stress) changes significantly over the course of the day (fig
1), however heart rates remain constant over the day and
from day to day. It is not fanciful to suggest that workers
if allowed to self-pace will alter work rate to maintain
their heart rate within a narrow range. These workers var-
ied in fitness level and experience; however they all
worked at a similar heart rate. It is recognized that the
number of subjects (n = 22) is not sufficient to conclude
that workers even in harsh conditions (DB temperature
reached 53°C on one occasion and was reaching the mid
to high 40's most days) will be safe if they are well
hydrated and allowed to self-pace, however it is good evi-
dence for promoting a more rigorous study using a far
greater number of workers.
The value of these findings may alter the current approach
to working in heat, which is to stop work when a single
environmental parameter reaches a threshold point or the
cessation of work during the hottest part of the day during
summer. These guidelines and legislative regimes are
unscientific and often cause more problems than they
solve (industrial disputes, as well as unnecessary produc-
tion costs and delays).
The relationship between heart rate and fluid consumed
(table 2) was positive (correlation coefficient 0.719). One
likely explanation was that those workers who worked
harder (higher heart rates) drank more fluid. An alternate
explanation may be that those that drink more fluid can
work harder. The latter explanation, if correct, would be of
significant interest to employers and may promote better
supply and availability of suitable fluid on work sites.
Average Heart RatesFigure 3
Average Heart Rates. Averages of the continuously
recorded heart rates for the morning and afternoon work
period of each of the three study days.
60
70
80
90
100
110
Day 1 Day 2 Day 3
Average Heart Rate (beats.min
-1
)
AM PM
Urine Specific GravityFigure 4
Urine Specific Gravity. Average specific gravity of urine
measured at the start and end of shift and during the lunch
break.
1.008
1.009
1.010
1.011
1.012
1.013
1.014
1.015
Day 1 Day 2 Day 3
Urine Specific Gravity
AM midday PM
Fluid ConsumptionFigure 5
Fluid Consumption. Volume of fluid consumed by workers
during the morning and afternoon for each of the three study
days.
0
500
1000
1500
2000
2500
3000
3500
Day 1 Day 2 Day 3
Fluid Consumption (mL)
AM PM
Journal of Occupational Medicine and Toxicology 2008, 3:21 />Page 8 of 10
(page number not for citation purposes)
The other significant correlation was between SG of urine
and average fluid consumed (table 2). As would be
expected those that drank more fluid had a lower SG thus
an inverse relationship (Pearson correlation -0.519). This
would endorse the validity of using SG as an indicator of
hydration. No other statistically significant correlations
were recorded.
Environmental Assessment
A risk assessment of the thermal environment at the con-
struction site was carried out over a 10-day period during
the month of June, using the Thermal Work Limit (TWL)
as a measure of heat stress. The workplace was assessed on
4 occasions daily to identify variation in thermal stress.
Though the average TWL for most work sites was above
the stop work level, i.e. above 115 W.m
-2
(table 4), on
occasions the risk of heat strain in certain working envi-
ronments did become substantial, reaching TWL levels as
low as120 W.m
-2
(DB temp > 50°C) however this was not
reflected in the heart rates for that specific time nor the
reporting of symptoms or deleterious effects on the work-
Table 5: Guidelines for interpretation of urine Specific Gravity
readings
SG Significance
< 1.015 Well Hydrated
1.015–1.020 Mildly Dehydrated
1.020–1.025 Moderately Dehydrated
1.025–1.030 Dehydrated
> 1.030 Clinically Dehydrated
Typical Heart Rate RecordingFigure 6
Typical Heart Rate Recording. Continuous heart rate
recording over a full shift, from one of the workers. The
lunchtime meal break is clearly evident.
Table 4: Recommended TWL limits and interventions for self-paced work
TWL Limit (W.m
-2
) Name of limit/zone Interventions
< 115 Withdrawal No ordinary work allowed
Work only allowed in a safety emergency or to rectify environmental conditions
115 to 140 Buffer zone Try to improve the working environment
No person to work alone
No unacclimatized person to work
> 140 Unrestricted
Table 3: Environmental conditions over the study period
Time DB
(°C)
WB
(°C)
GT
(°C)
WS
m.s
-1
WBGT
(°C)
TWL
W.m
-2
0800 37.9
(32.5–44.0)
21.3
(19.4–24.3)
44.8
(38.5–51.2)
1.4
(0.4–2.0)
26.8
(24–30.7)
237.7
(179–284)
1200 42.5
(40.1–48.2)
21.8
(18.4–24.9)
52.1
(56.5–49.2)
1.7
(0.8–3.1)
28.6
(26.9–30.8)
194.8
(151–225)
1400 44.7
(42.7–49)
20.6
(17.3–23.2)
51.8
(47.7–55.5)
2.0
(1.3–4.6)
27.8
(26.9–28.9)
189.3
(122–240)
1600 41.0
(32.9–46.6)
19.0
(16.4–22.3)
44.3
(33.9–53.1)
2.4
(0.3–6.2)
26.1
(24.5–27.9)
230.6
(187–279)
DB = dry bulb, WB = wet bulb, GT = globe temperature (radiant heat), WS = wind speed, WBGT = Wet Bulb Globe Temperature, TWL =
Thermal Work Limit
Values are mean (n = 9) and range (parentheses)
Journal of Occupational Medicine and Toxicology 2008, 3:21 />Page 9 of 10
(page number not for citation purposes)
ers. By comparison there were few days during the study
when risk assessment using WBGT would not have
required work to be shut down for at least part of the day.
This reinforces the proposition that self-pacing in the con-
struction industry is imperative if heat illness is to be
avoided. The other important point illustrated by this data
is the importance of good hydration of the workforce.
Conclusion
The data demonstrate that well hydrated self-paced work-
ers can work without adverse physiological effects under
conditions deemed too severe by the WBGT. It is now rec-
ognized that WBGT is too conservative and inappropriate
for practical use in industry. A more scientifically robust
index is urgently needed, especially in the hotter parts of
the globe where workers are performing manual tasks in
very harsh conditions. The debate as to what is a reasona-
ble environment in which people work, will become a
more and more pertinent question. A far greater push to
establish an index that will both protect workers yet not
punish industrial productivity is well overdue. TWL has
been published and validated in a controlled environ-
ment [28,29]. Introducing TWL as a practical measure of
heat stress in industrial settings where heat is an issue
would appear to be appropriate. It measures all needed
environmental parameters, takes into account clothing
and provides the metabolic rate (the output) that people
can sustain in a specific environment (in W.m
-2
).
Additional physiological testing of workers along with
environmental measurements need to be conducted in
order to further validate the recommended levels shown
in table 4, however to date the field testing undertaken in
this study and in the laboratory validation studies provide
very good evidence for it to be taken seriously as a inter-
national index that can be relied upon to be a sound inde-
pendent arbitrator for people working in harsh thermal
environments.
Competing interests
The authors declare that they have no competing interests.
Authors' contributions
JS conceived the study, which was designed by GB. Both
authors collected data. GB analysed the data and inter-
preted the results. Both authors drafted, edited and
approved the final manuscript.
Acknowledgements
Funding for the project was obtained from a seed grant provided by the
Faculty of Medicine and Health Science, United Arab Emirates University.
Dr Mohammed El-Sadiq (UAE University) assisted in identification and ini-
tial liaison with the site. Drs Amin Bakri Ahmed and Amin Mohammed Juma
assisted in data collection. Dr Veronica Miller (Curtin University) assisted
with preparation and analysis of the data and draft manuscript preparation
and revision.
References
1. Shapiro Y, Pandolf KB, Goldman RF: Predicting sweat loss
response to exercise, environment and clothing. Eur J Appl
Physiol 1982, 48:83-96.
2. Brake DJ, Bates GP: Fluid losses and hydration status of indus-
trial workers under thermal stress working extended shifts.
Occup Environ Med 2003, 60(2):90-96.
3. Maughan RJ, Leiper JB, Shirreffs SM: Restoration of fluid balance
after exercise-induced dehydration: effects of food and fluid
intake. Eur J Appl Physiol 1995, 73:317-325.
4. Wilson JR, Corlett EN: Evaluation of Human Work. Human
Response to Thermal Environments: Principles and Methods 1985:539.
5. Bittel J, Henane R: Comparison of thermal exchhanges in men
and women under neutral and hot conditions. J Physiol (Lond)
1975, 250:475-489.
6. Kenney WL, Tankersley CG, Newswanger DL, Hyde DE, Puhl SM,
Turner NL: Age and hypohydration independently influence
the peripheral vascular response to heat stress. J Appl Physiol
1990, 68(5):1902-8.
7. Sawka MN, Montain SJ: Fluid and electrolyte supplementation
for exercise heat stress. The American Journal Of Clinical Nutrition
2000, 72(2):564S-572S.
8. Cadarette BS, Sawka MN, Toner MM, Pandolf KB: Aerobic fitness
and the hypohydration response to exercise-heat stress.
Aviat Space Environ Med 1984, 55(6):507-12.
9. Marino FE, Kay D, Serwach N: Exercise time to fatigue and the
critical limiting temperature: effect of hydration. Journal of
Thermal Biology 2004, 29(1):21-29.
10. Gonzalez-Alonso J, Teller C, Andersen SL, Jensen FB, Hyldig T,
Nielsen B: Influence of body temperature on the development
of fatigue during prolonged exercise in the heat. J Appl Physiol
1999, 86(3):1032-1039.
11. Sawka MN, Pandolf KB: Effects of Body Water Loss on Physio-
logical Function and Exercise Performance. In Perspectives in
Exercise Science and Sports Medicine: Fluid Homeostasis During Exercise
Volume 3. Edited by: Gisolfi C, Lamb D. Carmel: Cooper Publishing
Group; 1990:1-38.
12. Bates G, Matthew B: A new approach to measure heat stress in
the workplace.
Aust Inst of Occ Hyg 15th Ann Conf; Perth 1996. 1996
30 Nov-4 Dec
13. Bruck K, Olchewski H: Body temperature related factors
diminishing the drive to exercise. Can J Physiol Pharmacol 1987,
65:1274-1280.
14. Gopinathan PM, Pichan G, Sharma VM: Role of dehydration in
heat stress-induced variations in mental performance. Arch
Environ Health 1988, 43(1):15-7.
15. Kenefick RW, Hazzard MP, Armstrong LE: Minor Heat Illnesses.
In Exertional Heat illnesses Human Kinetics Publishers Inc. USA; 2003.
16. Donoghue A, Sinclair M, Bates G: Heat exhaustion in a deep
underground metalliferous mine. Occup Environ Med 2000,
57:165-174.
17. Michaud D, Spiegelman K, Clinton S, Rimm E, Curhan G, Willett W,
et al.: Fluid intake and risk of bladder cancer in men. New Eng-
land Journal of Medicine 1999, 340:1390-1397.
18. Rodgers SH: Ergonomic Design for People at Work. USA: John
Wiley & Sons Inc; 1986.
19. WHO: Health factors in Workers Under Conditions of Heat Stress, Tech-
nical Report Series 412 Geneva: WHO; 1969.
20. ISO: ISO9886: Evaluation of Thermal Strain by Physiological Measure-
ments International Organisation for Standardisation.
21. Evans WJ, Winsmann FR, Pandolf KB, Goldman RF: Self-paced hard
work comparing men and women. Ergonomics 1980,
23:613-621.
22. Goldman RF: Standards for human exposure to heat. In Environ-
mental Ergonomics – Sustaining Human Performance in Harsh Environ-
ments Edited by: Mekjavic IB, Banister EW, Morrison JB. London:
Taylor and Francis; 1988:99-129.
23. Bernard TE, Kenney WL: Rationale for a personal monitor for
heat strain. Am Ind Hyg Assoc J 1994, 55(505–514):.
24. Rodahl K: The Physiology of Work. London: Taylor and Francis
Ltd; 1989.
Publish with BioMed Central and every
scientist can read your work free of charge
"BioMed Central will be the most significant development for
disseminating the results of biomedical research in our lifetime."
Sir Paul Nurse, Cancer Research UK
Your research papers will be:
available free of charge to the entire biomedical community
peer reviewed and published immediately upon acceptance
cited in PubMed and archived on PubMed Central
yours — you keep the copyright
Submit your manuscript here:
/>BioMedcentral
Journal of Occupational Medicine and Toxicology 2008, 3:21 />Page 10 of 10
(page number not for citation purposes)
25. Parsons KC: Human Thermal Environments London: Taylor and Francis
Ltd; 1993:104.
26. Brake DJ, Bates GP: Limiting metabolic rate (thermal work
limit) as an index of thermal stress. Appl Occup Environ Hyg 2002,
17(3):176-186.
27. ACGIH: Heat Stress. In TLVs and BEIs: Threshold Limit Values for
Chemical Substances and Chemical Agents Cincinnati: ACGIH; 2006.
28. Miller V, Bates G: The Thermal Work Limit is a simple reliable
heat index for the protection of workers in thermally stress-
ful environments. Ann Occup Hyg 2007, 51(6):553-561.
29. Bates G, Miller V: Empirical validation of a new heat stress
index. The Journal of Occupational Health and Safety-Australia and New
Zealand 2002, 18(2):145-153.