Evapotranspiration covers for landfills and waste sites - Chapter 10 docx
Bạn đang xem bản rút gọn của tài liệu. Xem và tải ngay bản đầy đủ của tài liệu tại đây (991.4 KB, 22 trang )
133
10
Design Components
This chapter covers several design components that are pertinent to evapo-
transpiration (ET) landll cover design.
10.1 WEATHER
Basic weather records may contain daily or hourly measurements of total precipita-
tion, and maximum and minimum air temperatures. Records that are more complete
include daily or hourly measurements of precipitation, air temperature, dew point,
wind run, and total solar radiation. Daily values of weather parameters are adequate
for ET landll cover design.
10.1.1 Pr e c I P I tat I o n
The most basic, and perhaps the most important, input data used in design or evalua-
tion of an ET landll cover is the precipitation record for the site. Precipitation input
data is more important to ET cover design than to conventional cover design because
water balance estimates indicate probable success or failure for the ET cover. An
error in precipitation estimate is less important to conventional-barrier cover design
because the barrier is assumed impermeable and the drainage layer above the barrier
is designed to remove all water that percolates through the cover soil. However, the
accuracy of the precipitation data used limits the accuracy of ET cover performance
estimates.
The only choice available to the designer is to use the longest and most accu-
rate precipitation record available. Because it is difcult to assess the accuracy of
precipitation data for a given site, the common practice is to accept records of the
U.S. Weather Bureau, U.S. Department of Agriculture (USDA) or state agricultural
experiment stations, and similar trustworthy sources. An understanding of possible
accuracy of precipitation data provides insight into possible accuracy of performance
estimates (see Chapter 6).
10.1.2 So l a r ra d I a t I o n
Solar radiation measurements are generally available for a shorter time than other
measurements because instruments sufciently accurate and robust for routine mea-
surements were unavailable until recently. Solar radiation at the top of the earth’s
atmosphere is relatively constant from year to year. It varies seasonally as the earth
rotates around the sun and the earth’s axis tilts relative to the sun. Clouds, thickness
of the atmosphere as affected by land surface altitude, pollution, and other factors
reduce the radiation falling on the earth’s surface at a specic site. However, solar
© 2009 by Taylor & Francis Group, LLC
134 Evapotranspiration Covers for Landfills and Waste Sites
radiation at a particular site on days with little or no cloud cover is relatively predict-
able from year to year. As a result, the variability of solar radiation at a site is less
than for other weather parameters. Therefore, a relatively short record of solar radia-
tion provides an adequate basis for stochastic estimates of future solar radiation.
This situation is fortunate for the design engineer because, in any case, the engineer
must use available data.
10.1.3 le n g t h o f We a t h e r re c o r d
An adequate measurement of the climate at a site utilizes the longest available
weather record; it should contain measurements for at least 30 years. Annual pre-
cipitation records from Coshocton, Ohio, illustrate the importance of long climatic
records. The 35 year average annual precipitation is 940 mm (37 in.); one 5-year
period averaged 88% of the overall average, and another averaged 115%. A short
record is unlikely to provide accurate estimates of average values or daily statistical
variability of the measurements.
10.1.4 We a t h e r re c o r d un c e r t a I n t y
Daily weather measurements are a sample of the long-term climate. Existing weather
records do not contain all of the extreme events that are possible for a site; but
extreme events are important to estimates of possible future performance of an ET
landll cover.
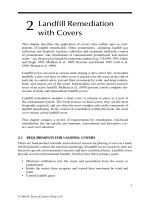
Weather records of at least 50 years duration usually estimate the mean val-
ues relatively well, but may not include extreme events that are important to ET
cover design. Figure 10.1 illustrates the effect of the length of weather records on
the size of extreme precipitation events. The annual precipitation amounts found in
a 100 year precipitation record are compared with a 50 year subset of the record for
a site in southeastern Oklahoma. Although the mean values are similar, the maxi-
mum annual rainfall in the 50 year record (1880 mm) is about 15% less than the
maximum for the 100 year record.
0
500
1000
1500
2000
2500
0.0 0.2 0.4 0.6 0.8 1.0
Probability
mm
100-year record
Annual mean=1239 mm
Standard deviation=240 mm
100-year record
50-year record
FIGURE 10.1 Extreme events found in 50 and 100 year annual precipitation amounts for
southeastern Oklahoma.
© 2009 by Taylor & Francis Group, LLC
Design Components 135
There is uncertainty in all of the other parameters measured and recorded in
weather records. The design of an ET landll cover should include estimates of the
effect of future extreme events and variability because the cover should function for
decades or centuries longer than existing weather records.
10.1.5 fu t u r e We a t h e r
We expect the cover to control precipitation under the inuence of future weather;
therefore, both preliminary and nal design should be based on reliable estimates
of future weather. Sequences of recorded weather events are unlikely to repeat, and
future extreme events may be greater than recorded measurements. Because future
weather is unknown, a suitable alternative is the use of a statistically based estimate
of future weather and its variability.
The statistical properties of available weather records may be used to make a
reasonable estimate of future weather variability. Annual precipitation records for
Stapleton Airport, Denver, Colorado, provide an example; measured precipitation
data for 45 years are available for that site. The Environmental Policy Integrated
Climate (EPIC) model utilized weather statistics for the site and stochastic processes
to generate precipitation and other weather parameters for a period of 100 years.
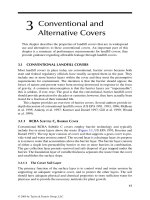
Figure 10.2 shows the measured annual precipitation amounts for 45 years and
each of the 100 years of annual precipitation stochastically generated by the EPIC
model. The generated precipitation follows the measured amounts closely, except for
extreme events. The mean of the generated data is less than 1% different from the
mean of the measurements.
Extreme events are important to ET landll cover design. The generated maxi-
mum value of annual precipitation for Stapleton Airport is 18% larger than the mea-
sured maximum value (Figure 10.2). The use of generated weather data extending
over 100 years or more provide a basis for a conservative yet realistic estimate of
future ET landll cover performance because it generates future extreme events
from statistical parameters derived from measurements at the site or appropriate
nearby sites.
0
100
200
300
400
500
600
700
800
Probability
mm
Measured
EPIC
0.0 0.2 0.4 0.6 0.8 1.0
FIGURE 10.2 Measured annual precipitation compared to stochastic estimates by the EPIC
model for Stapleton Airport, Denver, Colorado.
© 2009 by Taylor & Francis Group, LLC
136 Evapotranspiration Covers for Landfills and Waste Sites
10.2 SOIL
The accuracy of soil properties used in design and construction can determine suc-
cess or failure for an ET landll cover. Soils vary from site to site; indeed, they may
vary signicantly within a borrow pit. The book series by the Soil Science Society
of America, referenced in Appendix A, provides useful and practical descriptions of
soil properties that are important to ET landll cover design and evaluation.
10.2.1 na t u r a l So I l S
Most soils contain layers; they may be thick or thin, and the number of layers varies
greatly. Generally, the layers are parallel to the surface because the weathering and
other forces that create soils originate at the surface. Soil may form on relatively
recent wind or water deposits, and/or ancient geologic materials. It is the biologically
active layer found above parent material, and its thickness may vary from a few cen-
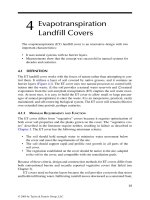
timeters to several meters. Figure 10.3 is a photograph of a soil prole. The elevated
soil organic matter created the dark color of the upper layer, suggesting that this soil
formed in a moist, cool climate. The properties of soil layers may differ signicantly
over vertical distances of a few millimeters; yet some soils contain uniform soil lay-
ers that are meters thick.
FIGURE 10.3 Typical soil prole. (Photo courtesy of USDA, Agricultural Research Service.)
© 2009 by Taylor & Francis Group, LLC
Design Components 137
10.2.2 So I l de S c r I P t I o n S
Soil properties should be described by measures important to plant growth because
the ET cover relies on plants to remove water from the cover soil. The USDA devel-
oped widely used and accepted descriptions of soil properties; the focus of their work
is plant growth. Other soil descriptive systems exist; those focused on plant growth
are similar to the USDA system. Some soil descriptive systems focus on the use of
soil as a construction material and not on plant growth; although useful for construc-
tion, they have limited use in plant growth endeavors. The USDA soil descriptive
system is pertinent to ET cover design.
One of the most important soil descriptors is particle size distribution. The USDA
denes soil as material less than 2 mm in size (#10 ASTM sieve) and soil particle
sizes for soil separates as follows (SSSA 1997; Gee and Or 2002):
Clay: <0.002 mm•
Silt: 0.05–0.002 mm•
Sand: 2.0–0.05 mm•
They also dene material larger than 2 mm as gravel, coarse sand, or rocks. These
large particles add little or nothing to the productive properties of the soil, and they
reduce its water-holding capacity in proportion to the volume that they occupy. When
coarse materials are included in the ET cover soil, the water-holding and other soil
properties need adjustment.
The surface area of soil particles exerts major control over soil properties that are
important to plant growth, including water-holding properties, ion exchange, micro-
bial attachment, heat transfer, soil aggregation, and contaminant adsorption. The
specic surface area of soil materials is the surface area per unit of soil mass,
expressed as square meters per kilogram. The total surface area includes the area
on the surface of clay lattice layers within clay minerals. The specic surface area is
large for clay particles and organic matter but diminishingly small for sand particles.
Pennell (2002) summarized measurements of total specic surface measured by the
EG/EGME method (Table 10.1). The specic surface area of soil is important; soil
with large specic surface area holds and recycles large amounts of plant nutrients
and tends to have large plant-available water-holding capacity.
In the absence of specic surface measurements on a particular soil, an impor-
tant parameter is the amount and kind of clay contained in the soil mass. The kind
and amount of clay contained in soil indicates plant nutrient storage capacity and
strongly inuences soil water-holding properties.
10.2.3 So I l de S I g n da t a
Usually, ET cover soil will be a mixture of natural soil layers and may include sub-
soil. The following discussion provides a framework for evaluating soils.
The rst steps in a preliminary design include an inventory of soils found near
the site and available for use in the cover. The designer needs an estimate of soil
© 2009 by Taylor & Francis Group, LLC
138 Evapotranspiration Covers for Landfills and Waste Sites
properties, volume available, distance from the site, and cost for acquisition and
hauling to the site. The preliminary design produces an estimate of the performance
of a cover utilizing available soil and determines whether it is appropriate to continue
with the design of an ET cover for the site. After preliminary design demonstrates
that an ET cover is appropriate for the site, the next step is a complete, site-specic
soil evaluation.
Descriptions that are suitable for initial analysis of soils found near the site are
usually available within ofcial soil surveys of the U.S. Department of Agriculture,
Natural Resource Conservation Service (USDA/NRCS). USDA soil surveys are
available for most counties in the United States; they are available without cost from
county or state ofces and on the NRCS soil Web site (NCSS 2006; USDA, NRCS
2006). The Land Grant Universities are also a source of soil data for their respec-
tive states. The USDA/NRCS soil surveys include aerial photos of each county with
individual soil units delineated and marked for reference to the data contained in
their tables. The user should collect information about soils that are available within
a reasonable haul distance of the landll site.
10.2.3.1 Preliminary Soil Data
The following discussion illustrates the use of soil data during preliminary design.
Table 10.2 contains eld data, summary, and estimates for cover soil. The survey
data came from a preliminary soil survey for a site on the western edge of the central
Great Plains. The eld data contain the raw data. The summary in Table 10.2 con-
tains the user summary of the raw data, and the estimates for cover soil contain soil
data prepared for use in a preliminary cover design.
The preliminary eld samples contained only clay content and soil sieve results
covering the silt and sand particle ranges (Table 10.2). The material held on the
TABLE 10.1
Total Specific Surface Area of Selected Materials
by the EG/EGME Method and the Ratio with Silica
Soil Sample
Organic C Content
g/kg
Total Specific Surface Area
m
2
/kg Ratio
Silica 0.1 8,700 1
Aquifer material 0.1 10,500 1
Boston silt 26.6 46,000 5
Kaolinite clay 0.1 21,300 2
Montmorillonite clay 0.2 733,000 84
Webster soil 33.2 168,400 19
Houghton muck 445.7 162,900 19
Source: Pennell, K. D. (2002). Specic surface area. In Methods of Soil Analy-
sis: Physical Methods, Part 4, Dane, J. H. and Topp, G. C. (Eds.). Soil
Science Society of America, Madison, WI, pp. 295–315.
© 2009 by Taylor & Francis Group, LLC
Design Components 139
TABLE 10.2
Soil Data from Preliminary Field Samples from West-
Central Great Plains
Field Data
Depth (cm) 0–8 8–38 38–150
USDA Class Loam Loam Loam
Clay, % 15–27 18–35 18–27
% pass #200 sieve
a
50–70 55–70 50–65
% pass #10 sieve
b
95–100 95–100 95–100
% pass #4 sieve 95–100 100 100
Bulk density, Mg/m
3
1.25–1.35 1.3–1.4 1.3–1.4
K, cm/h 1.5–5 1.5–5 1.5–5
AWC
c
, cm/cm 0.15–0.18 0.16–0.19 0.15–0.17
pH 6.6–7.8 7.4–7.8 7.4–8.4
Soil organic matter, % 2–4 1–3 0.5–1
CEC
d
, meq/100 g 9–16 11–25 10–16
CaCO
3
, % — — 3–5
Salinity, mmhos/cm — 0–2 0–2
Summary
Depth (cm) 0–8 8–38 38–150
Gravel/rock
e
, % 2.5 2.5 2.5
Sand, % 40 38 43
Silt, % 39 36 35
Clay, % 21 26 22
Bulk density, Mg/m
3
1.3 1.4 1.4
AWC
c
, cm/cm 0.16 0.17 0.16
pH 7.0 7.6 7.6
Soil organic matter, % 3 2 0.8
CEC
d
, meq/100 g 12 18 13
Estimates for Cover Soil
Gravel/rock
e
, % 2.5 Wilting point, cm/cm 0.16
Sand (2.0–.05 mm)% 42 Field capacity, cm/cm 0.32
Silt (.05–.002 mm)% 35 CEC
b
, meq/100 g 14
Clay (<.002 mm)% 23 pH 7.6
Bulk density, Mg/m
3
1.4 Soil organic matter, % 1.1
a
Soil passing #200 sieve includes clay, silt, and part of very ne sand.
b
Soil passing the #10 sieve (2 mm opening) includes clay, silt, and sand;
coarse sand, gravel, and rock held on this sieve are not included in the
soil.
c
AWC = available water holding capacity, cm/cm.
d
CEC = cation exchange capacity, meq/100 g.
e
Gravel/rock = coarse sand, gravel, and rocks >2 mm in size, not soil
material.
© 2009 by Taylor & Francis Group, LLC
140 Evapotranspiration Covers for Landfills and Waste Sites
ASTM #10 sieve (0–5%) denes the gravel/rock content of the soil material. Soil
passing the ASTM #200 sieve provides an approximation to the total clay and silt
in the soil. The difference between soil passing the #200 sieve and the clay per-
centage approximates the soil’s silt content. Because sand, silt, and clay should be
100% of the soil, the sand content was estimated by difference. The data presented
demonstrate a substantial range of properties; the range of properties was taken into
account when estimating soil properties for the summary section of Table 10.2.
The data in the estimates for cover soil are depth-weighted averages of the num-
bers in the summary (Table 10.2). The eld data did not contain eld capacity and
wilting point measurements; the EPIC model estimated them. An independent evalu-
ation by the hydraulic properties calculator produced slightly smaller water-holding
capacity values (Saxton 2005; Saxton and Rawls 2005).
10.2.3.2 Final Soil Data
After making the decision to proceed with ET cover design and construction, the
user should sample and evaluate the soil in the proposed borrow source. Sample suf-
cient sites and soil layers to describe the soil variability and evaluate possible soil
mixtures.
10.3 PLANT PROPERTIES
Several plant properties control the function of an ET landll cover. Important plant
properties include biomass–energy ratio (conversion of solar energy to biomass), opti-
mal and minimum temperature for growth, maximum potential leaf area index, leaf
area development curve, maximum stomatal conductance, critical soil aeration, and
maximum root depth.
During both preliminary and nal design, one should use accurate plant descrip-
tions. Fortunately, plant properties within a species and variety remain constant, for
practical purposes. The EPIC model contains a ready reference of plant properties
for many grasses, cultivated and native plants, and for some trees. The plants
described grow in hot, cold, wet, and dry climates within the United States.
10.4 INTERACTION OF PLANTS, SOIL, AND CLIMATE
Interactions between plants, soil, and climate are important to evaluation of ET land-
ll covers and should be included in models used for design. Examples of interac-
tions include:
Bright sunlight, high air temperature, low dew point, and wind may com-•
bine to cause plants to use large amounts of water at the potential ET rate
when the soil is wet. If the soil is partially dried, the plants may extract
much less than the potential ET amount from the soil, causing them to wilt
and produce less biomass.
Bright sunlight combined with low air temperature and high dew point may •
result in little water demand and no plant wilting even when the soil is
relatively dry.
© 2009 by Taylor & Francis Group, LLC
Design Components 141
Low soil pH may cause excessive aluminum to become available in the soil •
solution and reduce plant growth or kill the plant.
High soil density or dry soil may limit root growth, which in turn limits •
water extraction from the soil.
Low air temperature may reduce evaporation potential, biomass produc-•
tion, and root growth rate, and thus inuence water use.
Clouds, high dew point, and rain may signicantly reduce daily plant •
water use.
10.5 CRITICAL DESIGN EVENT
Where minimum percolation is an important goal for the cover, critical events
expected during the life of the cover are important considerations during design and
evaluation. The critical design event is that event or series of events which results in
the greatest soil water storage requirement during the expected life of the cover. Criti-
cal events may result from a single-day storm, a multiple-day storm, or other causes.
In a normal design, some deep percolation is expected, and a careful evaluation
of the critical events is a valuable addition to ET cover assessment. In extreme cases,
the requirements for the cover may allow no deep percolation; in that event, the criti-
cal design event denes whether the cover is adequate.
The two examples that follow resulted from designs at Cheyenne, Wyoming,
and at an eastern suburb of Denver, Colorado. Both sites are on the dry western edge
of the semiarid Great Plains, and have good quality soils with high water-holding
capacity available for the cover. An ET cover adequate to control inltration was
too thin to isolate the waste. Therefore, the requirement that the ET cover isolate the
waste and prevent its movement determined the cover thickness; they were thicker
than needed to control inltration.
At Cheyenne, an adequate ET cover soil was 0.6 m thick, and composed of soil
with high water-holding capacity. The plant cover included several native cool-sea-
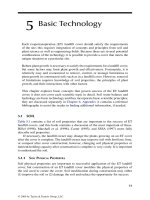
son grasses; they grow rapidly and use much water during the spring. Figure 10.4
Precipitation
0
50
100
150
200
mm
April May
Available Storage
Soil water
Field Capacity
FIGURE 10.4 Estimated daily values of precipitation, water content of the cover soil, and
critical event for Cheyenne, Wyoming.
© 2009 by Taylor & Francis Group, LLC
142 Evapotranspiration Covers for Landfills and Waste Sites
presents estimates of daily rainfall and soil water content during 2 months from the
wettest year of a 100 year simulation; this period includes the greatest daily stor-
age of soil water during the 100-year period. In this example, the critical event was
the result of several days with rainfall followed by a large single-day rainfall event.
The native grasses maintained the soil water content near the wilting point during
April, until 2 days of rainfall wetted the prole in early May. Between May 8 and 15,
the soil water content decreased rapidly, and by June 1 it dropped to near the wilting
point, because during May evaporative demand is high and the native cool-season
grasses grow rapidly. The soil water content resulting from this most critical event
from a 100-year estimate was less than the eld capacity for the soil and predicted
no deep percolation.
At the Denver site, an adequate ET cover soil was 0.5 m thick, and it had high
water-holding capacity. The plant cover was cool-season grasses, which grow rap-
idly and use much water during the springtime and early summer. Figure 10.5 pres-
ents the estimates of daily rainfall and soil water content for year 9 of a 25-year
design period; it includes the extreme event. The average precipitation during the
25-year period was 399 mm, and the largest annual value was 976 mm in year 6.
However, the critical event occurred during year 9, a year with annual rainfall only
72% of the highest annual value. The critical event occurred during mid-October,
a month with relatively low rainfall; however, the plant cover was beginning a new
growth cycle, and evaporative demand was relatively low. The soil water content was
below the wilting point before the large rain in June, and remained near the wilting
point throughout the remainder of the month. Much larger daily rain events and
greater total monthly rainfall fell in June than in October. June began with dry soil;
plant growth was robust, and evaporative demand was relatively high. These factors
combined to keep the soil water content below or near the soil’s wilting point dur-
ing June. The critical event did not ll the water storage capacity in the soil cover;
therefore, the cover selected was adequate for the site. The requirement that the cover
isolates the waste and controls its movement by wind and water governed the selec-
tion of cover thickness.
0
50
100
150
mm
Jul Aug
June
Field Capacity
Sep
Oct Nov
Precipitation
Soil water
FIGURE 10.5 Estimated daily values of precipitation, water content of the cover soil, and
critical event for an eastern suburb of Denver.
© 2009 by Taylor & Francis Group, LLC
Design Components 143
10.6 LAYERED ET COVER SOILS
The simplest ET cover contains a single soil layer with uniform properties. How-
ever, where precipitation is high, air temperatures are low, soil resources have low
water-holding capacity, or for other reasons, a uniform soil may allow excessive deep
percolation through a landll cover. It is possible to increase the fraction of precipita-
tion that leaves the site as surface runoff, thus reducing the required size of the soil
water reservoir.
Most natural soils contain layers with differing properties. Limiting layers with
low hydraulic conductivity dominate and control surface runoff, a major part of the
water balance. Soil descriptions are the basis for the USDA Soil Conservation Ser-
vice (SCS) curve number method; they are shown in Table 10.3 (ASCE 1996). The
properties of the least permeable soil layer near the surface control the assignment
of a curve number (CN) to a natural soil. Soil surveyors assign CNs by evaluat-
ing measured soil inltration rates, soil texture, and structure. The USDA, NRCS
assigned SCS curve numbers to most named soil series within the continental United
States. For purposes of ET cover design, the texture and measured values of satu-
rated hydraulic conductivity may be used to establish CN for ET cover design.
For example, if the soil available at the site is permeable and falls in or between
soil groups B and C, the addition of a layer of clay soil from soil group D near the
surface will increase surface runoff (Table 10.3). The clay layer should have a low
inltration rate to limit the amount of water entering the soil prole. It is important
that roots grow profusely within and through each layer, including the clay, and have
potential to extend to the full depth of the cover soil. Therefore, the clay layer should
not reduce root growth and should allow adequate oxygen exchange between the
surface and lower soil layers. Placing the clay with soil density equal to or less than
1.4 Mg/m
3
should assure that the cover soil satises site needs.
TABLE 10.3
Final (or Minimum) Infiltration Rates after Prolonged
Wetting That Govern the Soil Classification for Selecting
SCS Curve Numbers
Soil Group
Final Infiltration Rate
(cm/h)
Expected
Runoff Typical Soil Texture
A 0.8–1.1 Near zero Sand
B 0.4–0.8 Small Silt loam or loam
C 0.1–0.4 Large Layered sandy clay loam
D 0–0.1 Very large Clay or hardpan layers
Source: ASCE. (1996). Hydrology Handbook, 2nd edition. Manual 28 (Chapter 3,
pp. 98–100). American Society of Civil Engineers, Reston, VA.
© 2009 by Taylor & Francis Group, LLC
144 Evapotranspiration Covers for Landfills and Waste Sites
10.7 SOIL EROSION
Technology developed to control soil erosion on clean tilled agricultural land or a
bare construction site is sometimes mistakenly applied to landll covers. A cover
of grass or other native vegetation growing on an optimized ET landll soil cover
reduces soil erosion to near zero amounts.
Soil erosion by both wind and water action are widely recognized as serious
threats to humanity (USDA 1938; Bennett et al. 1951; Follett and Stewart 1985).
Continuous clean tillage to produce crops without measures in place to control soil
erosion is the primary cause of the threat posed by erosion. Other activities such as
road and building construction may cause serious erosion.
Indeed, several civilizations fell during the past 7000 years because the citi-
zens did not conserve their soil resources over centuries of use (Lowdermilk 1953).
Figure 10.6 illustrates the potential effect of soil erosion by water, and Figure 10.7
illustrates the potential effect of wind erosion; both situations resulted from poor
land management and clean tillage for crop production in the United States.
Modern farm production practices keep plant residue on the soil surface and
utilize other practices to control soil erosion; as a result, soil erosion on farms has
been substantially reduced. Geologic erosion that occurs under natural systems of
grassland or forest on stable slopes or at land is generally equal to or less than the
rate of new soil formation and thus not a threat to humanity. Figure 10.8 illustrates a
natural grassland system similar to an ET landll cover; it should produce near zero
amounts of soil erosion.
Soil erosion rate may be high for a short time during plant establishment and
therefore deserves attention for an ET landll cover. Experience demonstrates that
some erosion during grass establishment is not serious because of the short time
involved. Good management during plant establishment can minimize erosion risk.
Accordingly, the following discussion covers soil erosion concepts that are important
FIGURE 10.6 Water erosion caused by clean tillage for crop production in the humid south-
eastern United States. (Photo courtesy of USDA, Natural Resources Conservation Service.)
© 2009 by Taylor & Francis Group, LLC
Design Components 145
FIGURE 10.7 Wind erosion caused by clean tillage for crop production in the Great Plains
of the United States. (Photo courtesy of USDA, Natural Resources Conservation Service.)
FIGURE 10.8 A natural grassland system—soil erosion is near zero. (Photo courtesy of
USDA, Natural Resources Conservation Service.)
© 2009 by Taylor & Francis Group, LLC
146 Evapotranspiration Covers for Landfills and Waste Sites
to an understanding of the principles of soil erosion control, and to ET landll cover
design, construction, and maintenance.
10.7.1 Wa t e r er o S I o n
Water erosion is the detachment of soil particles from the soil mass by raindrops
and owing water, and their transport by rainfall runoff. Soil movement is often
intermittent, with detachment, transport, and deposition recurring repeatedly as the
soil moves through a watershed system. On bare soil, both raindrop impact and shear
from owing runoff are major forces causing soil detachment. Factors that affect soil
erosion by water include rainfall energy, soil erodibility, slope length, slope steep-
ness, plant cover, and erosion control practices (Smith and Wischmeier 1962).
Several trillion raindrops annually bombard each hectare of land in the humid
United States at impact velocities up to 9 m/s. The erosive power of rainfall results
from the energy dissipated upon raindrop impact. Vegetation absorbs raindrop
energy and reduces the velocity of surface runoff; therefore, surfaces covered by
robust grass cover suffer little or no erosion.
Surface runoff causes soil erosion on bare land surfaces where runoff concen-
trates, and the critical tractive force of the owing water exceeds the limit for the
existing soil conditions. On bare soils, the rills that result from soil erosion are much
more apparent than the sheet erosion between the rills, although the total erosion by
each on a watershed basis may be similar.
10.7.2 WI n d er o S I o n
Wind erosion is the detachment, movement, and abrasion of soil by wind. It begins
when the pressure of the wind against the surface soil grains overcomes the force
of gravity on the grains. Wind moves soil grains along the surface of the ground in
a series of jumps known as saltation. The concentration of saltating soil grains
in the air increases downwind until it reaches the maximum that the wind can sus-
tain. The saltating grains collide with objects in their path and cause disintegration of
any material that is soft enough to erode. Wind erosion occurs only when soil grains
capable of being moved in saltation by the velocity of the wind are present in the soil,
and only dry soil particles are moved by the wind (Chepil 1958; Chepil and Wood-
ruff 1963). Fryrear and Randel (1972) state, “The wind velocity must exceed 4.5 m/s
(10 miles per hour) before most bare erodible soil surfaces will start to erode.”
Woodruff and Siddoway (1965) developed a wind erosion equation that summa-
rizes the important variables affecting wind erosion. They found that wind erosion
amount is a function of soil erodibility index, surface roughness, climatic factor, eld
length in the direction of the wind, and the quantity of vegetative cover.
10.7.3 er o S I o n a t ar I d SI t e S
At some arid sites, wind and water erosion are long-term erosion threats because
there is insufcient rainfall to produce a sufciently dense vegetative cover to protect
the soil on a landll cover. Gravel added to the top soil layer may adequately control
both wind and water erosion. Erosion exposes a stone pavement between plants that
mimics stable desert pavement and that can effectively control soil erosion (Waugh
© 2009 by Taylor & Francis Group, LLC
Design Components 147
et al. 1994). The addition of stones to the upper soil layer causes inltration from
small showers to move a few centimeters deeper into the soil prole than for soil with
no stones; this action may signicantly improve growing conditions for the grass
cover under dry conditions.
10.7.4 So I l er o S I o n co m P a r I S o n S
Given the importance of the soil erosion issue, it is important to understand the
degree of risk posed by erosion of ET landll covers. This section contains erosion
and soil productivity estimates by the EPIC model; the estimates were for two sites
and two cover conditions.
Modern erosion control technology was developed for production agriculture in
response to the concerns expressed previously. Common cultivated crops are annu-
als, and the soil is often tilled for weed control and soil loosening between harvest
and planting of the next crop. The fallow period may last for 1–15 months depending
on the local weather and the crops grown. The soil surface may be bare for several
months. Soil erosion potential is high when the soil is bare and during the establish-
ment phase of the new crop.
Erosion estimates were calculated for Idabel and Goodwell, Oklahoma; they are
located in southeastern Oklahoma and in the Oklahoma panhandle, respectively. The
climate at Idabel is wet, and the erosive potential of the rainfall is high, but the wind
erosion hazard is low. The climate at Goodwell is semiarid, the erosive potential of
the rainfall is moderate to low, but the wind erosion hazard is high (Wischmeier and
Smith 1978; Woodruff and Siddoway 1965).
The soil used in the simulation was a mixture of a fertile soil prole with good
water-holding and plant nutrient capacity, and has moderate-to-low water and wind
erosion potential. The estimates by EPIC included a 5 year initialization run to set
soil water content, plant parameters, plant biomass, plant residue, and other calculated
variables used as the beginning point for the 100 year estimates described herein.
The plant covers tested were perennial grass cover, native to each site, and winter
wheat. Winter wheat is a common crop at both sites. At Idabel, the grass cover was
switchgrass, and at Goodwell, it was a mixture of short range grasses. Tillage dur-
ing fallow after wheat harvest included offset disk harrow for primary tillage after
harvest. As a reference point for evaluating the results, Figures
10.9, 10.10, and 10.11
show soil loss that is tolerable for sustained crop production for both thin and thick
soils (Wischmeier and Smith 1978).
Figure 10.9 compares estimates for water, wind, and total erosion for winter
wheat with different land slopes at Goodwell; the slope length was 152 m. Water ero-
sion rate was low, as expected. Wind erosion dominates the total erosion estimate.
Water erosion increases rapidly with increasing land slope. Figure 10.10 shows
the estimates of total erosion from both winter wheat and grass at Idabel and
Goodwell. Because almost all of the erosion at Idabel resulted from water erosion,
there is a substantial increase in the erosion amount from winter wheat with increas-
ing land slope. All land slopes greater than 2% exceeded the tolerable soil loss under
winter wheat culture. There was no signicant soil erosion at either site under native
grass at any land slope.
© 2009 by Taylor & Francis Group, LLC
148 Evapotranspiration Covers for Landfills and Waste Sites
For cultivated and tilled land, slope length has a signicant effect on poten-
tial soil erosion by water; the eld width in the direction of the wind affects wind
erosion. Figure 10.11 shows the relation between estimated soil erosion and slope
length for both Idabel and Goodwell; the land slope for all of these estimates was
4%. However, total erosion under grass is near zero at all the slope lengths evaluated;
thus, no further erosion control is needed for a grass cover.
10.7.5 er o S I o n co n t r o l St r u c t u r e S
Erosion control structures such as diversion terraces or waterways lined with grass or
riprap protect the soil at sites where crops are cultivated, or land disturbance renders
the soil erodible on a continuing basis. Erosion control structures concentrate surface
runoff water—concentrated surface runoff water is much more erosive than runoff
spread evenly over the land surface. As a result, poorly maintained structures may
0
20
40
60
01015
Slope, %
Mg/ha
Tolerable Soil Loss
Winter Wheat, Goodwell, OK
Total Erosion
Wind Erosion
5
Water Erosion
FIGURE 10.9 Water, wind, and total soil erosion vs. land slope for winter wheat at Good-
well, Oklahoma.
0
20
40
60
01015
Slope, %
Mg/ha
Idabel Wheat
Goodwell Wheat
Grass
Tolerable Soil Loss
5
FIGURE 10.10 Total soil erosion for winter wheat and grass vs. land slope at Idabel and
Goodwell, Oklahoma.
© 2009 by Taylor & Francis Group, LLC
Design Components 149
cause signicant erosion on a grass-covered site because of the release of concentrated
surface runoff water. All erosion control structures need frequent maintenance.
Terraces or waterways on an ET cover may cause serious erosion because struc-
tures are prone to fail, even under grass. For example, rodents frequently build burrows
on grass-covered terraces because the ridge is the driest site in the area; the burrows
weaken the structure and may cause failure. Structures on a grass-covered landll
surface signicantly increase the need for frequent and expensive maintenance.
Shaping the land to avoid concentration of water on the surface of a native grass
landll cover will control soil erosion from long slopes. A grass cover without struc-
tures can easily protect an ET landll cover from erosion.
Examination of erosion or its absence in the natural world is instructive. Land-
scapes with land slopes up to 12% or greater and slope length greater than 800 m
(0.5 mi) seldom suffer soil erosion if they remain under native grass. Landlls located
in some arid regions may present an exception and may need shorter and atter
slopes. Observation of natural landscapes near a landll site is instructive regarding
maximum slope and slope length.
Gully erosion is not a signicant threat to an ET cover. For example, grass cover
successfully controls erosion in farm eld waterways carrying water at greater depth
and higher velocity than that expected on landll covers.
Native grass provides excellent control of both wind and water erosion for soils with
slopes and slope length common to ET landll covers. Soil erosion is a threat to ET
landll covers during the plant establishment period only; proper management during
that period can effectively control soil erosion. During the life of a landll cover, soil
erosion by wind or water is not a signicant threat to properly constructed and man-
aged ET landll covers; there is no need for mechanical erosion control structures.
10.8 LANDFILL SETTLEMENT
Wastes deposited in landlls naturally settle for decades or longer. The waste is nor-
mally compacted during placement in modern landlls; however, additional settle-
ment is likely before the nal cover is placed on the landll. Because the waste is
0
20
40
60
2000 400600 800
Slope Length or Field Width, m
Mg/ha
Exceeds Normal USLE Limits
Tolerable Soil Loss
Idabel Wheat
Goodwell Wheat
Grass
FIGURE 10.11 Total soil erosion for winter wheat or grass vs. slope length or eld width at
Idabel and Goodwell, Oklahoma.
© 2009 by Taylor & Francis Group, LLC
150 Evapotranspiration Covers for Landfills and Waste Sites
heterogeneous, uneven settlement is common. A load (e.g., a cover) placed on top of
the waste increases the settlement rate. The design of any landll cover should take
into account future settlement because it may result in cracks or holes in the cover
and in local land-surface grade reversals.
There are two settlement phases, primary and secondary. Secondary settlement
begins after primary settlement and continues for the life of the landll. Primary
settlement may be complete in about 4 months; thus, the cover is usually installed
near the beginning of secondary settlement.
Sharma and Anirban (2007) reviewed ve methods for estimating future waste
settlement. They present the following equation to describe secondary settlement of
waste under self-weight:
SCH
T
T
= log
2
1
where
S = settlement
C = coefcient of settlement under self-weight
H = waste thickness at the end of primary settlement
T
1
= time for primary settlement (use 4 months)
T
2
= time of interest
Their equation for settlement under external load is similar in form but uses a
unique value for C, which is contained in their table of recommended values for the
coefcient.
To illustrate the range of settlement that is possible, Figure 10.12 presents
settlement values calculated with coefcients suggested by Sharma and Anirban
(2007). The gure includes estimates for (1) a typical conventional landll with
roller compaction and a cover in place (C = 0.03), and (2) waste undergoing active
decomposition with self-weight (C = 0.22), which may approximate conditions in
a bioreactor landll. The settlement is expressed as a percentage of the beginning
0
10
20
30
40
50
Years
10020304050
Settlement, %
Conventional
Bioreactor
FIGURE 10.12 Landll settlement as percentage of beginning thickness for a bioreactor
and a conventional landll.
© 2009 by Taylor & Francis Group, LLC
Design Components 151
waste thickness, and the estimates are extrapolated beyond the 15 year period of
measurement reported by Sharma and Anirban (2007).
The ET landll cover is less prone to damage by settlement than other cover
types, and when repairs are needed, they are easier and less costly to accomplish.
However, cover settlement is an important consideration when establishing the slope
of the nished cover.
10.9 LANDFILL COVER SLOPE
Uneven settlement of waste could cause ponds to develop on the landll surface if
the beginning slope is too at. Therefore, the minimum slope on a nished landll
cover should be at least 2%.
Steep land slopes are incompatible with ET landll covers. Although grass grows
on steep slopes, grass plants seldom grow robustly there. Robust growth of the cover
vegetation is a requirement for an effective ET cover. Litter accumulates between
plants under bunch grasses and effectively controls soil erosion on moderate land
slopes, even with several inches of water owing on the surface. Erosion control is
dependent on robust growth of grass plants; however, robust plant growth cannot be
assured on steep slopes.
If a bare spot develops on a moderate slope, grass can easily cover the ground
again by natural processes, but on steep slopes, recovery will be slower and not
assured. Where snow is an important part of the annual precipitation at semiarid
sites, uniform distribution over the surface of the landll is important to assure ade-
quate water supply to all parts of the cover. With steep side slopes, wind is more
likely to remove snow from some areas and deposit it in deep drifts in others. When
deep snowdrifts melt, they may produce excessive localized deep percolation and
may damage the grass cover. Snow is more difcult to control on steep slopes.
The purpose of steep slopes on conventional landll covers is to provide addi-
tional storage volume for waste. With ET covers, the gain in volume may not be
worth the price in reduced performance of the cover and the potential for increased
maintenance cost.
Bulldozers and other construction machinery can safely work on land slopes less
than 8%. An ET cover with land slopes less than 8% presents little or no threat to
slope stability. Land slopes of 2–8% should be satisfactory for ET landll covers.
10.10 SAFETY FACTOR FOR MINIMUM PERCOLATION
Landll covers that are required to minimize percolation of precipitation into the
waste need a cover thickness safety factor. Similar to other remediation measures,
the ET cover design needs safety factors because both design and construction
introduce uncertainty regarding performance. Control of water ow into the waste
requires the following safety factor considerations for the ET cover:
The degree of precipitation control required to meet site demands.•
The size of the soil water reservoir in the cover soil should be adequate to •
contain extreme or design storm events consistent with site needs.
© 2009 by Taylor & Francis Group, LLC
152 Evapotranspiration Covers for Landfills and Waste Sites
10.10.1 So I l th I c k n e S S ba S I S
One basis for providing a safety factor is to increase the soil thickness (i.e., build
the soil cover thicker than indicated as adequate by design). However, this intui-
tive approach may not produce the desired result. Although the total water-holding
capacity is similar for each soil layer of a uniform soil, the distribution of roots and
the rate and amount of water extraction are not.
As discussed in Chapter 5, several factors control root growth, including soil
water content and soil temperature. As a result, the distribution of roots in the soil
prole changes in response to the limiting factors present and may differ between
years in a particular soil cover. Figure 10.13 shows the possible root distribution in
a cover soil at three times during a year and the potential maximum root mass for
any soil layer during that year. Even though good soil tilth maximizes root mass in
each layer, the potential root mass is less near the bottom of the soil prole than at
the top.
Figure 10.13 shows possible soil water content at the end of the growing season
where an arbitrary thickness of soil was added as a “safety factor.” The soil added
as a safety factor layer had properties similar to the remainder of the soil. However,
the plant root distribution established in the new cover will include many roots in the
surface layer and fewer in the bottom layer. Even though the safety factor soil layer is
on top, its impact on water balance and percolation is measured at the bottom of the
prole. With the situation illustrated, the cover could fail during the following year.
Because of the distribution of plant roots in the soil, the addition of a dened
thickness of soil is unlikely to achieve the desired safety factor. Plants remove less
water and extract it more slowly from deep soil layers than from near-surface lay-
ers. Figure 10.14 shows a conceptualized relationship between soil thickness and
seasonal soil water removal by ET where soil thickness was increased from A to
B. The actual change in plant-available and usable water storage capacity is not a
straight line relationship between soil thickness and storage, particularly for thick
ET landll covers.
Live Root Mass
0
Depth
1
2
3
Potential
Safety Factor
Soil Layer
SF Water
Extraction
Soil Water
Content in Fall
FC
Soil Water
WP
FIGURE 10.13 Possible distribution of live roots during the growing season, and the soil
water content in fall, with a soil layer added as a safety factor.
© 2009 by Taylor & Francis Group, LLC
Design Components 153
10.10.2 hy d r o l o g I c ba S I S
A better way to provide a safety factor is to utilize hydrologic factors with a proven
design model to estimate performance. For example, the model evaluation could
include one or more of the following:
Increased daily precipitation (i.e., 110% of average precipitation).•
Design for a cover with uniform soil properties, but install a 15 cm thick •
layer of clay soil on top of the cover to increase surface runoff.
Design for either warm- or cool- season plants, but establish both; this •
extends the growing season and thus increases total ET.
REFERENCES
ASCE. (1996). Hydrology Handbook, 2nd edition. Manual 28 (Chapter 3 pages 98–100).
American Society of Civil Engineers, Reston, VA.
Bennett, H. H., Bell, F. G., and Robinson, B. D. (1951). Raindrops and Erosion. Circular No.
895, U. S. Department of Agriculture, Washington, DC.
Chepil, W. S. (1958). Soil Conditions that Inuence Wind Erosion. Technical Bulletin, No. 1185.
U. S. Department of Agriculture, Agricultural Research Service, Washington, DC.
Chepil, W. S., and Woodruff, N. P. (1963). The physics of wind erosion and its control. In
Advances in Agronomy, Vol. 15, 211–302. Academic Press, New York.
Follett, R. F. and Stewart, B. A. (Ed’s.) (1985). Soil Erosion and Crop Productivity. American
Society of Agronomy, Crop Science Society of America and Soil Science Society of
America, Madison, WI.
Fryrear, D. W. and Randel, G. L. (1972). Predicting Blowing Dust in the Southern Plains.
MP-1025, Texas A&M University, College Station, TX.
Gee, G. W. and Or, D. (2002). Particle-size analysis. In Methods of Soil Analysis: Physical
Methods, Part 4. Dane, J. H. and Topp, G. C. (Eds.). Soil Science Society of America,
Madison, WI, pp. 255–293.
Lowdermilk, W. C. (1953). Conquest of the Land Through Seven Thousand Years. Agricul-
tural Information Bulletin No. 99. U.S. Department of Agriculture, Soil Conservation
Service, Washington, DC.
NCSS (2006). Web soil survey. U.S. Department of Agriculture, Natural Resources Conser-
vation Service, (accessed June 13, 2006).
Pennell, K. D. (2002). Specic surface area. In Methods of Soil Analysis: Physical Methods,
Part 4, Dane, J. H. and Topp, G. C. (Eds.). Soil Science Society of America, Madison,
WI, pp. 295–315.
Soil ickness
A
Soil Water
B
Goal
B
FIGURE 10.14 Soil water removed by ET as changed by increased soil thickness.
© 2009 by Taylor & Francis Group, LLC
154 Evapotranspiration Covers for Landfills and Waste Sites
Saxton, K. E. (2005). Soil water characteristics, hydraulic properties calculator, USDA, Agri-
cultural Research Service (accessed
October 28, 2005).
Saxton, K. E. and Rawls, W. J. (2005). Soil water characteristic estimates by texture and
organic matter for hydrologic solutions, Agricultural Research Service, USDA, http://
users.adelphia.net/~ksaxton/SPAW%20Download.htm (accessed October 28, 2005).
Sharma, H. D. and Anirban, D. (2007). Municipal solid waste landll settlement: postclosure
perspectives. J. Geotechnical Geoenviron. Eng., 133(6): 619–629.
Smith, D. D. and Wischmeier, W. H. (1962). Rainfall erosion. In Advances in Agronomy,
Vol. 14, Academic Press, New York, pp. 109–148.
SSSA (1997). Glossary of Soil Science Terms. Soil Science Society of America, 677 South
Segoe Road, Madison, WI 53711.
USDA (1938). Soils and Men, the Yearbook of Agriculture. U.S. Department of Agricul-
ture, 75th Congress, 2nd session, House Document No. 398, U.S. Government Printing
Ofce, Washington, DC.
USDA, NRCS (2006). NRCS soils Web site. (accessed May 25, 2006) or
(accessed May 25, 2006).
Waugh, W. J., Thiede, M. E., Bates, D. J., Cadwell, L. L., Gee, G. W., and Kemp, C. J. (1994).
Plant cover and water balance in gravel admixtures at an arid waste-burial site. J. Envi-
ron. Qual., 23, 676–685.
Wischmeier, W. H. and Smith, D. D. (1978). Predicting rainfall erosion losses: a guide to con-
servation planning. Agriculture Handbook No. 537. U.S. Department of Agriculture,
Washington, DC.
Woodruff, N. P. and Siddoway, F. H. (1965). A wind erosion equation. Soil Sci. Soc. Am.
Proc., 29(3): 602–608.
© 2009 by Taylor & Francis Group, LLC