báo cáo hóa học:" Short term exposure to cooking fumes and pulmonary function" pdf
Bạn đang xem bản rút gọn của tài liệu. Xem và tải ngay bản đầy đủ của tài liệu tại đây (640.69 KB, 8 trang )
BioMed Central
Page 1 of 8
(page number not for citation purposes)
Journal of Occupational Medicine
and Toxicology
Open Access
Research
Short term exposure to cooking fumes and pulmonary function
Sindre Svedahl*
1,2
, Kristin Svendsen
3
, Torgunn Qvenild
4
,
AnnKristinSjaastad
4
and Bjørn Hilt
1,2,4
Address:
1
Department of Occupational Medicine, Norwegian University of Science and Technology, Trondheim, Norway,
2
Department of Cancer
research and Molecular Medicine, The Faculty of Medicine, Norwegian University of Science and Technology, Trondheim, Norway,
3
Department
of Industrial Economics and Technology Management, Norwegian University of Science and Technology, Trondheim, Norway and
4
Department
of Occupational Medicine, St. Olavs University Hospital, Trondheim, Norway
Email: Sindre Svedahl* - ; Kristin Svendsen - ;
Torgunn Qvenild - ; Ann Kristin Sjaastad - ; Bjørn Hilt -
* Corresponding author
Abstract
Background: Exposure to cooking fumes may have different deleterious effects on the respiratory
system. The aim of this study was to look at possible effects from inhalation of cooking fumes on
pulmonary function.
Methods: Two groups of 12 healthy volunteers (A and B) stayed in a model kitchen for two and
four hours respectively, and were monitored with spirometry four times during twenty four hours,
on one occasion without any exposure, and on another with exposure to controlled levels of
cooking fumes.
Results: The change in spirometric values during the day with exposure to cooking fumes, were
not statistically significantly different from the changes during the day without exposure, with the
exception of forced expiratory time (FET). The change in FET from entering the kitchen until six
hours later, was significantly prolonged between the exposed and the unexposed day with a 15.7%
increase on the exposed day, compared to a 3.2% decrease during the unexposed day (p-value =
0.03). The same tendency could be seen for FET measurements done immediately after the
exposure and on the next morning, but this was not statistically significant.
Conclusion: In our experimental setting, there seems to be minor short term spirometric effects,
mainly affecting FET, from short term exposure to cooking fumes.
Background
Exposure to cooking fumes is abundant both in domestic
homes and in professional cooks and entails a possible
risk of deleterious health effects. When food is cooked at
temperatures up to 300°C, carbohydrates, proteins, and
fat are reduced to toxic products, such as aldehydes and
alkanoic acids[1-4] which can cause irritation of the air-
way mucosa[5-8]. Cooking fumes also contains carcino-
genic and mutagenic compounds, such as polycyclic
aromatic hydrocarbons and heterocyclic compounds[1-
3,9-13]. Exposure to cooking fumes has also been associ-
ated in several studies with an increased risk of respiratory
cancer[14-18]. Recently, the International Agency for
Research on Cancer has classified emissions from high
temperature frying as probably carcinogenic to
humans[19].
Published: 4 May 2009
Journal of Occupational Medicine and Toxicology 2009, 4:9 doi:10.1186/1745-6673-4-9
Received: 28 January 2009
Accepted: 4 May 2009
This article is available from: />© 2009 Svedahl et al; licensee BioMed Central Ltd.
This is an Open Access article distributed under the terms of the Creative Commons Attribution License ( />),
which permits unrestricted use, distribution, and reproduction in any medium, provided the original work is properly cited.
Journal of Occupational Medicine and Toxicology 2009, 4:9 />Page 2 of 8
(page number not for citation purposes)
Frying at high temperatures also produces aerosols of fat
with small aerodynamic diameters of 20–500 nm which
disperse in the air of the kitchen and nearby facilities.
Such aerosols, containing fatty acids, irritate the airway
mucosa, and can cause pneumonia[20-22]. It has also
been shown that the inhalation of aerosols of oil mist
from other kinds of oils can cause small airway obstruc-
tion[23-25]. Chinese investigations have shown that
exposure to cooking fumes at work can be associated with
rhinitis[26], respiratory disorders, and impaired pulmo-
nary function[27]. In two Norwegian studies, it has been
shown that cooks and kitchen workers had an increased
occurrence of respiratory distress associated with
work[28] and increased mortality from airway dis-
ease[29]. Few other studies have addressed the biological
effects of exposure to cooking fumes in western domestic
and professional kitchens.
Spirometry is the most common, and also a quite sensitive
pulmonary function test. It has been used for a long time
in many investigations, for detecting chronic work-related
impaired lung function in general, but it has also been
possible to study short term cross-shift changes in differ-
ent settings[30,31]. The traditional spirometric time-vol-
ume curve measures the bowl function of the lungs, while
flow-volume curves and other measures also give indica-
tions of the function of the smaller and more peripheral
airways.
The aim of this study was to see if short term exposure to
moderate levels of cooking fumes in an indoor environ-
ment causes changes in pulmonary function.
Methods
Twenty four voluntary non-smoking students without any
chronic or current respiratory disease were recruited for
the study. They were split into group A which consisted of
8 males and 4 females, and group B with 7 males and 5
females. For both groups, measurements of pulmonary
function were made under the same setting on two con-
secutive days during one week without exposure to cook-
ing fumes, and then on the same weekdays during one
subsequent week with exposure in an experimental set-
ting.
The subjects were exposed to controlled levels of cooking
fumes during the pan-frying of beef in a model kitchen of
56 m
3
(2.5 × 4 × 5.6 m) by use of an electric hob for group
A and a gas hob for group B. The door and the window
were kept closed, and the only ventilation was a kitchen
ventilator which exhaled air at a rate of up to 600 m
3
/h.
The level of cooking fumes in the kitchen was regulated by
adjusting the quantity of beef in the pan, the extraction
rate of the kitchen ventilator, and the effect level of the
hotplate or the gas burner. The concentration of cooking
fumes was monitored with a MIE pDR-1200 optical aero-
sol monitor (Thermo Andersen Inc., Smyrna, USA)
located on a table 1.5 m from the cooking device and set
to register the concentration of PM5 aerosols. The level
was kept between 8–10 mg/m
3
for group A, and 10–14
mg/m
3
for group B. Group A was exposed to cooking
fumes in the kitchen for 2 hours, with each person per-
forming the frying 3 times for approximately 15 minutes
each time, while group B was exposed for 4 hours with
each person frying 3 times for approximately 25 minutes
each time.
The sampling of total particles was performed using pre-
weighed, double Gelman AE glassfiber filters (37 mm).
The filters were placed in a closed face, clear styrene, acry-
lonitrile (SAN) cassette connected to a pump (Casella
Vortex standard 2 personal air sampling pump, Casella
CEL, Bedford, England) with an air flow of 2 l/min. The
filters were placed on the right shoulder of the participant.
Before and after sampling, the filters were conditioned in
an exicator for 24 hours. The filters were analyzed gravi-
metrically, using a Mettler weight (0.01 mg dissolution).
An inner calibration was performed on the weight before
every weighing. Blank filters were included in the analysis
in order to control for deviations caused by temperature
or humidity.
The pulmonary function of the participants was measured
with standard spirometry (Spirare sensor model SPS 310
based on tachopneumographic principles) and data were
registered and analysed by the Spirare 3 software (Diag-
nostica corp., Norway). Spirometric parameters were
measured with the subject in a sitting position, wearing a
nose-clip, and breathing through the mouthpiece. Stand-
ardised instructions were given according to the criteria of
American Thoracic Society[32]. We measured forced vital
capacity (FVC), forced expiratory volume in one second
(FEV1), peak expiratory flow (PEF), forced expiratory
flows at 25, 50, and 75% of the vital capacity (FEF25,
FEF50, FEF75), and forced expiratory time (FET), defined
as the time from the start of the expiratory manoeuvre
until the beginning of the end-expiratory plateau. The val-
ues used in the analysis were from the best curve out of
three qualified performances. The best measurement was
defined as that with the greatest sum of FEV1 and FVC.
Measurements were done at four occasions for each per-
son both during the week without exposure ("blind") and
during the week with exposure to cooking fumes: 1) in the
morning before entering the kitchen (between 8 and 9
am), 2) when leaving the kitchen after two hours
(between 10 and 11 am (group A)), or four hours
(between 12 am and 1 pm (group B)), 3) six hours after
entering the kitchen (between 2 and 3 pm), and 4)
twenty-four hours after entering the kitchen (between 8
and 9 am). The programme on the "blind day" was exactly
Journal of Occupational Medicine and Toxicology 2009, 4:9 />Page 3 of 8
(page number not for citation purposes)
the same as on the day with exposure in regard to location
and activities, except that the subjects did not fry any beef,
and were not exposed to any cooking fumes. In this way,
the subjects were their own controls, making it possible to
compare each subject's change in pulmonary function on
a day with short term exposure to cooking fumes, with the
change in pulmonary function on a day without exposure.
Predicted values were based on a European reference
material [33].
Results were registered and analyzed using SPSS for Win-
dows version 14. Spearmen-Rank test was used to com-
pare the intra-individual change in pulmonary function
during the day with exposure, to the intra-individual
change during the day without exposure. A significance
level of 5% was chosen, and all statistical test results were
two-sided.
The study was approved by the ethical committee for
medical research in Central Norway. The participation
was entirely voluntary, and written information was given
to every participant about the project, also stating that he/
she at any time could withdraw from the study. All partic-
ipants received a symbolic allowance for their participa-
tion. There were no known conflicts of interest for any of
the authors.
Results
Table 1 shows the individual levels of exposure to cooking
fumes, and some background variables for group A (par-
Table 1: Personal exposure to particles from cooking fumes and personal characteristics of the twenty-four volunteers who
participated in the study.
Group and subject number Personal
Exposure
mg/m3
Sex* Age (Years) Height (cm) Weight (Kg) Current cold Known allergy Current medication
A 1 13.8 F 24 173 65 No No No
2 14.4 M 25 193 105 No No No
314.9F2416361 No No Yes
413.9F2115245 No No No
518.9M2418390 Yes No No
620.8F2216666 No Yes Yes
724.1M2619395 No No No
824.4M2817775 No No No
915.4M2618476 No Yes No
10 32.9 M 25 172 67 Yes No No
11 23.7 M 25 187 74 No No No
12 16.7 M 24 187 84 Yes Yes No
All group A mean (SD) 19,5 (5,9) 50%
female
24.5 (1.8) 177.5 (12.7) 75.3 (16.4) 25% 25% 17%
B
13 33.1 F 24 172 65 No No Yes
14 43.2 M 23 185 73 Yes Yes No
15 50.1 F 21 165 65 Yes No No
16 32.8 F 21 162 49 No Yes Yes
17 53.2 F 24 166 85 No No Yes
18 31.9 M 23 187 86 No Yes No
19 38.6 F 19 170 58 No No No
20 31.2 M 31 176 78 No No No
21 52.5 M 21 165 68 No Yes Yes
22 44.8 M 25 171 63 No No No
23 47.3 M 22 169 63 Yes Yes Yes
24 54.9 M 23 180 95 No No Yes
All group B mean (SD) 42,8 (9,0) 42%
female
23.1 (3.0) 172.3 (8.1) 70.7 (13.2) 25% 42% 50%
All 24 mean (SD) 31,1 (14,0) 46%
female
23.8 (2.5) 174.9 (10.8) 73.0 (14.7) 25% 33% 33%
F = female, m = male
Journal of Occupational Medicine and Toxicology 2009, 4:9 />Page 4 of 8
(page number not for citation purposes)
ticipants 1–12) and group B (participants 13–24). The
individual level of exposure measured by gravimetric
analysis ranged from 13.8 to 32.9 mg/m
3
for group A, and
from 31.2 to 54.9 mg/m
3
for group B. The mean spiromet-
ric performance of the participants on the first unexposed
morning and the mean percent of their predicted values
are shown in Table 2. Group A had a higher mean forced
vital capacity (FVC) and forced expiratory volume in one
second (FEV1), but the groups have about the same results
relative to the percent of predicted values. Table 3 shows
the changes in spirometric performance during the course
of the days with and without exposure, while figure 1
shows the courses of some selected spirometric values as
such.
The forced expiratory time (FET) on entering the kitchen
compared to the FET six hours later was significantly
altered, with a 15.7% increase on the exposed day, com-
pared to a 3.2% decrease during the "blind day" (p-value
= 0.03).
The same tendency can be seen for FET measurements
done immediately after the exposure and on the next
morning, but this was not statistically significant. For the
forced expiratory flow when 50% is exhaled (FEF50),
group B showed a statistically significant increase between
both the first and the second (2-1) and the first and the
third (3-1) measurements.
For FEF25 (when 25% is exhaled), a similar difference was
found between the first and the third measurement (3-1).
We found no statistically significant differences between
the changes in other spirometric measurements during
the day of exposure, compared to the changes during the
"blind day".
Discussion
Most previous studies of effects from cooking fumes have
looked at manifest diseases and chronic respiratory effects
in cooks and other exposed groups[14-18,26-29]. In this
study we aimed to determine early, short term changes in
lung function in healthy subjects subsequent to exposure
to cooking fumes in an experimental setting. In such a set-
ting we did not expect to find dramatic changes in crude
spirometric measures such as FVC, FEV1 or PEF, but rather
hypothesised that there might be changes in measures
that reflected more the function of the small airways, such
as FEF 75 and FET.
In our paired analysis it was shown that FET developed
differently during the day of exposure, compared to the
"blind day". Prolonged FET has been associated with
obstructive disorders[34], and abnormalities in FET have
been found in symptomatic smokers with normal
FEV1[35]. FET has been suggested as a measure of small
airways obstruction[36]. It has been found to have an
important discriminatory ability[37], but also a rather low
repeatability[37-39]. A recent population study found
that FET had a high coefficient of variation (CoV) of
11.3% compared to FVC, FEV1, and PEF which had CoV
of 1.38%, 1.44% and 3.0% respectively [38]. It has also
been shown that airflow limitation tends to prolong FET,
even in healthy subjects [40]. The increase in FET during
the day of exposure in our study might thus be explained
by inflammatory responses and an obstruction in the dis-
tant peribronchiolar tissue caused by the inhalation of
cooking fumes. It has, however, been claimed that there is
an association between improved spirometric perform-
ance and the FET, and that repeated measurements can
lead to a training effect[41]. The increase in FET during the
day of exposure, which was subsequent to the "blind day",
could therefore alternatively be explained by better spiro-
metric performance resulting from a training effect. How-
ever, if a learning response was the explanation for the
prolonged FET in our study, one would expect to have an
increase in FET during the blind day as well, but instead,
a decrement in FET appeared. Moreover, if a prolonged
FET should be seen as a result of a training effect, the
change would probably have gone along with an increase
in the FVC and other parameters as well. The lack of such
Table 2: Spirometric values measured in the two groups and % of predicted values.
Spirometric measure Group A Group B All
Mean (SD) % of pred Mean (SD) % of pred Mean (SD) % of pred.
FVC, litres 5.2 (1.3) 105 4.6 (1.0) 101 4.9 (1.2) 103
FEV1, litres 4.0 (0.8) 95 3.9 (0.8) 102 4.0 (0.8) 99
FEV% 79.0 (8.8) n.a. 86.2 (3.6) n.a 82.6 (7.5) n.a.
PEF litres/min 570 (112) 103 550 (126) 106 560 (117) 104
FEF25 litres/sec. 7.0 (1.6) 88 7.7 (1.7) 104 7.4 (1.7) 96
FEF50 litres/sec 4.3 (0.8) 78 5.2 (1.1) 102 4.8 (1.0) 91
FEF75 litres/sec 1.9 (0.3) 73 2.2 (0.5) 92 2.1 (0.5) 84
FET seconds 5.1 (1.1) n.a. 3.9 (1.2) n.a. 4.5 (1.3) n.a.
n.a. = not applicable
Journal of Occupational Medicine and Toxicology 2009, 4:9 />Page 5 of 8
(page number not for citation purposes)
an improvement in our study makes the possibility of a
learning effect in regard to the observed increase in FET
less probable, in our view.
Although the other spirometric parameters did not
develop significantly differently on the "blind" day and
the day with exposure, there might have been a tendency.
We find it interesting that the mean FEV1 increased by
0.4% from the morning until 2 – 3 pm on the "blind" day,
while it decreased by 0.5% during the same period of time
on the day with exposure (Table 3 and Figure 1). The
increase of FEV1 during the blind day could reflect diurnal
variation. In a recent study FEV1 in young adults was
shown to increase by 120 ml from 9.00 A.M. until noon,
and decreased a little in the afternoon[42]. The diurnal
variation of FEV1 was, however, shown to be less pro-
nounced in those who were without symptoms and non-
smokers. As our subjects were young, a certain increase in
FEV1 from the morning till noon could be expected. On
the other hand, all of our subjects were both symptom-
free and non-smokers, which might explain the low
observed diurnal variation of FEV1 in our study. Also, in
the statistical analysis the diurnal variation was controlled
for since the change in spirometry was compared between
weeks with measurements at the same points of time. The
observation of some statistical improvement in FEF25 and
FEF50 in group B on the day with exposure compared to
the day without was unexpected. When exploring the
data, three subjects from group B had unusual, and unex-
plainably high, starting values for these variables solely on
the day without exposure (point 1, dotted line in figure 1).
Thus, the difference could as much be due to an unex-
plainable fall in these measurements on the blind day as
due to the slight increase on the exposed day. When the
three subjects with the unusual starting values were taken
out of the analysis, there were no statistically significant
differences.
One possible interpretation of the lack of statistically sig-
nificant changes in other spirometric measures than the
FET could be that the twenty-four subjects that we had
access to might be too few to render enough statistical
power when studying small changes in the airways. Thus,
we cannot conclude that some other parameters of the
pulmonary function were not affected, even though we
could not detect any significant differences between the
"blind" day, and the exposed day.
Table 3: Percentual changes in spirometric values at different points in time in the groups and during periods with (E) and without (B)
exposure to cooking fumes.
Spirometric measure Group A (n = 12) Group B (n = 12) All (n = 24)
2-1# 3-1 4-1 2-1 3-1 4-1 2-1 3-1 4-1
FVC B -1.1 -0.6 +0.1 -1.7 -1.3 -2.3 -1.4 -0.9 -1.1
E +0.2 -0.5 -0.8 -1.3 -0.9 +0.1 -0.6 -0.7 -0.4
FEV1 B +1.1 +1.3 +0.6 -0.8 -0.6 -1.6 +0.2 +0.4 -0.5
E +0.5 -0.5 -1.2 -0.8 -0.5 -0.5 -0.2 -0.5 -0.9
FEV% B +2.3 +1.9 +0.6 +0.9 +0.8 +0.7 +1.6 +1.4 +0.7
E +0.3 +0.0 -0.3 +0.5 +0.5 -0.6 +0.4 +0.2 -0.5
PEF B +2.4 -0.5 -1.7 -1.7 -1.7 -3.0 +0.4 -1.1 -2.3
E -0.8 -0.2 -0.6 +0.9 +2.6 +1.4 +0.1 +1.2 +0.4
FEF25 B +3.8 +5.9 +3.6 -5.0 -5.4 -4.2 -0.6 +0.3 -0.3
E -0.9 +0.5 -0.4 -1.4 +1.9* +0.7 -1.2 +1.2 +0.1
FEF50 B +0.6 +3.4 -0.2 -2.6 -4.5 -4.6 -1.0 -0.6 -2.4
E -0.6 +0.7 -2.5 +6.5* +6.1* +0.6 +2.9 +3.4 -1.0
FEF75 B -0.7 +3.7 -0.9 +3.8 +3.8 +0.1 +1.6 +3.7 -0.4
E +2.3 +0.6 +0.9 +1.3 -1.0 -0.6 +1.8 -0.2 +0.1
FET B +1.0 +0.2 -4.5 -0.7 -6.7 +8.7 +0.1 -3.2 +2.1
E +1.0 +16.9 +1.0 +12.8 +14.6 +7.3 +6.9 +15.7* +4.2
* p < 0.05
# 2-1 is the difference between the first measurement and the measurement at the time of leaving the kitchen after 2 or 4 hours. 3-1 is the
difference between the first measurement and the measurement taken 6 hours after entering the kitchen. 4-1 is the difference between the first
measurement and the measurement taken 24 hours after entering the kitchen during the day with exposure compared to the day without
exposure.
Journal of Occupational Medicine and Toxicology 2009, 4:9 />Page 6 of 8
(page number not for citation purposes)
We think that the chosen short term exposure of the
groups to cooking fumes was quite realistic. Both for
group A and B, the exposure was at a level that led to sub-
jective annoyance; thus we did not find it right to make it
any higher. Even so, it might still have been too low in
both groups to irritate the lungs enough to give a short
term response that can be measured by more spirometric
parameters. By gravimetrical analyses of the personal fil-
ters carried by the participants, the exposure seemed to be
higher than the levels measured on a stationary basis by
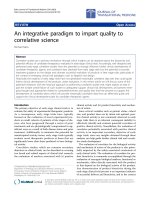
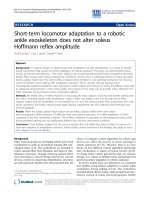
Development of selected spirometric varaiables from 1) Just before entering the model kitchen, 2) When leaving it after 2 (group A) or 4 (group B) hours, 3) Six hours after entering, and 4) 24 hours after entering (next morning)Figure 1
Development of selected spirometric varaiables from 1) Just before entering the model kitchen, 2) When leav-
ing it after 2 (group A) or 4 (group B) hours, 3) Six hours after entering, and 4) 24 hours after entering (next
morning).
4,4
4,6
4,8
5
5,2
5,4
1234
FVC in lit r es
3,8
3,9
4
4,1
1234
FEV1 in litres
6,8
7
7,2
7,4
7,6
7,8
1234
FEF25 in lit r es/s ec
.
4
4,4
4,8
5,2
5,6
1234
FEF50 in litres/sec
.
1,8
2
2,2
2,4
1234
FEF75 in litres/sec
.
3
4
5
6
1234
FET in s ec.
Group A: unexposed exposed
Group B: “ “
All: “ “
Journal of Occupational Medicine and Toxicology 2009, 4:9 />Page 7 of 8
(page number not for citation purposes)
the MIE instrument in the model kitchen. The reason for
this was most likely that the MIE instrument was placed
1.5 meters away from the hob, while the filters were
mounted near the breathing zone of the subjects, and thus
came closer to the hob when the subjects were actually fry-
ing beef.
With regard to the duration of the exposure, both two
hours (group A) and four hours (group B) might have
been too short to give a short term response that can be
measured by more spirometric parameters. On the other
hand, other studies have been able to unveil spirometric
changes over relatively short time spans[30,31]. It should
also be recognised that there were no differences in
changes in lung function between group A and B, even
though group B had a mean cumulative exposure (degree
× time) that was more than four times as high as for group
A. Thus, the study did not unveil any relationship between
cumulative exposure and lung function changes. One
should also be aware that there were other differences in
exposure between the groups in that group A worked with
an electrical hob, while B had a gas hob without observed
differences in spirometric changes.
Conclusion
In conclusion, there seems, in our experimental setting, to
be minor short term spirometric effects from exposure to
cooking fumes, mainly affecting FET.
Competing interests
The authors declare that they have no competing interests.
Authors' contributions
SS participated in the design of the study, drafting the
manuscript and in performing the statistical analyses. BH
participated in the design of the study, drafting the manu-
script and in performing the statistical analyses. TQ partic-
ipated in the design of the study. AKS contributed to the
manuscript and was responsible for the exposure condi-
tions. KS participated in the design of the study, contrib-
uted to the manuscript and in performing the statistical
analyses. All authors participated during the execution of
the experimental. All authors read and approved the final
manuscript.
Acknowledgements
SS is a joint M.D./Ph.D. student at the Faculty of Medicine at the Norwegian
University of Science and Technology. The faculty provided limited grants
for analyses and the practical performance of the experiment. AKS is at
present a fellow with The Norwegian Foundation for Health and Rehabili-
tation, with grants from The Norwegian Asthma and Allergy Association.
PF is greatly acknowledged for useful linguistic help. We are, of course, also
very grateful for all efforts and patience from those, mostly fellow students,
who participated in the experiments.
References
1. Kiel P: Kræft og stegeos. (Cancer and cooking fumes).
Research reports from the Danish Working Environment Research Fund.
Copenhagen 1986. No 781426
2. Kiel P, Andersen M: Mutagener i stegeos. (Mutgenic substances
in cooking fumes). Research reports from the Danish Working Envi-
ronment Reasearch Fund. Copenhagen 1988. No 782730
3. Vainiotalo S, Matveinen K: Cooking fumes as a hygienic problem
in the food and catering industries. Am Ind Assoc J 1993,
54:376-382.
4. Robinson AL, Subramanian R, Donahue NM, Bernardo-Bricker A,
Rogge WF: Source apportionment of molecular markers and
organic aerosol. 3. Food cooking emissions. Environ Sci Technol
2006, 40:7820-7827.
5. Ghilarducci DP, Tjeerdema RS: Fate and effects of acrolein. Rev
Environ Contam Toxicol 1995, 144:95-146.
6. Ross J, Seaton A, Morgan W: Toxic gases and fumes. In Occupa-
tional lung diseases 3rd edition. Edited by: Morgan W, Seaton A. Phila-
delphia: WB Saunders Company; 1995:568-596.
7. Costa DL: Air pollution. In Casarett and Doull's Toxicology: the basic
science of poisons Edited by: Klaassen CD. New York: McGraw-Hill
Medical; 2008:1119-1152.
8. Jensen LK, Larsen A, Molhave L, Hansen MK, Knudsen B: Health
evaluation of volatile organic compound (VOC) emissions
from wood and wood-based materials. Arch Environ Health 2001,
56:419-432.
9. Li S, Pan D, Wang G: Analysis of polycyclic aromatic hydrocar-
bons in cooking oil fumes. Arch Environ Health 1994, 49:119-122.
10. Thiebaud HP, Knize MG, Kuzmicky PA, Hsieh DP, Felton JS: Air-
borne mutagens produced by frying beef, pork and a soy-
based food. Food Chem Toxicol 1995, 33:821-828.
11. Mingzhen C, Zhenyang C, Zhenhua Z: Benzo[a]pyrene in Kitchen
Air and Urinary 1-Hydroxypyrene. Indoor Built Environt 1995,
4:306-310.
12. Yang CC, Jenq SN, Lee H: Characterization of the carcinogen 2-
amino-3,8-dimethylimidazo[4,5-f]quinoxaline in cooking
aerosols under domestic conditions. Carcinogenesis 1998,
19:359-363.
13. Chiang T-A, Wu P-F, Ko Y-C: Identification of Carcinogens in
Cooking Oil Fumes. Environ Res 1999, 81:18-22.
14. Coggon D, Pannett B, Osmond C, Acheson ED: A survey of cancer
and occupation in young and middle aged men. I. Cancers of
the respiratory tract. Br J Ind Med 1986, 43:332-338.
15. Lund E: Kokker og dødelighet av kreft. (Cancer and mortality
in cooks). Rapport fra Direktoratet for Arbeidstilsynet Oslo: Direktoratet
for Arbeidstilsynet 1986.
16. Zhong L, Goldberg MS, Parent ME, Hanley JA: Risk of developing
lung cancer in relation to exposure to fumes from Chinese-
style cooking. Scand J Work Environ Health 1999, 25:309-316.
17. Yang SC, Jenq SN, Kang ZC, Lee H: Identification of
benzo[a]pyrene 7,8-diol 9,10-epoxide N2-deoxyguanosine in
human lung adenocarcinoma cells exposed to cooking oil
fumes from frying fish under domestic conditions. Chem Res
Toxicol 2000, 13:1046-1050.
18. Zhou BS, Wang TJ, Guan P, Wu JM: Indoor air pollution and pul-
monary adenocarcinoma among females: a case-control
study in Shenyang, China. Oncol Rep 2000, 7:1253-1259.
19. International Agency for Research on Cancer: Monographs on the
Evaluation of Carcinogenic Risks to Humans Indoor air pol-
lution from household cooking and heating: Emissions from
high-temperature frying. 2006, 95: [ />ENG/Meetings/95-cooking-oils.pdf]. Lyon, France
20. Oldenburger D, Maurer WJ, Beltaos E, Magnin GE: Inhalation lipoid
pneumonia from burning fats. A newly recognized industrial
hazard. Jama 1972, 222:1288-1289.
21. Kennedy JD, Costello P, Balikian JP, Herman PG: Exogenous lipoid
pneumonia. AJR Am J Roentgenol 1981, 136:1145-1149.
22. Spickard A 3rd, Hirschmann JV: Exogenous lipoid pneumonia.
Arch Intern Med 1994, 154:686-692.
23. Robertson AS, Weir DC, Burge PS: Occupational asthma due to
oil mists. Thorax 1988, 43:200-205.
24. Eisen EA, Tolbert PE, Monson RR, Smith TJ: Mortality studies of
machining fluid exposure in the automobile industry I: A
standardized mortality ratio analysis. Am J Ind Med 1992,
22:809-824.
Publish with BioMed Central and every
scientist can read your work free of charge
"BioMed Central will be the most significant development for
disseminating the results of biomedical researc h in our lifetime."
Sir Paul Nurse, Cancer Research UK
Your research papers will be:
available free of charge to the entire biomedical community
peer reviewed and published immediately upon acceptance
cited in PubMed and archived on PubMed Central
yours — you keep the copyright
Submit your manuscript here:
/>BioMedcentral
Journal of Occupational Medicine and Toxicology 2009, 4:9 />Page 8 of 8
(page number not for citation purposes)
25. Kazerouni N, Thomas TL, Petralia SA, Hayes RB: Mortality among
workers exposed to cutting oil mist: Update of previous
reports. Am J Ind Med 2000, 38:410-416.
26. Ng TP, Tan WC: Epidemiology of allergic rhinitis and its asso-
ciated risk factors in Singapore. Int J Epidemiol 1994, 23:553-558.
27. Ng TP, Hui KP, Tan WC: Respiratory symptoms and lung func-
tion effects of domestic exposure to tobacco smoke and
cooking by gas in non-smoking women in Singapore. J Epide-
miol Community Health 1993, 47:454-458.
28. Svendsen K, Sjaastad AK, Sivertsen I: Respiratory symptoms in
kitchen workers. Am J Ind Med 2003, 43:436-439.
29. Borgan J, Kristoffersen L: Dødelighet i yrker og sosioøkono-
miske grupper 1970–1980. (Mortality by occupation and
socio-economic group in Norway 1970–1980) Statistiske
Analyser, No. 56. Statistisk Sentralbyra: Oslo-Kongsvinger, Nor-
way; 1986:217.
30. Bakke B, Ulvestad B, Stewart P, Lund MB, Eduard W: Effects of
blasting fumes on exposure and short-term lung function
changes in tunnel construction workers. Scand J Work Environ
Health 2001, 27:250-257.
31. Skogstad M, Kjaerheim K, Fladseth G, Gjolstad M, Daae HL, Olsen R,
Molander P, Ellingsen DG: Cross shift changes in lung function
among bar and restaurant workers before and after imple-
mentation of a smoking ban. Occup Environ Med 2006,
63:482-487.
32. American Thoracic Society: Standardization of Spirometry:
1994 update. Am J Respir Crit Care Med 1995, 152:1107-1136.
33. Quanjer PH, Tammeling GJ, Cotes JE, Pedersen OF, Peslin R, Yernault
JC: Lung volumes and forced ventilatory flows. Report Work-
ing Party Standardization of Lung Function Tests, European
Community for Steel and Coal. Official Statement of the
European Respiratory Society. Eur Respir J Suppl 1993, 16:5-40.
34. Lal S, Ferguson AD, Campbell EJ: Forced Expiratory Time: A
Simple Test for Airways Obstruction. Br Med J 1964, 1:814-817.
35. McFadden ER Jr, Linden DA: A reduction in maximum mid-
expiratory flow rate. A spirographic manifestation of small
airway disease. Am J Med 1972, 52:725-737.
36. Cochrane GM, Benatar SR, Davis J, Collins JV, Clark TJ: Correlation
between tests of small airway function. Thorax 1974,
29:172-178.
37. Miller MR, Pincock AC: Repeatability of the moments of the
truncated forced expiratory spirogram. Thorax 1982,
37:205-211.
38. Kainu A, Lindqvist A, Sarna S, Sovijarvi A: Intra-session repeatabil-
ity of FET and FEV6 in the general population. Clin Physiol Funct
Imaging 2008, 28:196-201.
39. Cochrane GM, Prieto F, Clark TJ: Intrasubject variability of max-
imal expiratory flow volume curve. Thorax 1977, 32:171-176.
40. Kainu A, Lindqvist A, Sarna S, Sovijarvi A: Spirometric and anthro-
pometric determinants of forced expiratory time in a gen-
eral population. Clin Physiol Funct Imaging 2008, 28:38-42.
41. Tsai AG, Christie JD, Gaughan CA, Palma WR Jr, Margolis ML:
Change in forced expiratory time and spirometric perform-
ance during a single pulmonary function testing session.
Respir Care 2006, 51:246-251.
42. Borsboom GJ, van Pelt W, van Houwelingen HC, van Vianen BG,
Schouten JP, Quanjer PH: Diurnal variation in lung function in
subgroups from two Dutch populations: consequences for
longitudinal analysis. Am J Respir Crit Care Med 1999,
159:1163-1171.