báo cáo hóa học:" Experimental and analytical validation of a modular acetabular prosthesis in total hip arthroplasty" pot
Bạn đang xem bản rút gọn của tài liệu. Xem và tải ngay bản đầy đủ của tài liệu tại đây (457.28 KB, 9 trang )
BioMed Central
Page 1 of 9
(page number not for citation purposes)
Journal of Orthopaedic Surgery and
Research
Open Access
Research article
Experimental and analytical validation of a modular acetabular
prosthesis in total hip arthroplasty
Francisco Romero
1
, Farid Amirouche
1,2
, Luke Aram
1
and
Mark H Gonzalez*
1,2
Address:
1
Department of Mechanical Engineering, Biomechanics Laboratory, University of Illinois at Chicago, 842 W. Taylor Street, Room 1039,
Chicago, Illinois 60607, USA and
2
Department of Orthopaedic Surgery, University of Illinois at Chicago, 1801 W. Taylor Street, Chicago, Illinois,
USA
Email: ; FaridAmirouche - ; Luke Aram - ;
Mark H Gonzalez* -
* Corresponding author
Abstract
A finite element model has been developed to predict in vivo micro motion between a modular
acetabular cup and liner after cement less total hip arthroplasty. The purpose of this study is to
experimentally validate the model. Six LVDT sensors were used to monitor the micromotion of
the liner when subjected to loading conditions ranging from 250 N to 5000 N. Deformations at
points of interest for both the experiment and FEM were compared. Results of the FEM with
different coefficient of friction between the liner and the cup were investigated to correlate with
the experimental results.
Background
Polyethylene wear particles generated from the acetabular
liner of an acetabular cup are a cause of the osteolysis
associated with acetabular cup failure. Wear generation
comes from the articulation of the femoral head and the
liner and from the articulation of the liner and the metal
shell. Wear generated by micromotion at the liner metal
shell interface, termed backside wear, is potentially more
damaging because of the egress of the particles to the cup
bone interface through the screw holes and the central
fenestration in the metal shell. These particles then create
an inflammatory reaction that can produce osteolysis of
the bone, leading to degradation of the interface and
eventual failure. The etiology of micromotion between
the metal shell and polyethylene is multifactorial. Impor-
tant factors include the contact stress [10], relative sliding
distances [11], conformity between contacting surfaces
and the number of screw holes in the acetabular shell
[12]. A rigid locking mechanism is paramount in limiting
micromotion at the liner shell interface. Conformity of
the liner shell interface and polishing of the metallic shell
are new advances to limit fractional wear.
The loading of the hip joint is cyclical and occurs during
gait. Impact loading of the hip joint can also occur as a
result of subluxation and relocation of the metallic ball in
the polyethylene cup. Little work has been done on the
effect of physiologic loads on micromotion at the cup
liner interface. The load patterns are particularly complex
during subluxation relocation because the initial contact
at relocation may be eccentric creating a moment. The cyl-
ical pattern of loading associated with level gait, stair
climbing and the impact from eccentric subluxation and
relocation are virtually impossible to reproduce physically
Published: 16 May 2007
Journal of Orthopaedic Surgery and Research 2007, 2:7 doi:10.1186/1749-799X-2-7
Received: 12 May 2006
Accepted: 16 May 2007
This article is available from: />© 2007 Romero et al; licensee BioMed Central Ltd.
This is an Open Access article distributed under the terms of the Creative Commons Attribution License ( />),
which permits unrestricted use, distribution, and reproduction in any medium, provided the original work is properly cited.
Journal of Orthopaedic Surgery and Research 2007, 2:7 />Page 2 of 9
(page number not for citation purposes)
in the laboratory. To this end a finite element model has
been created to investigate micromotion of the metal shell
liner interface. The purpose of this experiment is to vali-
date this model. The validation of the model quantifies
micromotion of a loaded acetabular cup liner assembly
with linear variable differential transducer (LVDT) sen-
sors.
Methods
2.1. Experiment set-up
Seven commercially available UHMWPE liners, 28 mm
inner diameter and 54 mm outer diameter, were used. The
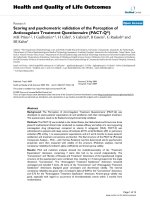
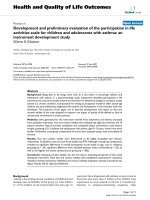
experiment set-up is represented in Figure 1.
The acetabular cup was placed into the acetabular shell as
recommended by the manufacturer. The acetabular cup
was then placed into a custom made jig that held the cup
rigidly. (Figure 1 supporting jig). Six circumferential set
screws were tightened rigidly to the acetabular cup within
the jig. The supporting jig was designed to hold the
acetabular shell at a constant angle of 45° with respect to
the horizontal simulating a 45° inclination angle. For this
experiment the anteversion angle was fixed at 15–20°.
The acetabular cup is statically placed at 25 degrees of
anteversion
Two acetabular shells (66 mm outer diameter) were used
during all the experiments. The first had only a polar fen-
estration and the second had polar fenestration and three
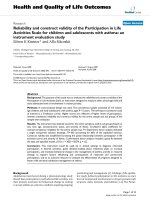
screw holes. A sensor positioning plate containing six cal-
ibrated LVDT sensors (AC-DC LVDTS 332, TRANS-TEK
Inc, Ellington, CT) was rigidly attached to the jig. The
LVDT sensors detect linear micromotion in the x, y and z
direction. The metal tip of each LVDT sensor was set to
zero position when it came in contact with the liner before
any loading conditions were applied. Care was taken to
locate the sensors' tips away from the liners' anti-rotation
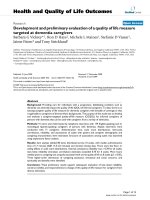
tabs. Three of the sensors contacted the liner perpendicu-
larly to the outer flat surface, while the other three con-
tacted the liner perpendicularly from the side (Figure 2).
The displacements measured using the six LVDT sensors
correspond to the local deformation of the polyethylene
liner at the points of contact.
The jig sensor assembly was positioned in an INSTRON
machine (Model 5579, Instron Corp., Canton, MA) for
loading. Load was applied to the acetabular components
through a 28 mm, commercially available femoral head
attached to the movable crosshead of the INSTRON
machine. The femoral head was positioned in the acetab-
ular liner and adjusted until a conforming contact was
achieved without applying significant load. The readings
on the sensors were still showing zero displacements. This
served as the starting point for experimental measure-
ments of load and micromotion.
The loading characteristics of each trial were set with the
INSTRON computer controller (Merlin 5500 Series). The
loading characteristics applied to the liner (including
number of cycles, speed, and maximum load) were speci-
fied. Each specimen (liner) was subjected to the loading
profiles described in Table 1.
The LVDT sensors were connected through a Data Acqui-
sition Card (DAQCard-A1-16E-4, National Instruments,
Austin, TX) to a laptop computer. Using data analysis soft-
ware (Lab-View, National Instruments, Austin, TX), a pro-
gram was developed to transform the signals from the
LVDT sensors into micromotion displacement values. The
micromotion values from the LVDT sensors were synchro-
nized with the loads applied with the INSTRON machine.
The FEM was then used to generate values for micromo-
tion at the points of attachment of the LVDT on the poly-
ethylene liner. The comparison of results from the
experimental and computational models allowed us to
validate the finite element model of the modular acetabu-
lar component.
2.2. Modular acetabular component: CAD model
Three-dimensional computer models of the modular
prosthetic components (femoral head, acetabular liner
and acetabular shell) were developed using Pro/Engineer
2000i2 (Parametric Technologies Inc., Needham, MA).
Component dimensions used in the models were based
on precise measurements taken from commercially avail-
able products (DePuy, Inc., Warsaw, IN) using hand
instruments.
The model was created with a polar fenestration. The same
consideration was made to model the liner. Geometrical
details without structural significance were omitted in
order to import CAD models to the standard ANSYS for-
mat (IGES). All 3-D models were converted to IGES for-
mat (No-defeaturing option).
2.3. Finite Element model
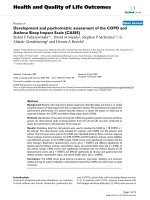
A three dimensional 3595 elements FE model (Figure 3)
of the femoral head, liner, and acetabular shell was devel-
oped based on the CAD geometry previously created
using ANSYS/LS-DYNA. The diameter of the articulating
surface femoral head/liner measured 28 mm while the
liner backside diameter measured 54 mm. A 12 mm diam-
eter polar fenestration was placed in the metal acetabular
shell which corresponds to the central insertion hole. The
acetabular shell was positioned with 45° inclination and
25° anteversion [13].
The Finite Element mesh of the acetabular shell, liner and
femoral head consisted of eight-node hexahedron solid
elements (Table 2). A polar mesh design was selected to
Journal of Orthopaedic Surgery and Research 2007, 2:7 />Page 3 of 9
(page number not for citation purposes)
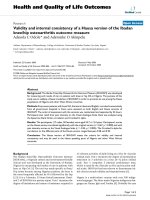
avoid the nodal penetration problem (Figure 4). The
mesh pattern was kept the same in all the contacting areas
(outer surface of the femoral head-liner front side and
liner back-side and acetabular shell) so that, the nodes
placed in the contacting surfaces do not interfere with the
target area. A cross section of the liner, acetabular shell
and femoral head were first meshed due to axial symmet-
ric conditions of the model. Planar elements were then
used having perfect control of the shape of the elements.
The planar elements were revolved with a specific angle
creating a polar mesh design. The angle of revolution was
chosen to avoid singularities that can occur when hexahe-
dron elements are converted to tetrahedron elements
[14].
A linear isotropic material was chosen to model the
UHMWPE liner for the proposed experiment. For a study
of wear and fatigue a non linear material will be more
appropriate. The material properties of the liner were
based on the information obtained in the available litera-
ture [15], where the Young's Modulus = 975 MPa, and
Poisson's Ratio = 0.46. A rigid material was chosen for the
acetabular shell and the femoral head components
A linear contact between implant components was mod-
eled using an automatic surface-to-surface contact (ASTS).
The acetabular shell was fully constrained, assuming a
rigid union between the acetabular shell and the acetabu-
Modular Acetabular components set-up and LVDT sensors' positioningFigure 2
Modular Acetabular components set-up and LVDT sensors'
positioning.
Experiment set-upFigure 1
Experiment set-up. Orientation of the acetabular compo-
nents (acetabular shell, liner and femoral head) with respect
to applied load.
Finite Element Model of the acetabular shell, liner and femo-ral headFigure 3
Finite Element Model of the acetabular shell, liner and femo-
ral head. The liner locking mechanism was simulated con-
straining all degrees of freedom of the nodes located at the
same positions as locking tabs of the real-life liner.
Contacting areas (Acetabular Shell/liner and Liner/femoral head) involved in the Finite Element ModelFigure 4
Contacting areas (Acetabular Shell/liner and Liner/femoral
head) involved in the Finite Element Model.
Journal of Orthopaedic Surgery and Research 2007, 2:7 />Page 4 of 9
(page number not for citation purposes)
Table 2: Material Properties
Component N° element FEM mat. Actual mat.
Femoral Head 501 Rigid Cobalt-Chrome
Liner 1799 E = 975 MPa
ν = 0.46
ρ = 960 Kg/m
3
UHMWPE
Acetabular Shell 720 Rigid Titanium
Comparison between the material properties Finite Element model and real-life components material properties.
Table 1: Loading profile applied to each liner specimen.
Loading case Speed (mm/min) Cycles Maximum Load (N)
1 5 20 250
2 5 20 350
3 5 20 450
4 5 20 550
5 5 20 650
6 5 20 750
7 5 20 850
8 5 20 950
95201050
10 5 20 1150
11 5 20 1250
12 5 20 1350
13 5 20 1450
14 5 20 1550
15 5 20 1650
16 5 20 1750
17 5 20 1850
18 5 20 1950
19 5 20 2050
20 5 20 2150
21 5 20 2250
22 5 20 2350
23 5 20 2450
24 5 20 2550
25 10 25 2650
26 10 25 2750
27 10 25 2850
28 10 25 2950
29 10 25 3050
30 10 25 3150
31 10 25 3250
32 10 25 3350
33 10 25 3500
34 10 25 3750
35 10 25 4000
36 10 25 4250
37 10 25 4500
38 10 25 4750
39 10 25 5000
40 10 25 6000
41 0.5 2 10000
TOTAL 882
In each loading case the load range applied goes from 0 N to the maximum load specified for each loading case.
Journal of Orthopaedic Surgery and Research 2007, 2:7 />Page 5 of 9
(page number not for citation purposes)
lum. The femoral head was constrained with respect to the
rotational degrees of freedom. Perfect conformity between
femoral head and liner as well as between liner and
acetabular shell was assumed. Anti-rotation features such
as the equatorial locking tabs provide the greatest restraint
to keep the liner in the proper position within the shell
[16]. When load is applied to a modular acetabular com-
ponent with locking constraints, the liner locking tabs
share the greater part of the applied load. In order to sim-
ulate the six locking equatorial tabs of the liner, a total of
twelve nodes of the liner FE model were fully constrained
(Figure 3).
2.4. FE validation
A similar loading profile to the one used in the experi-
ment was created in ANSYS/LS-DYNA in order to validate
the experimental results in terms of stability/micromotion
of the liner. The load was applied at the center of the fem-
oral head and varied from no load up to 1775 N applied
linearly. The maximum load was based on previous stud-
ies in gait [17-21] where the hip joint forces were evalu-
ated. In order to reproduce the experimental conditions as
closely as possible both the orientation of the applied
load (vertical) and the position of the acetabular compo-
nent (45° inclination) were the same in the computer
model and the experiment set-up. (Figure 5)
Published reports of the friction coefficient between the
metal and polyethylene ranged from μ = (0.083 to 0.2).
[[15],15a] The finite element model was run with friction
coefficient values that varied between the given range and
results of the FE with the minimum and maximum coeffi-
cient of friction were used to compare the analytical solu-
tion with the experimental data. Further discussion is
provided in the section below.
Results
Figure 6 shows the micromotion measured for each of the
seven liner specimens studied. Each graph corresponds to
one liner specimen. The six curves in each graph represent
the maximum micromotion achieved for each of the six
LVDT sensors. The maximum physiological loads experi-
enced in hip are within a range of 1700 to 2200 N. As
described in this study, the maximum load applied to
each liner specimen during the validation experiment was
10,000 N, which is beyond the attainable force between
the acetabular liner and the femoral head in the body. The
objective of carrying the experiment beyond 2200 N is to
investigate how the liner responds to higher loads and
whether there is drastic change in deformation (plastic
deformation) where certain peak forces are achieved.
As described previously, a loading profile, similar to the
one in the experiment, was used in the FE model. Accord-
ing to the experimental set-up, the micromotion results
corresponded to six specific points, where the sensors' tips
came in contact with the liner. The corresponding points
were identified in the FE model. Because the LVDT sensors
only measure displacements along their longitudinal axes,
those directions were identified with simple trigonomet-
ric calculation in the FE model through superposition of
the experimental axes. The micromotions (displace-
ments) were computed in the FE model of the nodes posi-
tioned at the reference points, along the identified
direction.
Figures 7 and 8 indicate the maximum and minimum
deformation (micromotion) values, for all the seven lin-
ers analyzed, where each sensor was compared to the
result obtained with the finite element model. The FE
model results are shown for two values of coefficient of
friction (μ = 0.2 and μ = 0.083). As expected, the sensors
positioned perpendicular to the outer flat surface of the
liner recorded the most significant micromotion. This is
attributed to the fact that this is the direction along which
the liner is less constrained. The three sensors positioned
perpendicularly to the side of the liner recorded very little
micromotion. This micromotion was produced because
of local deformations from the bulging effect of the poly-
ethylene when subjected to compressive loads.
Coordinate system used as a reference for the loads in the FE modelFigure 5
Coordinate system used as a reference for the loads in the
FE model. The CS is shown with respect to the acetabular
shell inclination angle.
Journal of Orthopaedic Surgery and Research 2007, 2:7 />Page 6 of 9
(page number not for citation purposes)
Maximum micromotions achieved for each of the seven liner specimen analyzedFigure 6
Maximum micromotions achieved for each of the seven liner specimen analyzed.
SPECIMEN 7:
0
20
40
60
80
100
120
250
45
0
65
0
85
0
105
0
12
5
0
14
5
0
165
0
185
0
20
5
0
22
5
0
245
0
2
65
0
28
5
0
30
5
0
325
0
3
50
0
40
0
0
45
0
0
500
0
1
00
00
Load (N)
Micromotion (um)
0-RED
1-ORANGE
2-YELLOW
3-GREEN
4-BLUE
5-PURPLE
SPECIMEN 4:
0
20
40
60
80
100
120
250
4
5
0
6
5
0
85
0
1050
1
2
5
0
1
4
5
0
16
5
0
185
0
2
0
5
0
2
2
5
0
24
5
0
265
0
2
8
5
0
30
5
0
32
5
0
350
0
4
0
0
0
45
0
0
500
0
1000
0
Load (N)
Micromotion (um)
0-RED
1-ORANGE
2-YELLOW
3-GREEN
4-BLUE
5-PURPLE
SPECIMEN 5:
0
20
40
60
80
100
120
2
5
0
45
0
65
0
8
5
0
1
05
0
125
0
145
0
1
65
0
18
5
0
205
0
225
0
2
45
0
26
5
0
285
0
305
0
3
25
0
35
0
0
400
0
450
0
5
00
0
10
0
0
0
Load (N)
Micromotion (um)
0-RED
1-ORANGE
2-YELLOW
3-GREEN
4-BLUE
5-PURPLE
SPECIMEN 6:
0
20
40
60
80
100
120
2
5
0
45
0
65
0
8
5
0
1
05
0
1
2
5
0
1
45
0
1
65
0
1
8
5
0
2
05
0
2
25
0
2
45
0
265
0
2
85
0
3
05
0
325
0
3
50
0
4
00
0
4
5
0
0
5
00
0
1
000
0
Load (N)
Micromotion (um)
0-RED
1-ORANGE
2-YELLOW
3-GREEN
4-BLUE
5-PURPLE
SPECIMEN 1:
0
20
40
60
80
100
120
2
5
0
4
5
0
6
5
0
8
5
0
1
0
5
0
1
2
5
0
1
4
5
0
1
65
0
1
8
5
0
2
0
5
0
2
25
0
2
4
5
0
2
6
5
0
2
85
0
3
0
5
0
3
2
5
0
3
50
0
4
0
0
0
4
5
0
0
5
00
0
1
0
00
0
Load (N)
Micromotion (um)
0-RED
1-ORANGE
2-YELLOW
3-GREEN
4-BLUE
5-PURPLE
SPECIMEN 2:
0
20
40
60
80
100
120
25
0
4
5
0
6
5
0
85
0
105
0
1
2
5
0
1
4
5
0
16
5
0
1
85
0
2
0
5
0
2
2
5
0
24
5
0
2
65
0
2
8
5
0
30
5
0
32
5
0
35
0
0
4
0
0
0
45
0
0
500
0
10
0
0
0
Load (N)
Micromotion (um)
0-RED
1-ORANGE
2-YELLOW
3-GREEN
4-BLUE
5-PURPLE
SPECIMEN 3:
0
20
40
60
80
100
120
2
5
0
4
5
0
6
5
0
8
5
0
1
05
0
1
25
0
1
4
5
0
1
65
0
1
85
0
2
0
5
0
2
25
0
2
45
0
2
65
0
2
85
0
3
05
0
3
25
0
3
5
0
0
4
00
0
4
50
0
5
00
0
1
000
0
Load (N)
Micromotion (um)
0-RED
1-ORANGE
2-YE LLOW
3-GREE N
4-BLUE
5-PURP LE
Journal of Orthopaedic Surgery and Research 2007, 2:7 />Page 7 of 9
(page number not for citation purposes)
In all the experimental data collected from the seven spec-
imens the result obtained in the FE model, for both fric-
tion coefficients, are between the maximum and
minimum values obtained in the experiment. This is a
first check on the validity of the model and its analytical
prediction. Considering the average values for the experi-
ment results (based on the maximum and minimum
micromotion values collected for each load), the FE
model with the lowest value of showed a closer fit and
depicts a more realistic response. When modeling con-
formity it is important to note that the actual liner and cup
do not possess such a characteristic, in fact there are gaps
due to the geometrical difference of the two components.
These clearances will make the friction between the liner
and the cup less pronounced; hence a relaxed value in the
FE model is more appropriate. Our validation supports
such a scenario.
Discussion
This study highlights two main points. One the experi-
ment provides an insight into the stability and micromo-
tion of the liner/cup interface. Indeed it provides the
means by which we can quantify the micromotion/load
interface in relation to the liner and locking mechanism
designs. Second these experiments along with the FE
model becomes an important tool in identification of
weak spots and areas where both stress and wear can be
identified. The objective of this research while focused on
several specimens the design of the locking mechanism of
the liner with respect to the cup is the same. In future stud-
ies we intend to perform a much larger study where differ-
ent locking mechanisms designs can be compared under
different loads and moments.
The current investigation has prompted us to suggest areas
where we can improve both the FE model as well as learn-
ing further how the liners designs affect the results of
micromotion and wear. These include: the conformity of
the contact surfaces, geometry and tolerances of the CAD
model, representation of the liner locking mechanism and
material properties. Conformity allows distribution of
load more along the equatorial surface of the load and
might increase back wear when the material expand and
slide along the surface at he interface of the cup/liner. The
conformity might also play a significant role in load trans-
fer to the cup and hence changing the micromotion con-
dition at the cup/bone interface. The cup bone interface is
a subject of another investigation currently being con-
ducted at our Laboratory.
The results of the validation show that the correlation of
the micromotion data given by the FE model and the
experimental data depend upon the position of each sen-
sor. The sensors positioned along the flat surface of the
liner recorded values that closely matched the model.
Among those three sensors, the one positioned further to
the axis of application of the load registered the best
results. The other two sensors positioned in the flat sur-
face of the liner (red and purple) matched closely the
results only in the load ranges between 1500 N and 1750
N. Furthermore, the results obtained for the three sensors
positioned perpendicularly to the flat surface of the liner
Maximum and minimum micromotions values, among all the specimens analyzed, recorded for each sensorFigure 7
Maximum and minimum micromotions values, among all the
specimens analyzed, recorded for each sensor. Comparison
with the results obtained with the FE model considering two
different friction coefficients.
RED LVDT sensor:
0
10
20
30
40
50
60
250 350 450 550 650 750 850 950 1050 1150 1250 1350 1450 1550 1650 1750
Load (N)
Micromotion (um)
MAX
MIN
m = 0.083
m = 0.2
GREEN LVDT sensor:
0
10
20
30
40
50
60
250 350 450 550 650 750 850 950 1050 1150 1250 1350 1450 1550 1650 1750
Load (N)
Micromotion (um)
MAX
MIN
m = 0.083
m = 0.2
ORANGE LVDT sensor:
0
10
20
30
40
50
60
250 350 450 550 650 750 850 950 1050 1150 1250 1350 1450 1550 1650 1750
Load (N)
Micromotion (um)
MAX
MIN
m = 0.083
m = 0.2
Journal of Orthopaedic Surgery and Research 2007, 2:7 />Page 8 of 9
(page number not for citation purposes)
are in the same range of the values obtained from the
experiment. Therefore, it is clear that the sensors subjected
to higher bulging/deformation showed a slight deviation
from those in the FE model. These variations might be a
consequence of the assumptions made in selection of pol-
yethylene material. A more precise material model would
certainly describe the bulging effects more accurately. For
example a more accurate description of the material used
in the model would be a piecewise linear isotropic plastic-
ity material [16]. This planned in our future research
development.
Another important assumption made in the model is the
treatment of the liner's locking tabs. As describe earlier,
the locking tabs were simulated constraining all the
degrees of freedom of the nodes placed in the same posi-
tion as the actual locking tabs. This assumption states that
the nodes simulating the locking tabs were completely
fixed (constrained) to the acetabular shell and may induce
high stress concentration areas. In reality those tabs are
designed to have significant gap around them when the
liner is fully seated. Surely this factor might permit a more
even stress distribution in the elements surrounding the
constrained nodes of the locking tabs. This might result in
a smaller peak stress values at the nodes.
The last hypothesis considered in the present study is con-
cerned with the conformity of the contact areas. Perfect
conformity was assumed between liner's backside and
acetabular shell inner-surface and between liner's front-
side surface and femoral head. In the actual acetabular
components certain gaps are allowed between contacting
surfaces for both design and manufacturer tolerances. The
stress distributions and micromotions achieved in the
liner might be different if those gaps were considered and
the results obtained might be closer than the one obtained
in this study.
Conclusion
The objective of the present study was to validate a FE
model of modular acetabular prosthesis with data col-
lected experimentally. The model is preliminary and gives
a reasonable approximation of values of micromotion
obtained experimentally. Further work is needed to
enhance the model development and improve the accu-
racy of the model.
Abbreviations
E (Young Modulus): MPa
Kg (Kilogram): Unit of mass (SI)
m (meter): Unit of Length (SI)
MPa (Mega Pascal): Unit of Pressure (SI)
N (Newton): Unit of Force (SI)
min (minute): Unit of Time equal to 60 seconds.
mm (millimeter): Unit of Length equal to one 10
-3
meters.
sec (Second): Unit of Time (SI)
Maximum and minimum micromotions values, among all the specimens analyzed, recorded for each sensorFigure 8
Maximum and minimum micromotions values, among all the
specimens analyzed, recorded for each sensor. Comparison
with the results obtained with the FE model considering two
different friction coefficients.
YELLOW LVDT sensor:
0
10
20
30
40
50
60
250 350 450 550 650 750 850 950 1050 1150 1250 1350 1450 1550 1650 1750
Load (N)
Micromotion (um)
MAX
MIN
m = 0.083
m = 0.2
BLUE LVDT sensor:
0
10
20
30
40
50
60
250 350 450 550 650 750 850 950 1050 1150 1250 1350 1450 1550 1650 1750
Load (N)
Micromotion (um)
MAX
MIN
m = 0.083
m = 0.2
PURPLE LVDT sensor:
0
10
20
30
40
50
60
250 350 450 550 650 750 850 950 1050 1150 1250 1350 1450 1550 1650 1750
Load (N)
Micromotion (um)
MAX
MIN
m = 0.083
m = 0.2
Publish with BioMed Central and every
scientist can read your work free of charge
"BioMed Central will be the most significant development for
disseminating the results of biomedical research in our lifetime."
Sir Paul Nurse, Cancer Research UK
Your research papers will be:
available free of charge to the entire biomedical community
peer reviewed and published immediately upon acceptance
cited in PubMed and archived on PubMed Central
yours — you keep the copyright
Submit your manuscript here:
/>BioMedcentral
Journal of Orthopaedic Surgery and Research 2007, 2:7 />Page 9 of 9
(page number not for citation purposes)
μ (mu): Friction Coefficient (Unit-less)
μm (micron):Unit of Length equal to 10
-6
meters
ρ (rho): Symbol for density. Density units Kg/m
3
ν (nu): Poisson's ratrio (Unit-less)
Acknowledgements
Todd Render and Paul Lewis, DePuy (Johnson and Johnson), Warsaw, Indi-
ana.
This experiment was supported in part from unrestricted research funds
from DePuy.
Jeff Goldstein. University of Illinois at Chicago. Lab Assistant.
References
1. Mow VC, Hayes WC: Basic Orthopedics Biomechanics Volume 11. Lip-
pincott-Raven Publishers, Philadelphia; 1997:395-460.
2. Charnley J: Low Friction Arthroplasty of the Hip: Theory and Practice
Springer, Berlin; 1979.
3. Barrack RL, Folgueras A, Munn B, Tvetden D, Sharkey P: "Pelvis
Lysis and Polyethylene Wear at 5–8 Years in an Uncemented
Total Hip". Clinical Orthopeadics 1997, 335:211-217.
4. Dowdy PA, Rorabeck CH, Bourne RB: "Uncemented total hip
arthroplasty in patients 50 years of age or younger". Journal
of Biomechanics 1997, 12:853-862.
5. Schamalzried TP, Guttmann D, Grecula M, Amstutz HC: "The rela-
tionship between the design, position and articular wear of
acetabular components inserted without cement and the
development of pelvic osteolysis". Journal of Bone Joint Surgery
American 1994, 76:677-688.
6. Harris WH: "The problem is Osteolysis". Clinical Orthopedics
1995, 311:46-53.
7. Lombardi AV, Mallory TH, Dennis DA, Komistek RD, Fada RA,
Northcut EJ: "An In Vivo Determination of Total Hip Arthro-
plasty Pistoning During Activity". The Journal of Arthroplasty
2000, 15:702-709.
8. Dennis DA, Komisteck RD, Northcut EJ, Ochoa JA, Ritchie A: "In
Vivo determination of hip joint separation and the forces
generated due to impact loading conditions". Journal of Biome-
chanics 2001, 34:623-629.
9. Illgen R, Rubash HE: "The Optimal Fixation of the Cementless
Acetabular Component in Primary Total Hip Arthroplasty".
Journal American Academy of Orthopedic Surgeons 2002, 10:43-56.
10. Bartel DL, Burstein AH, Toda MD: "The effect of conformity and
plastic thickness on contact stress in metal-backed plastic
implants". Journal of Biomechanical Engineering 1985, 107:193-199.
11. Saikko V, Calonius O: "Slide track analysis of the relative
motion between femoral head and acetabular cup in walking
and in hip simulators". Journal of Biomechanics 2002, 35:455-464.
12. Kurtz SM, Ochoa JA, Hovey CB, White CV: " Simulation of initial
frontside and backside wear rates in a modular acetabular
component with multiple screw holes".
Journal of Biomechanics
1999, 32:967-976.
13. Spears IR, Pleiderer M, Schneider E, Hille E, Morlock MM: "The
effect of interfacial parameters on cup-bone relative micro-
motion. A finite element investigation". Journal of Biomechanics
2001, 34:113-120.
14. Teoh SH, Chan WH, Thampuran R: "An elasto-plastic finite ele-
ment model for polyethylene wear in total hip arthroplasty".
Journal of Biomechanics 2002, 35:323-330.
15. Kurtz SM, Edidin AA, Bartel DL: "The role of backside polishing,
cup angle, and polyethylene thickness on the contact
stresses in metal-backed acetabular components". Journal of
Biomechanics 1997, 30:639-642 [ />ucts/ramex_properties.html#RAMEXEX].
16. Kurtz SM, Ochoa JA, White CV, Srivastav S, Cournoyer J: "Backside
nonconformity and locking restrains affect liner/shell load
transfer mechanism and relative motion in modular acetab-
ular components for total hip replacement". Journal of Biome-
chanics 1998, 31:431-437.
17. Bergmann G, Graichen F, Rohlman A, Linke H: "Hip Joint Forces
During Load Carrying". Journal of Clinical Orthopedics 1997,
335:190-201.
18. Brand RA, Pedersen DR, Davy DT: "Comparison of hip force cal-
culations and measurements in the same patient". The Journal
of Arthroplasty 1994, 9:45-51.
19. Morlock M, Sheneider E, Blumh A, Vollmer M, Bergmann G, Muller V,
Honl M: "Duration and frequency of every day activities in
total hip patients". Journal of Biomechanics 2001, 34:873-881.
20. Bergmann G, Deuretzbacher G, Heller M, Graichen F, Rohlmann A,
Strauss J, Duda GN: "Hip contact forces and gait patterns from
routine activities". Journal of Biomechanics 2001, 34:859-871.
21. Ipavec M, Brand RA, Pedersen DR, Mavcic B, Kralj-Iglic V, Iglic A:
"Mathematical modeling of stress in the hip during gait".
Journal of Biomechanics 1999, 32:1229-1235.