báo cáo hóa học:" Development of an in vitro three dimensional loading-measurement system for long bone fixation under multiple loading conditions: a technical description" potx
Bạn đang xem bản rút gọn của tài liệu. Xem và tải ngay bản đầy đủ của tài liệu tại đây (1.64 MB, 11 trang )
BioMed Central
Page 1 of 11
(page number not for citation purposes)
Journal of Orthopaedic Surgery and
Research
Open Access
Technical Note
Development of an in vitro three dimensional
loading-measurement system for long bone fixation under multiple
loading conditions: a technical description
John C Janicek*, William L Carson and David A Wilson
Address: From the University of Missouri Comparative Orthopaedic Laboratory, 379 East Campus Drive, Columbia, MO, 65211, USA
Email: John C Janicek* - ; William L Carson - ; David A Wilson -
* Corresponding author
Abstract
The purpose of this investigation was to design and verify the capabilities of an in vitro loading-
measurement system that mimics in vivo unconstrained three dimensional (3D) relative motion
between long bone ends, applies uniform load components over the entire length of a test
specimen, and measures 3D relative motion between test segment ends to directly determine test
segment construct stiffness free of errors due to potting-fixture-test machine finite stiffness.
Intact equine cadaveric radius bones, which were subsequently osteotomized/ostectomized and
instrumented with bone plates were subjected to non-destructive axial, torsion, and 4-point
bending loads through fixtures designed to allow unconstrained components of non-load
associated 3D relative motion between radius ends. 3D relative motion between ends of a 50 mm
long test segment was measured by an infrared optical tracking system to directly determine its
stiffness. Each specimen was then loaded to ultimate failure in either torsion or bending. Cortical
bone cross-section diameters and published bone biomechanical properties were substituted into
classical mechanics equations to predict the intact test segment theoretical stiffness for comparison
and thus loading-measurement system verification.
Intact measured stiffness values were the same order of magnitude as theoretically predicted. The
primary component of relative motion between ends of the test segment corresponded to that of
the applied load with the other 3D components being evident and consistent in relative magnitude
and direction for unconstrained loading of an unsymmetrical double plate oblique fracture
configuration. Bone failure configurations were reproducible and consistent with theoretically
predicted.
The 3D loading-measurement system designed: a) mimics unconstrained relative 3D motion
between radius ends that occurs in clinical situations, b) applies uniform compression, torsion, and
4-point bending loads over the entire length of the test specimen, c) measures interfragmentary 3D
relative motion between test segment ends to directly determine stiffness thus being void of
potting-fixture-test machine stiffness error, and d) has the resolution to detect differences in the
3D motion and stiffness of intact as well osteotomized-instrumented and ostectomized-
instrumented equine radii.
Published: 24 November 2007
Journal of Orthopaedic Surgery and Research 2007, 2:21 doi:10.1186/1749-799X-2-21
Received: 21 May 2007
Accepted: 24 November 2007
This article is available from: />© 2007 Janicek et al; licensee BioMed Central Ltd.
This is an Open Access article distributed under the terms of the Creative Commons Attribution License ( />),
which permits unrestricted use, distribution, and reproduction in any medium, provided the original work is properly cited.
Journal of Orthopaedic Surgery and Research 2007, 2:21 />Page 2 of 11
(page number not for citation purposes)
Background
Biomechanical studies that appear in the literature typi-
cally use fixtures that constrain some components of rela-
tive 3D motion between ends of the test specimen, other
than in the direction of loading, and/or do not apply a
uniform component of load over the instrumented length
of the specimen [1-8], and use test machine ram displace-
ment to determine stiffness without correcting for pot-
ting-fixture-test machine (PFT) stiffness error
[1,2,4,6,7,9]. Direct measurement of relative 3D interfrag-
mentary motions during in vitro testing has been per-
formed [5,7,10-12], including those that have eliminated
PFT stiffness [11,12]. In vivo 3D interfragmentary
motions have been measured using a transducer telemetry
system [13], a motion capture system [6,7,9], and a 3D
optical tracking system [14]. To the authors' knowledge,
combined use of 3D unconstrained fixtures with 3D opti-
cal tracking of test segment ends to eliminate PFT stiffness
error has not appeared in human or veterinary literature.
The purpose of the investigation described in this paper
was to design and verify the capabilities of an in vitro
loading-measurement system that: 1) mimics in vivo
unconstrained relative 3D motion between fracture-
model (herein after referred to as "fracture") segments of
long bone ends, 2) applies uniform compression, torsion,
or bending moment loads over the entire length of the test
specimen, 3) measures 3D relative motion between test
segment ends to directly determine 3D stiffness compo-
nents of intact and instrumented test segments, and 4)
identifies the weakest aspects of an instrumented speci-
men during increased uniform loading over its entire
length. The ultimate goal was to use this loading-measure-
ment system to measure and compare the relative 3D bio-
mechanical characteristics of intact and two Association
for the Study of Internal Fixation (ASIF) techniques for
repair of an oblique fracture involving the distal (inferior)
diaphysis of an equine radius.
Methods
Loading fixture design, and potting
Proximal (superior) and distal steel box type loading fix-
tures were designed to compliment application of ASIF
devices along the distal aspect of the lateral and cranial
(anterior) radius surfaces with at least a 0.5 cm distance
from potting material, and to have sufficient bone-potting
interface to transmit loads to failure of the instrumented
test segment.
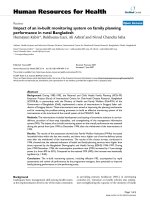
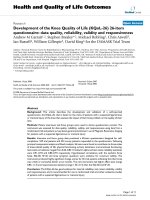
A potting jig was designed to align and hold the proximal
and distal loading fixtures and the radius during potting
(Figure 1). The long axis of the radius was aligned by
locating the major and minor diameter periosteal surfaces
equidistance from the sides of the fixtures at two cross sec-
tions, one 10 cm from the distal end of the radius and the
other being 10 cm proximal to it. This placed the long axis
of the radius coincident with the center of the spherical
socket centrally located in the proximal and distal loading
fixtures. To help secure the radius to the fixtures during
application of bending moments, a cranial-to-caudal
(CrCa) directed steel stud was passed through slots in the
loading fixture sides and a hole drilled through the medial
side of both ends of the radius. The ends of the radius
were potted by using a mixture by volume of 70% lime-
stone (screened 0.32 to 0.64 cm) and 30% dry polymeth-
ylmethacrylate (PMMA) powder (Technovit, Jorgenson
Laboratories, Loveland, CO) wetted with methacrylate
monomer to make pourable slurry.
Using potting jig uprights as a reference, center lines were
drawn on four orthogonal surfaces of the radius. The pro-
posed fracture plane was marked from a point 4 cm prox-
imal to the lateral styloid process to a point 12 cm
proximal to the medial styloid process. Cross section ends
of the 50 mm long test segment were located and marked
at the level of the fracture plane's center and 50 mm prox-
imal to it. A hole was drilled and tapped (#8–32 thread)
Steel box-type loading fixtures placed within potting jig, CrCa view of radiusFigure 1
Steel box-type loading fixtures placed within potting jig,
CrCa view of radius.
Journal of Orthopaedic Surgery and Research 2007, 2:21 />Page 3 of 11
(page number not for citation purposes)
into the dorsomedial cortex of right radii and the pal-
maromedial cortex for left radii to securely mount a 3D
optical measuring system rigid body to each end of the
test segment (Figure 2).
Unconstrained 3D loading system design
An Instron 8821S (Instron, 100 Royall Street, Canton,
MA) biaxial loading frame equipped with a 25 kN axial, ±
225 Nm torque load cell was used along with the loading
fixtures described below to apply a 3D component of load
uniformly over the length of the radius. Position control
was used to move the global component at a constant rate
of relative displacement between radius ends that corre-
sponded to the applied load component. Assuming negli-
gible friction in the lubricated joints, the fixtures were
designed to produce no external constraints on the
remaining (out of 6 total) 3D components of proximal
relative to distal end displacement of the radius (herein
after called "unconstrained"). The weight of the radius
and fixtures were assumed to be negligible compared to
the applied loads.
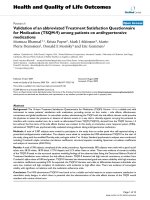
Axial compression
Axial compression was applied through hardened 25.4
mm diameter steel spheres centrally located in the end of
each loading fixture base (Figure 2). Because of freedom
of rotation of both ends about the sphere joints, there
were no external constraints on proximal relative to distal
end of radius: lateral-to-medial (LM) and CrCa transla-
tion (shear); and axial, LM and CrCa bending rotations.
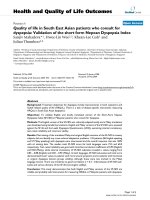
Torsion
Torsion was applied by transmitting equal but opposite
direction components of tangential force to hardened
steel shoulder bolts attached to the lateral and medial
sides of each fixture on a common axis through the center
of the centrally located sphere (Figure 3). An axial bias
load could simultaneously be applied through the hard-
ened steel sphere, which was free to move in a CrCa spher-
ical slot in each fixture base. Because of freedom of LM
and CrCa rotation of both ends about the sphere joints,
there were no external constraints on proximal relative to
distal end of radius: LM and CrCa translation; and LM and
CrCa bending rotations.
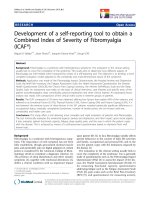
4-point bending
Sections of 15.2 cm diameter (0.64 cm wall thickness)
steel pipe were bolted with shims using the shoulder bolt
holes to each fixture base (Figure 4), and stiffened with
miniature screw type jacks placed in the plane of loading.
Four-point bending forces were applied on the pipe 10 cm
apart through transversely oriented 0.64 cm diameter
hardened steel surfaces. The inner load application sur-
faces were attached to an arm equidistance from its pivot,
thus creating equal inner forces regardless of how or
where the test radius deformed and/or failed. This created
a 34 cm length of radius plus potted ends subject to a uni-
form bending moment (Figure 5). The pipe allowed the
specimen-fixture assembly to be rotated 90 degrees about
its longitudinal axis to load the radius in LM, CrCa,
medial-to-lateral (ML), and caudal-to-cranial (CaCr)
bending. Assuming no friction between pipe and trans-
verse loading surfaces, there were no external constraints
on proximal relative to distal end of radius: axial, LM and
CrCa translation; axial rotation, and bending rotation
transverse to the plane of loading.
3D relative inter-fragmentary motion measurement
system
3D motion of the ends of the 50 mm long test segment
were measured as load was applied by using a 0.01 mm
resolution 3D infrared close focus Certus optical tracking
system (NDI Optotrak, Waterloo, Ontario, Canada) to
follow the light emitting diodes (LEDs) in the PVC rigid
Axial compression (F) applied through hardened steel spheresFigure 2
Axial compression (F) applied through hardened steel
spheres. This allowed unconstrained 3D relative movement
of the test specimen ends, and produced uniform load over
the entire length of the specimen. Insert: view of hardened
steel sphere in each loading fixture base during axial com-
pression.
Journal of Orthopaedic Surgery and Research 2007, 2:21 />Page 4 of 11
(page number not for citation purposes)
bodies attached at each end of the test segment using a
#8–32 machine screw (Figure 2). A third rigid body was
attached to a reference block on the base of the testing
machine. The reference block had three miniature conical
indentations located at known distances from the test
machine's Z axis: one at the origin and one each on mutu-
ally perpendicular global X and Y axes. A 0.1 mm diameter
tip portable digitizing probe was used to digitize the loca-
tion of the three indentations on the reference block to
define a global XYZ coordinate system, and 5 predeter-
mined points around the fracture plane: one on each side
of the lateral plate, one adjacent to cranial plate, and one
each on the medial and caudal surface centerlines. Point
digitization was done after each specimen was mounted
in torsion fixtures with the medial side in the X direction.
The digitized points and the optical tracking system's soft-
ware was then used to define a local xyz
d
orthogonal coor-
dinate axes associated with the rigid body attached at the
distal end of the 50 mm long test segment, z
d
coincident
with the radius' axis and x
d
in the medial direction. Simi-
larly, a local xyz
p
coordinate axes was defined and associ-
ated with the rigid body attached at the proximal end. The
local axes remained oriented with respect to and attached
to the distal and proximal rigid bodies, thus tracking the
3D position of the radius' cross section at each end of the
4-point CrCa bendFigure 5
4-point CrCa bend. Test specimen rotated 90 degrees about
its longitudinal axis in the 4-point loading apparatus to pro-
duce CrCa bend. Four-point bending loads are applied 10 cm
apart, leaving the length of the exposed radius plus fixtures
(34 cm) subject to a uniform bending moment (M).
Torsion (T) applied by transmitting equal but opposite com-ponents of force to hardened steel shoulder bolts on the lat-eral and medial side of each fixture, with the option to apply an axial bias load (F)Figure 3
Torsion (T) applied by transmitting equal but opposite com-
ponents of force to hardened steel shoulder bolts on the lat-
eral and medial side of each fixture, with the option to apply
an axial bias load (F). This allowed unconstrained 3D relative
movement of the test specimen ends, and produced uniform
load over the entire length of the specimen. Insert: view of
hardened steel sphere free to move in a CrCa spherical slot
in each loading fixture base keeping the fixture centered LM
while allowing all CrCa components of force to be transmit-
ted through the pair of shoulder bolts.
4-point LM bendFigure 4
4-point LM bend. Sections of 15.2 cm diameter steel pipe are
bolted to each fixture base to which 4-point bending loads
(F) are applied without contacting the bone or bone implants.
Journal of Orthopaedic Surgery and Research 2007, 2:21 />Page 5 of 11
(page number not for citation purposes)
test segment as the specimen was placed in and loaded in
each mode of loading.
Test segment stiffness determination and test system
verification
To verify the capabilities of the 3D loading-measurement
system, the stiffness associated with each mode of loading
was measured for intact radius test segments (n = 20), and
compared to the corresponding stiffness theoretically pre-
dicted with equations of classical mechanics. Each radius
was then osteotomized, instrumented with ASIF tech-
niques, and subjected to the same sequence of rand-
omized 3-cycle non-destructive load tests (n = 20). Eight
osteotomies were then converted to 7 mm ostectomies, re-
instrumented, and subjected to the same sequence of 3-
cycle non-destructive load tests. Representative results of
the intact, osteotomized, and ostectomized tests for each
load mode were compared to each other to determine: if
the measurement system could resolve the primary com-
ponent of 3D motion corresponding to direction of
applied load from the other components, and if it had suf-
ficient resolution to measure the stiffness of intact seg-
ments for comparison to that of fractured segments
secured with different types of internal fixation. Following
the last of these tests, each radius was subjected to either a
1-cycle torsion, LM bend or CrCa bend to failure test. The
location and orientation of the fracture surfaces were
observed and compared to the classical brittle fractures
that would be produced by a pure component of applied
load to help verify that the loading system is indeed apply-
ing the desired "pure" component of load.
Measured stiffness
Each intact radius was subjected to a 3-cycle non-destruc-
tive random sequence of load modes: axial compression,
torsion, and CrCa and LM bending (n = 12), and in addi-
tion CaCr and ML bending (n = 8). Instron's RSBasLab
software was used to apply load at a constant ram dis-
placement rate (0.004 mm/sec axial compression, 0.25
deg/sec torsion, and 0.02 mm/sec bending), with load
limits used to define ends of a cycle (100 to 4000 N axial
compression, ± 50 Nm torsion, and 10 to 150 Nm bend-
ing). The 3D position of the rigid body LEDs were syn-
chronously measured and stored along with the testing
machine's ram position and applied load at sampling
rates of 50 Hz axial, and 100 Hz torsion and bending. NDI
Toolbench software was used to determine the 3D posi-
tion of the proximal end of the test segment relative to the
distal end for each test and to transfer this data along with
applied load into an EXCEL file. EXCEL was used to plot
the 3D components of relative position as a function of
the component of applied load.
The component of relative displacement between test seg-
ment ends was plotted as a function of the corresponding
applied load component. Measured stiffness was deter-
mined as the reciprocal of the slope of a straight line fit to
this data between selected load ranges, typically having
linear data, during the 3rd loading cycle: 200 to 4000 N
for axial compression, 10 to 50 Nm for positive torque, -
10 to -50 Nm for negative torque, 10 to 150 Nm for bend-
ing.
To compare the intact measured radius stiffness results
(herein after called K
3D
) to those published by Hanson et
al. [1] who used ram displacement in determining stiff-
ness values (herein after called K
H
), the following was per-
formed. Hanson et al's [1] axial and torsion tests were
conducted on a 150 mm long test segment, thus the K
3D
results were multiplied by the ratio of test segment lengths
(50 mm/150 mm) to obtain corresponding 150 mm seg-
ment length normalized values (herein after called K
3DN
)
for direct comparison K
H
results. Hanson et al's [1] 4-
point bending tests were conducted with an apparatus
having 11.5 mm between inner force application points
and 101 mm between outer force application points, with
both inner and outer forces applied directly to bone. Han-
son et al. [1] did not report how relative angular displace-
ment between cross sections was determined from the
ram's axial displacement or between which pair of cross
sections. Thus we converted our measured K
3D
values to
those for a uniform bending segment of 11.5 mm and 101
mm by multiplying by the ratio of test segment lengths
(50 mm/11.5 mm) = 4.35 and (50 mm/101 mm) = 0.50
respectively, to determined a range of K
3DN
values within
which K
H
values should theoretically lie.
Theoretical segment stiffness
After testing to failure, each radius was transected 1 cm
distal to the proximal rigid body allowing periosteal and
endosteal cross section major and minor diameters to be
measured with digital calipers. Two cross section shapes,
hollow ellipse and hollow rectangle, were assumed to cal-
culate a range of theoretically predicted stiffness values
that would account for the non-uniform shape of the
radius. The measured cross section diameters and pub-
lished bone biomechanical properties were substituted
into classical mechanics stiffness equations to predict its
compression, torsion and bending stiffness values
(Appendix).
Results
Major periosteal and endosteal cross section diameters
measured 49.8 (± 4.4) mm and 30.5 (± 4.8) mm, respec-
tively, whereas the minor periosteal and endosteal cross
section diameters measured 32.1 (± 1.4) mm and 18.4 (±
1.7) mm, respectively. The mean intact measured K
3D
val-
ues were within the average elliptical to rectangular cross
section theoretical range for axial compression, torsion
and ML bend; and were greater than the highest theoreti-
Journal of Orthopaedic Surgery and Research 2007, 2:21 />Page 6 of 11
(page number not for citation purposes)
cally predicted by a factor of 1.1 for LM bend, 1.3 for CaCr
bend, and 1.5 for CrCa bend (Table 1). The length nor-
malized axial and torsion K
3DN
results were a factor of
19.6 and 7.5 higher, respectively, than the corresponding
K
H
results (Table 2). Likewise, the 101 mm CrCa and LM
bending K
3DN
results were a factor of 8.3 and 10.6 higher
than the corresponding K
H
, respectively; whereas, the 11.5
mm CrCa and LM bending K
3DN
results were a factor of 72
and 92 higher (Table 2). The fixtures allowed components
of 3D motion other than in the direction of loading to
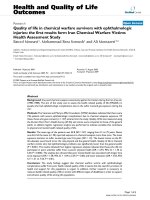
occur. For axial and torsional loading, unconstrained rel-
ative 3D motion across the fracture site was most noticea-
ble for the ostectomy due to definite lack of load sharing
with bone at the fracture site and the unsymmetrical dou-
ble plate construct. The least amount of 3D motion
between ends of the test segment occurred for the intact
radius. This is illustrated in the torsion loading example
which shows detectable CrCa and LM bending rotation
for the ostectomy, and negligible CrCa and LM bending
rotation for the intact radius and the reduced osteotomy
(Figure 6). The loading fixtures during axial and torsion
testing were also observed to have CrCa and LM bending
rotation, which was most prevalent for the ostectomy
model. Relative 3D motion between ends of the test seg-
ment was detected by the optical tracking system for bend-
ing loads which in some cases was visible by the relative
motion across the fracture; however, 3D motion of the
loading fixtures was not readily visible.
Construct failure configurations were consistent with the-
oretical failure modes for brittle material (bone) and
reproducible for both the torsion and bending load to
failure tests. Torsion failure was consistently attributable
to spiral fracture propagation that initiated perpendicular
to the osteotomy or ostectomy at cranial screw holes. LM
and CrCa bend failure initiated by cis-cortex fracturing
through either the proximal or distal screw holes adjacent
to the osteotomy or ostectomy, and progressed perpendic-
ular to the longitudinal axis of the radius; with the excep-
tion of one ostectomy undergoing LM bend to failure
experiencing substantial bone-plate interface separation
due to lateral screw pull out of bone without any bone
fracture. LM and CrCa bends produced visible osteotomy
and ostectomy gap opening on the non-plated side due to
it being in tension, and visible proximal and distal screw
bending adjacent to the osteotomy or ostectomy. ML and
CaCr bending produced visible ostectomy gap closure on
the non-plated side due to it being in compression.
No failures occurred within the potted ends or of the fix-
tures themselves during torsional and bending loads to
failure. No failures occurred through rigid body screw
holes.
Discussion
Measured stiffness (K
sm
) of a long bone specimen is a
function of parameters associated with morphologic/ana-
tomical characteristics (material properties, cross section
size and shape, length) which in turn are influenced by
animal (age, sex, size, breed, diet, and training history),
and parameters associated with testing protocol (speci-
men history/test conditions that effects its material prop-
erties [wet/dry, temperature, time from death to removal
to storage, time in storage], test loading [strain] rate, rela-
tive stiffness of the potting-fixtures-testing machine [K
pft
]
to actual stiffness of the specimen [K
sa
], fixture constraints
Example of the 3D components of rotational displacement between ends of the 50 mm test segment versus applied torque (-50 to +50 Nm): A) intact control, B) osteotomy, and C) ostectomyFigure 6
Example of the 3D components of rotational displacement between ends of the 50 mm test segment versus applied torque (-
50 to +50 Nm): A) intact control, B) osteotomy, and C) ostectomy. Note that the system resolution was capable of distin-
guishing total axial rotation of only 0.25, 0.45, and 2.0 degrees, respectively for these three models with notably less CrCa and
LM bending rotation.
Journal of Orthopaedic Surgery and Research 2007, 2:21 />Page 7 of 11
(page number not for citation purposes)
on the relative 3D motion between specimen ends, and
load range of data used for stiffness calculation). Hanson
et al. [1] considered all but the later three when discussing
why stiffness values from all modes of testing (compres-
sion, torsion, bending) intact equine tibia by McDuffee et
al. [15] were 2.5 to 6 times greater, and contributed this to
McDuffee's greater loading rates. McDuffee et al. [2,15],
Hanson et al. [1], and our compression testing was con-
ducted in position control at constant ram velocity, with
corresponding constant strain rate (ram velocity/exposed
length of tibia or radius) = (0.58, 0.54), 0.00011, and
0.000018 (1/sec). McDuffee's compression strain rates
were 527 and 491 times higher than Hanson's while ours'
was 0.16 times lower. Similarly for torsion, (ram angular
velocity/exposed length of tibia or radius) = (0.058,
0.054), 0.0017, and 0.00114 (deg/[mm*sec]); with
McDuffee's being 34 and 32 times higher than Hanson's
while ours' was 0.67 times lower. A quantitative compari-
son of strain rate for bending is not realistic due to load
[2,15] versus position control [1] used, and that applied
bending moment (strain) rate is not uniform over the
length of a specimen for 3-point bending, ranging from 0
at the outer supports to a maximum at the central load
application point.
Panjabi et al. [16] reported that cortical bone longitudinal
modulus of elasticity increases with increase in strain rate
by a factor of 1.5 for strain rate of 1500 compared to 1.0
(1/sec), thus explaining in part the greater stiffness
observed by McDuffee et al. [2,15] compared to Hanson
et al. [1]. If strain rate were the predominant factor, our
length normalized measured stiffness values should be
Table 2: Comparison of length normalized 3D loading-measurement system mean stiffness (K
3DN
) results to published conventional
test machine load-measurement system stiffness (K
H
) results of intact equine radii. Differences in testing protocols are listed in the
table. To be able to directly compare our 50 mm test segment stiffness (K
3D
) results, they were normalized to comparable values for
test segment lengths used by Hanson et al. [1] by multiplying K
3D
by the ratio of test segment lengths: for axial and torsion (50 mm/
150 mm), and for bending (50 mm/11.5 mm) and (50 mm/101 mm) to produce a range of K
3DN
values within which K
H
should lie.
Mean stiffness (K) of intact equine radius
Axial Compression
(N/mm)
+/-Torsion
(Nm/deg)
CrCa Bend
(Nm/deg)
LM Bend
(Nm/deg)
Measured using: 3D unconstrained fixtures
(3D optical) 34 cm test section 4-point bend, force applied on steel extensions to potted radius ends
3D optical tracking of the 50 mm test segment ends
K
3D
(50 mm test segment) 295000 430/405 1,007 1,680
K
3DN
(150 mm axial & torsion segment)
(11.5 to 101 mm uniform bend segment)
98000 143/135 4378 to 504 7305 to 840
Measured using: Constrained axial compression and torsion fixtures
(Hanson et al.) 1.15 cm test section 4-point bend (10.1 cm between outer force applicators), force applied directly on bone.
Test machine ram displacement
K
H
(150 mm axial & torsion segment)
(11.5 mm between inner, 101 mm between outer 4-point bend force
application points)
5000 18 61 79
Table 1: 3D loading-measurement system verification. Measured intact equine radii stiffness values for selected load ranges of the
third loading cycle were observed to be the same order of magnitude as theoretically predicted values for compression, torsion, and 4-
point bending.
Mean (± SD) stiffness of 50 mm long test segment
Axial Compression
(N/mm)
+ Torsion
(Nm/deg)
- Torsion
(Nm/deg)
CrCa Bend
(Nm/deg)
CaCr Bend
(Nm/deg)
LM Bend
(Nm/deg)
ML Bend
(Nm/deg)
Load Ranges 200 to 4000 N 10 to 50 Nm -10 to -50 Nm 10 to 150 Nm
Measured using: 3D loading-measurement system
Intact Control 295000 (± 130977) +430 (± 49) -405 (± 57) 1007 (± 258) 885 (± 117) 1680 (± 395) 1452 (± 368)
Theoretical using: classical mechanics equations, cross-section measured dimensions, & two shapes
Ellipse
(hollow)
278000 (± 15261) 250 (± 26) 400 (± 49) 879 (± 94)
Rectangle
(hollow)
354000 (± 35277) 556 (± 57) 679 (± 83) 1490 (± 159)
Bone properties assumed: Modulus of Elasticity (E) = 18000 N/mm
2
. Range in literature: (8900 ≤ E ≤ 42000)
Shear Modulus (G) = 4615 N/mm
2
. Range in literature: (3500 ≤ G ≤ 8710)
Journal of Orthopaedic Surgery and Research 2007, 2:21 />Page 8 of 11
(page number not for citation purposes)
lower than or similar to those reported by Hanson et al.
[1], since our strain rates were lower.
The order of magnitude difference in our K
3DN
results
compared to those reported by Hanson et al. [1] is likely
due to their K
pft
being relatively low compared to the K
sa
of the specimen. When using test machine ram displace-
ment to calculate K
sm
of a specimen, ram displacement is
the sum of that due to specimen deflection and PFT
machine deflection, which includes bone crushing when
applying bending loads directly to bone [1]. The theoreti-
cal model is two springs in series [17], one with stiffness
K
sa
the other with K
pft
, resulting in a measured stiffness
K
sm
= K
sa
/(1 + K
sa
/K
pft
). Ideally K
pft
is infinite (rigid PFT),
thus K
sm
= K
sa
. The general rule-of-thumb when using ram
displacement is to have K
pft
≥ 10*K
sa
so that K
sa
≥ K
sm
≥ (1/
1.1) K
sa
and thus error is ≤ 9% when reporting K
sm
for K
sa
.
Assuming K
3DN
= K
sa
and K
H
= K
sm
produces K
sa
/K
sm
ratios
ranging from 7.5 to 19.6, which would require that Han-
son's K
pft
= 0.15 K
sa
to 0.05 K
sa
. This is low but possible;
however, Cowin stated that with many testing machines,
the stiffness of the bone specimen is greater than that of
the load frame [17]. Difference in K
pft
may also have con-
tributed to the higher stiffness reported by McDuffee et al.
[2,15] compared to Hanson et al. [1]. Use of direct meas-
urement of test segment end motion to determine its stiff-
ness is not subject to PFT stiffness error, which is one
reason we selected to use 3D optical tracking and is reason
for using an extensometer when testing for material mod-
ulus of elasticity [17]. The holes drilled in the radius to
mount the LED rigid bodies were at the end cross sections
of the test segment, thus having no effect on its stiffness.
Theoretically, in the absence of friction, the loading fix-
tures presented in this investigation allow 3D uncon-
strained components, of proximal relative to distal end
motion of the radius, other than associated with the
applied load component. Thus during loading, the ends
of the specimen move into a relative 3D position that is
dictated only by the 3D resistance of the (unsymmetrical
or not) instrumented segment to the known (only) com-
ponent of externally applied load such that mechanical
equilibrium is achieved. The bending fixtures are the most
likely to be subject to constraint by friction since the hard-
ened cross bars were observed to indent the unhardened
extension pipe surface during bending load to failure; the
effect of this was reduced by periodically smoothing the
pipe contact surfaces with a file.
Improvements could be made to reduce joint friction by
using rollers incorporated into the 4-point bending load
applicators [18]. Use of a commercially available univer-
sal joint has been reported [4] and was considered but not
used since its pivot center would be several centimeters
above or below the proximal or distal end of the bone
being tested, respectively. Since the applied axial load
remains coincident with the axis through the center of the
universal joints, this would create, as load was increased,
an ever increasing non-physiological lateral displacement
of the plate from the axis of loading and thus bending
moment on the specimen. Our goal was to keep the center
of the spheres as close as possible to the ends of the radius
being tested, so that the line of action of the axial applied
load would remain close to the central point on each end
of the radius. The authors' feel that the loading fixtures
used and described in this manuscript, particularly axial
and torsion, are a significant improvement towards
achieving clinically relevant 3D unconstrained "worst
case" in vivo loading simulation, compared to the fixtures
reported in the literature [1,2,4].
Another advantage of this loading fixture design was that
the same potting of the ends could be used to test a spec-
imen in all three modes of loading: axial compression,
torsion and bending. In addition the bending fixtures
were capable of applying uniform 4-point bending
moment in any transverse plane over the entire length of
the instrumented specimen with no point of load applica-
tion applied directly to bone or instrumentation hard-
ware, and is independent of specimen and fixture cross
section size and material since the center pivot assures
equal forces at the inner application points. Thus the
weakest aspect of an instrumented segment can be
located, in contrast to it being predisposed to be at the
location of the highest applied bending moment [1,2,15].
Also it avoids the problem of applying loads to non-circu-
lar bone cross sections and failure due to bone crushing at
the point of transverse force application [1].
Stiffness is typically determined as the slope of the "linear
portion" of each load versus displacement curve [1,2,15]
leaving the range of data used being subjectively deter-
mined and variable, which can have a notable effect on
the numerical value obtained. To reduce the subjectivity,
we used data over a consistent load range to determine
stiffness for each loading modality. The load range was
selected so that all tests would have a linear load versus
displacement characteristic within the range. Our load
versus test machine ram displacement curves typically had
lower slope during the first loading cycle compared to 2nd
and 3rd loading cycles (the later two being similar), due
to settling of bone-potting-fixture interconnections dur-
ing the first cycle [17]. McDuffee et al. [2,15] and Hanson
et al. [1] obtained stiffness from single cycle to failure
tests, which could be a factor in the variability of and
lower stiffness values observed.
The theoretical stiffness equations are based on the
assumption that cross sections remain plane as load is
applied, and thus corresponding experimental stiffness
Journal of Orthopaedic Surgery and Research 2007, 2:21 />Page 9 of 11
(page number not for citation purposes)
determination depends upon accurate 3D measurement
of the position of these planes. For axial and torsional test-
ing the initial position of the LEDs was pointing directly
towards the 3 camera optical measuring head (Figures 2,
3) but were oriented at approximately 45 degrees for
bending (Figures 4, 5). Accuracy in detecting the location
of individual LEDs is known to deteriorate as their angle
deviates from pointing directly at the measuring head
[19]. This may explain why the average measured axial
and torsional stiffness values were within the predicted
range, while the average measured bending stiffness val-
ues were 0.97 to 1.5 times greater than the largest theoret-
ically predicted stiffness for the four bending modes. This
also might be an explanation for the occasional saw tooth
type characteristic in some bending moment versus rela-
tive angular displacement graphs to which we used regres-
sion to fit a straight line to get the general trend and thus
stiffness. Another possibility is that the single point of
attachment to the radius of each rigid body did not pro-
duce an accurate representation of the 3D motion of the
cross section plane. A recommended option would be to
attach two rigid bodies to a C-ring with three pointed
machine screws to make cortical bone contact at three
points on the cross section plane. This would also elimi-
nate the LED rigid body mounting hole's stress riser and
potential for fracture initiation at this site, which did not
occur in our tests to failure.
Long bone is known to be anisotropic and heterogeneous
(differing in diaphyseal and epiphyseal properties), and is
primarily elastic at low deformation rates [16,17]. The
principal stress is longitudinal for compression and bend-
ing load modes. Published low strain rate longitudinal
modulus of elasticity E determined by machine testing
ranged from 17,000 to 22,600 (N/mm
2
) for human and
bovine femur and tibia [17]. Torsional stiffness is a func-
tion of the longitudinal-circumferential shear modulus G,
with published machine testing determined values rang-
ing from 3300 to 5000 (N/mm
2
) for human and bovine
femur and tibia [17]. Thus use of E = 18,000 and G =
4,615 for the short 50 mm long intact diaphyseal test seg-
ment produced representative theoretical stiffness values
for use as a magnitude accuracy comparison reference.
Conclusion
In conclusion, assuming negligible friction, the 3D load-
ing-measurement system described in this manuscript: a)
mimics unconstrained relative 3D motion between radius
ends that occurs in clinical situations, b) applies uniform
compression, torsion, and 4-point bending loads over the
entire length of the test specimen, c) measures interfrag-
mentary 3D relative motion between test segment ends to
directly determine stiffness thus being void of PFT
machine stiffness error, and d) has the resolution to detect
differences in the 3D motion and stiffness of intact as well
osteotomized-instrumented and ostectomized-instru-
mented equine radii. It is the authors' opinion that the 3D
loading-measuring system described in this manuscript is
capable of creating "worst case" clinically relevant loading
conditions, and accordingly has the capacity to detect
location and type of instrumented segment modes of fail-
ure and has the ability to produce more accurate stiffness
results that are independent of PFT machine stiffness
error.
Appendix
Axial compression stiffness: K
C
= AE/L (N/mm)
(1)
Torsional stiffness: K
T
= (1.745 * 10
-5
)*GK/L (Nm/deg)
(2)
LM & ML bending stiffness: K
LM
= (1.745 * 10
-5
)*EI
yy
/
L(Nm/deg) (3)
CrCa & CaCr bending stiffness: K
CC
= (1.745 * 10
-
5
)*EI
xx
/L (Nm/deg) (4)
where:
D
p
, D
e
= Major diameter periosteal, endosteal
respectively (mm)
d
p
, d
e
= Minor diameter periosteal, endosteal
respectively (mm)
A = Cross section area (mm
2
)
= (π/4) * (D
p
d
p
- D
e
d
e
) for hollow ellipse (5a)
= (D
p
d
p
- D
e
d
e
) for hollow rectangle (5b)
I
yy
= Area moment about y axis (mm
4
)
= (π/64) * (D
p
3
d
p
- D
e
3
d
e
) for hollow ellipse
(6a)
= (1/12) * (D
p
3
d
p
- D
e
3
d
e
) for hollow rectangle
(6b)
I
xx
= Area moment about x axis (mm
4
)
= (π/64) * (D
p
d
p
3
- D
e
d
e
3
) for hollow ellipse
(7a)
= (1/12) * (D
p
d
p
3
- D
e
d
e
3
) for hollow rectangle
(7b)
K = Polar moment type term (mm
4
)
Journal of Orthopaedic Surgery and Research 2007, 2:21 />Page 10 of 11
(page number not for citation purposes)
= (π/16)* [(D
p
3
d
p
)(1-q
4
)]/[D
p
2
+ d
p
2
] for hollow ellipse
(8a)
= (1/12)* [(D
p
d
p
*(D
p
2
+d
p
2
)) - (D
e
d
e
*(D
e
2
+d
e
2
))] for
hollow rectangle (8b)
q = ratio of major endosteal/periosteal diameters = (D
e
/
D
p
)
L = Length of the test segment = 50 mm
E = Cortical bone modulus of elasticity = 18,000 (N/
mm
2
)
Range in literature (8,900 ≤ E ≤ 42,000)
G = Cortical bone shear modulus = 4,615 (N/mm
2
)
Range in literature (3,500 ≤ G ≤ 8,710)
Abbreviations
3D: Three dimensional
ASIF: Association for the Study of Internal Fixation
CaCr: Caudal-to-cranial
CrCa: Cranial-to-caudal
K
3D
: Our intact measured stiffness results
K
3DN
: Our intact 50 mm long segment stiffness results
normalized to Hanson et al test specimen length
K
H
: Hanson et al's ram displacement stiffness values
K
pft
: Potting-fixture-test machine stiffness
K
sa
: Actual stiffness of test specimen
K
sm
: Measured stiffness of test specimen
LM: Lateral-to-medial
LED: Light emitting diode
ML: Medial-to-lateral
PFT: Potting-fixture-test machine
PMMA: Polymethylmethacrylate
xyz
p
: Local orthogonal axes associated with proximal test
segment end
xyz
d
: Local orthogonal axes associated with distal test seg-
ment end
Competing interests
The author(s) declare that they have no competing inter-
ests.
Authors' contributions
JCJ conceived the study, carried out the collection, pot-
ting, implanting, and testing of the specimens, and con-
tributed to the experimental design. WLC designed the
loading-measurement system and tested the specimens.
DAW participated in the experimental design. All authors
read and approved the final manuscript.
Acknowledgements
Supported by the University of Missouri Comparative Orthopaedic Labo-
ratory with financial assistance provided from the E. Paige Laurie Equine
Endowed Program in Lameness and the University of Missouri Department
of Orthopaedic Surgery to purchase the 3D optical tracking system. Pre-
sented in abstract form at the 2
nd
World Veterinary Orthopedic Congress/
33
rd
Annual Conference of the Veterinary Orthopedic Society, Keystone,
CO, 2006.
References
1. Hanson PD, Markel MD, Vanderby R: Diaphyseal structural prop-
erties of equine long bones. Am J Vet Res 1995, 56:233-240.
2. McDuffee LA, Stover SM, Taylor KT: An in vitro biomechanical
investigation of the mechanical properties of dynamic com-
pression plated osteotomized adult equine tibiae. Vet Surg
1997, 26:126-136.
3. Hopper SA, Schneider RK, Ratzlaff MH, White KK, Johnson CH:
Effect of pin hole size and number on in vitro bone strength
in the equine radius loaded in torsion. Am J Vet Res 1998,
59:201-203.
4. Radcliffe RM, Lopez MJ, Turner TA, Watkins JP, Radcliffe CH, Markel
MD: An in vitro biomechanical comparison of interlocking
nail constructs and double plating for fixation of diaphyseal
femur fractures in immature horses. Vet Surg 2001, 30:179-190.
5. Bernardé A, Diop A, Maurel N, Viguier E: An in vitro biomechan-
ical comparison between bone plate and interlocking nail.
Vet Comp Orthop Trauma 2002, 15:57-66.
6. Klein P, Schell H, Streitparth F, Heller M, Kassi JP, Kandziora F,
Bragulla H, Haas NP, Duda GN: The initial phase of fracture
healing is specifically sensitive to mechanical conditions. J
Orthop Res 2003, 21:662-669.
7. Kaspar K, Schell H, Seebeck P, Thompson M, Schütz NP, Duda GN:
Angle stable locking reduces interfragmentary movements
and promotes healing after unreamed nailing. Study of a dis-
placed osteotomy model in sheep tibia. J Bone Joint Surg Am
2005, 87:2028-2037.
8. Higgins TF, Pittman G, Hines J, Bachus KN: Biomechanical analysis
of distal femur fracture fixation: fixed-angle screw-plate con-
struct versus condylar blade plate. J Orthop Trauma 2007,
21:43-46.
9. Schell H, Epari DR, Kassi JP, Bragulla H, Bail HJ, Duda GN: The
course of bone healing is influenced by the initial shear fixa-
tion stability. J Orthop Res 2005, 23:1022-1028.
10. Gardner TN, Evans M, Kyberd PJ: An instrumented special link-
age for monitoring relative three-dimensional motion
between fracture fragments. J Biomech Eng 1996, 118:586-593.
11. Duda GN, Kirchner H, Wilke HJ, Claes L: A method to determine
the 3-D stiffness of fracture fixation devices and its applica-
tion to predict inter-fragmentary movement.
J Biomech 1998,
31:247-252.
12. Kassi JP, Hoffmann JE, Heller M, Raschke M, Duda GN: Evaluating
the stability of fracture fixation systems: mechanical device
Publish with BioMed Central and every
scientist can read your work free of charge
"BioMed Central will be the most significant development for
disseminating the results of biomedical research in our lifetime."
Sir Paul Nurse, Cancer Research UK
Your research papers will be:
available free of charge to the entire biomedical community
peer reviewed and published immediately upon acceptance
cited in PubMed and archived on PubMed Central
yours — you keep the copyright
Submit your manuscript here:
/>BioMedcentral
Journal of Orthopaedic Surgery and Research 2007, 2:21 />Page 11 of 11
(page number not for citation purposes)
for evaluation of 3-D stiffness in vitro. Biomed Tech 2001,
46:247-252.
13. Claes L, Augat P, Suger G, Wilke HJ: Influence of size and stability
of the osteotomy gap on the success of fracture healing. J
Orthop Res 1997, 15:577-584.
14. Maletsky LP, Sun J, Morton NA: Accuracy of an optical active-
marker system to track the relative motion of rigid bodies.
J Biomech 2006, 40:682-685.
15. McDuffee LA, Stover SM, Taylor KT, Les CM: An in vitro biome-
chanical investigation of an interlocking nail for fixation of
diaphyseal tibial fractures in adult horses. Vet Surg 1994,
23:219-230.
16. Panjabi MM, White AA: Material properties. In Biomechanics in the
Musculoskeletal System Edited by: Panjabi MM, White AA. New York:
Churchill Livingstone; 2001:167-190.
17. Cowin SC: Bone Mechanics Boca Raton: CRC Press; 1989.
18. Florin M, Arzdorf M, Linke B, Auer JA: Assessment of stiffness and
strength of 4 different implants available for equine fracture
treatment: A study on a 20° oblique long-bone fracture
model using a bone substitute. Vet Surg 2005, 34:231-238.
19. NDI Optotrak Certus Users Guide, revision 1.0. 2003:63.