báo cáo hóa học:" Fourier-transform infrared anisotropy in cross and parallel sections of tendon and articular cartilage" pptx
Bạn đang xem bản rút gọn của tài liệu. Xem và tải ngay bản đầy đủ của tài liệu tại đây (718.25 KB, 12 trang )
BioMed Central
Page 1 of 12
(page number not for citation purposes)
Journal of Orthopaedic Surgery and
Research
Open Access
Research article
Fourier-transform infrared anisotropy in cross and parallel sections
of tendon and articular cartilage
Nagarajan Ramakrishnan, Yang Xia* and Aruna Bidthanapally
Address: Department of Physics and Center for Biomedical Research, Oakland University, Rochester, MI 48309, USA
Email: Nagarajan Ramakrishnan - ; Yang Xia* - ; Aruna Bidthanapally -
* Corresponding author
Abstract
Background: Fourier Transform Infrared Imaging (FTIRI) is used to investigate the amide
anisotropies at different surfaces of a three-dimensional cartilage or tendon block. With the change
in the polarization state of the incident infrared light, the resulting anisotropic behavior of the tissue
structure is described here.
Methods: Thin sections (6 μm thick) were obtained from three different surfaces of the canine
tissue blocks and imaged at 6.25 μm pixel resolution. For each section, infrared imaging
experiments were repeated thirteen times with the identical parameters except a 15° increment
of the analyzer's angle in the 0° – 180° angular space. The anisotropies of amide I and amide II
components were studied in order to probe the orientation of the collagen fibrils at different tissue
surfaces.
Results: For tendon, the anisotropy of amide I and amide II components in parallel sections is
comparable to that of regular sections; and tendon's cross sections show distinct, but weak
anisotropic behavior for both the amide components. For articular cartilage, parallel sections in the
superficial zone have the expected infrared anisotropy that is consistent with that of regular
sections. The parallel sections in the radial zone, however, have a nearly isotropic amide II
absorption and a distinct amide I anisotropy.
Conclusion: From the inconsistency in amide anisotropy between superficial to radial zone in
parallel section results, a schematic model is used to explain the origins of these amide anisotropies
in cartilage and tendon.
Background
Tendon is a soft connective tissue that lies in between
bones and muscles in animal and human body to transfer
the force experienced by muscle to the bone. Tendon
therefore has the nature to resist mechanical tension.
Depending upon the joint where it is placed, tendon can
have different anatomic shapes [1]. Investigation on ten-
don has been carried out in various aspects [2-6] such as
understanding the shape, structure, mechanical proper-
ties, tissue repair and structure-function relationship. Like
tendon, articular cartilage is also a soft connective tissue,
which covers the end surfaces of bones in synovial joints
to distribute compressive loading. While type I collagen
fibrils are commonly found in tendon as the highly organ-
Published: 6 October 2008
Journal of Orthopaedic Surgery and Research 2008, 3:48 doi:10.1186/1749-799X-3-48
Received: 6 May 2008
Accepted: 6 October 2008
This article is available from: />© 2008 Ramakrishnan et al; licensee BioMed Central Ltd.
This is an Open Access article distributed under the terms of the Creative Commons Attribution License ( />),
which permits unrestricted use, distribution, and reproduction in any medium, provided the original work is properly cited.
Journal of Orthopaedic Surgery and Research 2008, 3:48 />Page 2 of 12
(page number not for citation purposes)
ized and uniform fiber bundles, type II collagen fibrils are
found maximally in articular cartilage that are organized
in a depth-dependent structure [7-11], where the orienta-
tion of the local fibrils divides the cartilage depth into
three sub-tissue zones, namely superficial (fibrils parallel
to tissue's surface), transitional (random fibril orienta-
tion) and radial zones (fibrils perpendicular to the sur-
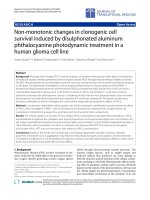
face) (Figure 1a).
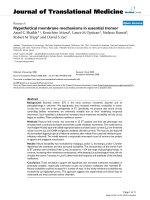
The orientation of the different tissue sections from a specimen block (a) and the schematic illustration of the amide bonds at different tissue surfaces (b)Figure 1
The orientation of the different tissue sections from a specimen block (a) and the schematic illustration of the
amide bonds at different tissue surfaces (b). (SZ – superficial zone, TZ – transitional zone. RZ – radial zone).
Journal of Orthopaedic Surgery and Research 2008, 3:48 />Page 3 of 12
(page number not for citation purposes)
Structural and biochemical alteration in the microstruc-
ture and composition of molecular networks in the tissue
due to any damage/degradation will eventually produce
the clinical symptoms of osteoarthritis. Till date, osteoar-
thritis cannot be diagnosed at its earliest stage before the
appearance of any clinical symptom. Change in biochem-
ical constituents indicates the tissue degradation in
advance. Recent studies of cartilage using Fourier-Trans-
form Infrared Imaging (FTIRI) [12-19] show that infrared
techniques with imaging capability have the potential to
provide quantitative information about chemical compo-
sition of tissue in its native and degraded states. Since ten-
don has well-organized collagen structure, studies using
infrared technique have also been initiated on tendon
[20-22]. Following the earlier research on FTIRI of tendon
and cartilage [20], efforts have been made to understand
the infrared anisotropy of articular cartilage [23,24] for
the tissue sections that consist of all the three zones
(termed the regular section in this article, Figure 1a). In
these anisotropy studies, multiple infrared imaging data
were acquired, each for a different infrared polarization
state in the 0°-180° angular space. Subsequent analysis
using all images can provide detailed information regard-
ing the fibril orientation and bond directions in cartilage
[23,24]. When the long axis of the fibrils is in the plane of
the tissue section, the bond directions of amide I and
amide II are approximately perpendicular and parallel to
the fibril axis respectively (Figure 1b1).
Since the matrix of collagen fibrils in articular cartilage has
a unique three-dimensional (3D) structure, different sur-
faces of a tissue block should have the fibrils in different
orientations, as illustrated in Figure 1a. In particular, we
are interested in the infrared anisotropy when the long
axis of the collagen fibrils is perpendicular to the plane of
a tissue section. In such a case, a simple interpretation of
the bond directions illustrated in Figure 1b1 would sug-
gest a 'dot' for the amide II bond direction (Figure 1b2).
In this study, the anisotropy of tendon and cartilage from
all different surfaces of the 3D tissue cube were investi-
gated using infrared imaging. To the best of our knowl-
edge, there has been no study in literature regarding the
infrared anisotropy in the regular/parallel/cross sections
of tendon and cartilage. Since the infrared absorption of
the amide I and amide II bonds has been found to have
distinct anisotropy in articular cartilage [23,24], this arti-
cle focuses on the features of these two amide compo-
nents in all sections. (Since amide II and amide III bond
directions are parallel, their anisotropy profiles are of sim-
ilar pattern, whereas the sugar component of proteogly-
can has no anisotropy [23].)
Methods
Sample preparation
Tendon and humeral head from mature canine, sacrificed
for unrelated experiments, were used in this study. Fresh
canine achilles tendon was cleaned and freed of fat, mus-
cle and sheaths. Unfixed fragments of 10 mm long and 6
mm thick were cut, embedded in OCT compound (cryo-
embedding medium) and snap frozen using liquid nitro-
gen. Special care was exercised in orienting the specimen
parallel to the longest axis of the tendon. The specimen
blocks were sealed in aluminum foil and stored at -80°C
until use. Rectangular blocks of full thickness of cartilage
attached to the underlying bone were harvested from the
central load-bearing region of the humeral head. To mon-
itor the influence of topographical variations, special
attention was paid to the cartilage's location and orienta-
tion on the joint surface by preserving the interface
between the soft tissue and the bone. The cartilage tissue
blocks were placed in phosphate buffered saline (pH 7.3)
to prevent drying and were refrigerated until use. Standard
histology procedures were used to treat the cartilage tissue
blocks, including overnight chemical fixation with for-
mol-cetylpyridiniumchloride (CPC), decalcification with
10% ethylene diamine tetra acetic acid (EDTA)/Tris buffer
for 7–10 days, and paraffin embedding in tissue processor
(RMC PTP 1530). (The infrared spectrum of paraffin does
not interfere with the cartilage spectra.)
Using a microtome (Micron HM325, Thermo Fisher Sci-
entific, Waltham, MA), thin sections (~6 μm thick) were
cut from different surfaces of tendons as well as cartilage
tissue blocks and named as the regular, cross and parallel
sections (Figure 1a). For articular cartilage, the regular sec-
tions contain all three zones of the tissue, with the long
axis of the fibrils in the superficial and radial zones in the
plane of the tissue section. The parallel sections of articu-
lar cartilage were acquired at different tissue depths.
Hence, while the parallel sections from the superficial
zone have the fibril in the plane of the sections, the paral-
lel sections from the radial zone have the long axis of the
fibrils perpendicular to the plane of the sections (cf Figure
1). Preserving the relative orientations among all parallel
sections of cartilage is also critically important. For ten-
don, the long axis of the specimen is parallel to the long
axis of the block; consequently, the regular and parallel
sections of tendon have the fibrils running parallel in the
plane of the sections. The cross sections of the tendon,
however, only contain the 'ends' of the fibrils that are cut
across, similar to the case of cartilage's parallel sections
from the radial zone. These sections were placed on bar-
ium fluoride (BaF
2
) window as well as on commercially
available mid infrared reflection study substrates called
MirrIR slides (Kevley Technologies, Chesterland, Ohio) to
conduct FTIRI experiments.
Instrumentation details
Infrared images were acquired using a Spotlight 300 infra-
red imager from PerkinElmer (Wellesley, Massachusetts).
The apparatus consists of a FTIR spectrophotometer and
an infrared microscope. Liquid nitrogen cooled sixteen-
Journal of Orthopaedic Surgery and Research 2008, 3:48 />Page 4 of 12
(page number not for citation purposes)
element MCT (Mercuric Cadmium Telluride) detector
with a moving stage for scanning the sample constitutes
the microscope. The microscope also has a visible light
source to focus the sample and to choose the region of
interest for data acquisition. The sections fixed on the
mechanical stage were undisturbed over the entire period
of data collection. Experimental parameters were unal-
tered for the entire set of experiments.
To investigate the anisotropy, a commercial wire grid
infrared polarizer from PerkinElmer was inserted between
the sample and the detector (and will be referred as "ana-
lyzer" from now onwards). For each tissue section, infra-
red imaging experiments were repeated thirteen times
with the identical parameters except a 15° increment of
the analyzer's angle in the 0° – 180° angular space. For
the analyzer angle 0°, the long axis of the collagen fibrils
is parallel to the x-axis of the x-y moving stage of the Infra-
red Imager [23]. Transmission and reflection experiments
were carried out for a selected region of interest on each
tissue section with a pixel size of 6.25 μm
2
. The spectral
resolution of the instrument is 16 cm
-1
with data interval 8
cm
-1
and 2 scans per pixel. Two to three identical sections
were investigated in each type of experiment; the results
were highly consistent. Other experimental details can be
found elsewhere [23,24].
Data analysis
Each single infrared imaging experiment produces a 3D
data cube, two spatial dimensions and one spectral
dimension in the mid infrared region (4000-750 cm
-1
).
From this data cube, it is possible to extract two-dimen-
sional (2D) chemi-maps for any desired spectral interval.
It is also possible to examine the infrared spectrum at any
spatial location of the tissue section. Since the previous
studies have established the anisotropy profile for amide
I and amide II components of articular cartilage in the
spectral range 2000-1000 cm
-1
, this investigation also
explored this spectral region. The baseline corrected
chemi-maps were extracted for amide I and amide II from
the spectral range 1700 to 1600 cm
-1
and 1600 to 1500
cm
-1
respectively, from all infrared images. In the case of
tendon, eight by eight pixels in the chemi-maps were aver-
aged to analyze the anisotropy at different surfaces of the
block for both amide I and amide II. Similar averaging
was done for the parallel sections of cartilage. For the reg-
ular sections of cartilage, eight consecutive columns were
averaged into one full-depth column so as to preserve the
depth resolution of the cartilage at 6.25 μm. Identical
experimental parameters and data analysis approach were
used for all tissue sections from three different specimens,
which in turn yielded consistent results.
Results
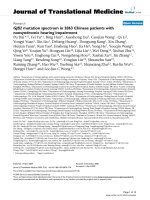
Figure 2 shows the visible images of tendon and cartilage
sections from different surfaces of the tissue block. It is
evident that the regular and parallel sections of tendon
have similar fibril morphology, with the tendon fibrils
running parallel in the plane of the tissue section. In con-
trast, the cross section of tendon has very different mor-
phology. For articular cartilage, the regular section
contains three typical histological zones; whereas each
parallel section of cartilage has a very different fibril orien-
tation, depending upon the depth at which the section is
obtained.
Tendon results
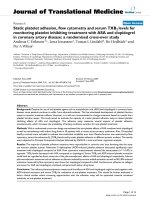
Figure 3 depicts the absorption anisotropy of amide I and
amide II in tendon's regular, parallel and cross sections.
Two features can be observed. First, the absorption anisot-
ropy of amide I is stronger than that of amide II, which is
due to greater bond strength (double bond) of amide I
whereas amide II absorption is caused by lesser bond
strength (single bond). Second, the anisotropy of amide I
absorption is opposite to that of amide II for all three sec-
tions, that ensures the perpendicularity of transition
moment directions of these amide bonds. For the parallel
and regular sections of tendon, since the fibril's long axis
is parallel to the x-axis of the moving stage in both orien-
tations, their infrared anisotropy is similar to that of the
radial zone fibrils in regular sections of articular cartilage
(the amide I anisotropy has a maximum at 0° and a min-
imum at 90°; and the same for amide II is opposite
[23,24]). An interesting result is the amide anisotropy in
the cross sections – though the anisotropy is weaker com-
pared to the same in other two surfaces, the angular
dependency remains the same.
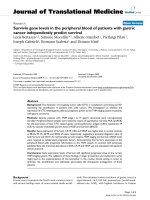
To further investigate the anisotropy of the cross sections
from tendon, the same cross section was placed at three
different orientations (θ = 0°, ~65° and 90°) with respect
to the polarization axis and the anisotropy experiments
were repeated at these three orientations. Figure 4 shows
the anisotropy profiles of amide I and amide II for these
three orientations. It is clear that both amide vibrations
have distinct anisotropy with the perpendicularity
between them, even though the cross sections of the ten-
don do not have a visible fibril arrangement (cf Figure 2a).
This result has two implications. First, the schematic
assumption for the amide II orientation as illustrated in
Figure 1b2 needs further investigation (see later in Discus-
sion). Second, these amide bonds have a fixed orientation
in the tissue's cross section with respect to the local fibril
structure. (These experiments were conducted on various
cross sections and the results are found to be consistent.)
Another noticeable feature in Figure 4 is the 'phase shift'
in the minimum and maximum absorption locations
(angles) for a sample that is not oriented parallel/perpen-
dicular with respect to the analyzer 0°. Though it appears
like a full cycle in 0–180° angular space, the difference
between the minimum and maximum absorption will
Journal of Orthopaedic Surgery and Research 2008, 3:48 />Page 5 of 12
(page number not for citation purposes)
always be 90°. To verify this observation, the regular sec-
tion of the tendon was imaged when the section was tilted
by about ~60° with respect to the initial orientation used
in Figure 3. The results are shown in Figure 5, where both
profiles of the amide anisotropy from this regular section
show the 'phase shift'. (i.e., the amide I plot in Figure 5 is
'phase shifted' from the amide I plot in Figure 3a.) This
anisotropy shift illustrates the importance of the specimen
orientation in the FTIRI anisotropy experiment, as the ani-
sotropy is a polarization dependent phenomenon.
Cartilage results
Based on the results of tendon, investigations are made on
the anisotropy of cartilage for both regular sections as well
as the parallel sections obtained at different zones. The
results of the regular sections (that contain all three histo-
logical zones) are identical to our previously published
data [23,24]. Since the fibrils are in the plane of the carti-
lage's regular sections, which is similar to the fibril orien-
tation of tendon's regular/parallel sections, the amide
anisotropy in these cartilage sections is identical to those
in the tendon's regular/parallel sections (cf Figure 3). The
only additional feature in the cartilage case is the perpen-
dicular nature the fibril orientation between the superfi-
cial and radial zones of the tissue (cf Figure 1a), which
causes the infrared anisotropy of the same amide compo-
nent to be opposite between the two zones.
Since the regular section anisotropy is well-established,
parallel sections of cartilage is focused in this article. Fig-
The visible images from the FTIR imager, tendon (a) and cartilage (b)Figure 2
The visible images from the FTIR imager, tendon (a) and cartilage (b). (a.s. – articular surface).
Journal of Orthopaedic Surgery and Research 2008, 3:48 />Page 6 of 12
(page number not for citation purposes)
Absorption anisotropy of amide I (a) and amide II (b) of tendon in the regular, parallel and cross sectionsFigure 3
Absorption anisotropy of amide I (a) and amide II (b) of tendon in the regular, parallel and cross sections.
Journal of Orthopaedic Surgery and Research 2008, 3:48 />Page 7 of 12
(page number not for citation purposes)
Absorption anisotropy of amide I (a) and amide II (b) of tendon's cross section at three different sample orientationsFigure 4
Absorption anisotropy of amide I (a) and amide II (b) of tendon's cross section at three different sample orien-
tations.
Journal of Orthopaedic Surgery and Research 2008, 3:48 />Page 8 of 12
(page number not for citation purposes)
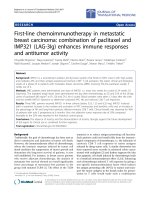
ure 6 shows the infrared anisotropy profiles at the super-
ficial and radial zones of cartilage parallel sections
respectively. In the superficial zone (Figure 6a), the ani-
sotropy of amide I is opposite to that of amide II, which is
the same as in regular section of cartilage. A unique fea-
ture of the infrared anisotropy in cartilage is its depth
dependency. In regular sections of cartilage, the anisot-
ropy of both amide components decreases gradually from
the superficial zone to the transitional zone and increases
in opposite direction gradually from the transitional zone
to the radial zone. In this study where each parallel sec-
tion has a 6-μm separation from the next one, the same
trend in infrared anisotropy is observed. The two plots of
amide I and amide II (Figure 6a) are from two parallel sec-
tions, separated by a 42 μm gap in between. The deeper
section has the same but weaker anisotropy.
The parallel sections from the radial zone, however, have
a different anisotropy. Figure 6b shows that, while amide
I retains a distinct anisotropy, the amide II anisotropy in
the radial zone becomes very weak. For this type of canine
cartilage, the transitional zone has been found approxi-
mately from 70 μm to 120 μm [25]. From about 250 μm
onwards, the tissue is well into its radial zone where all
fibrils are expected to be parallel to each other (cf Figure
1a). Consequently, all parallel sections in the deep radial
zone are expected to have the same anisotropy. This is true
since there is little variation between the two plots of each
amide component in Figure 6b, even the two parallel sec-
tions are 48 μm apart. However, the observation of amide
I anisotropy in the radial zone's parallel sections was not
expected, if one considers the schematic illustrations in
Figure 1.
Discussion
In infrared polarization experiments with cartilage/ten-
don, maximum and minimum absorption occurs when
the polarization axis is parallel and perpendicular to
amide bond transition moment directions respectively.
Our previous results have verified such anisotropy for
both amide I and amide II components using the regular
sections of cartilage, as illustrated in Figure 1b1. To inves-
tigate infrared anisotropy for the tissue sections where the
long axis of the fibrils is perpendicular to the section
plane, such simple illustration is not sufficient. Hence, a
detailed illustration is given in Figure 7, which incorpo-
rates the tilting angles of the transitional moments of
amide bonds in collagen fibrils as well as the effect of
polarization in infrared imaging.
It is well known in literature that the transition moments
of amide I and amide II have tilting angles with respect to
The phase shift in the absorption anisotropy due to a sample rotation (the same tendon section as in Figure 3 now oriented at ~60°)Figure 5
The phase shift in the absorption anisotropy due to a sample rotation (the same tendon section as in Figure 3
now oriented at ~60°).
Journal of Orthopaedic Surgery and Research 2008, 3:48 />Page 9 of 12
(page number not for citation purposes)
Representative infrared anisotropy profiles of amide profiles at the superficial zone (a) and the radial zone (b)Figure 6
Representative infrared anisotropy profiles of amide profiles at the superficial zone (a) and the radial zone (b).
Journal of Orthopaedic Surgery and Research 2008, 3:48 />Page 10 of 12
(page number not for citation purposes)
the axis of the alpha-helix [26], as shown in Figure 7a.
Since the amide bonds are fixed in the peptide chains and
the fibril contains three identical chains in a triple helix, it
is evident that the transitional moments of amide vibra-
tions also spiral around the long axis of the fibrils. Hence,
there exist two situations when performing infrared polar-
ization experiment: (a) when the long axis of the fibril is
in the plane of the tissue section (Figure 7b), which is the
(a) The transitional moments of one pair of amide bonds at one location in the triple helixFigure 7
(a) The transitional moments of one pair of amide bonds at one location in the triple helix. The distribution of
numerous amide bonds along the fibril axis would be similar to the cone structures as in (b). When the long axis of the fibrils is
parallel to tissue section (b), the 'projection' of the transition moment 'cone' varies its size at the 2D z-z' plane with the change
of polarization state. Consequently, there will be infrared anisotropy in (b). When the long axis of the fibrils is perpendicular to
the tissue section (c), the 'projection' of the transition moment 'cone' remains the same at the 2D z' plane regardless of the
polarization state. Consequently, there will be no infrared anisotropy in (c).
Journal of Orthopaedic Surgery and Research 2008, 3:48 />Page 11 of 12
(page number not for citation purposes)
case of regular/cross sections of cartilage with all three
zones in the plane as well as the case of regular/parallel
sections of tendon, and (b) when the long axis of the fibril
is perpendicular to the plane of the tissue section (Figure
7c), which is the case of parallel section of cartilage in the
radial zone as well as the cross sections of tendon.
When one carries out a polarization experiment, the
polarization axis is alwaysrotated in the plane of the tissue
section. In situation (a), the distribution of an amide
bond around the numerous fibrils will have the shape of
a cone, as shown in Figure 7b. When the polarization axis
is rotated in the tissue plane (the z-z' plane), the transition
moment vector of an amide component varies as the func-
tion of the polarization state, thus yielding anisotropy. In
contrast, in situation (b), the infrared irradiation is polar-
ized in the 2D z' plane, where the resultant bond vectors
from the cone would not change as the function of the
polarization state (Figure 7c), thus yielding no anisotropy.
In the study of tendon's cross sections, both amide I and
amide II showed strong anisotropy (Figure 3). The result
of cartilage's parallel sections from the radial zone, amide
I has strong anisotropy but amide II is nearly isotropic
(Figure 6b). The tendon results from the cross sections
suggest that the long axis of the fibers is not perpendicular
to the plane of the tissue section. This can be explained by
a well known wavy/zigzag nature of collagen bundles in
tendon [1,2], which may result in a residual anisotropy in
tendon's cross sections observed in this study. In compar-
ison, the isotropic nature of the amide II component in
the parallel sections of cartilage's radial zone implies that
the long axis of the fibrils in the radial zone of the cartilage
is indeed perpendicular to the plane of the tissue section
(the situation (b) discussed above). However, the same
situation (b) cannot explain the observed anisotropy of
amide I in the radial zone of cartilage. This conundrum
might be, in part, due to the small concentration of con-
necting fibrils in cartilage's radial zone [27]. Further
experiments have been planned to investigate the nature
of the 3D fibril orientation in articular cartilage.
Conclusion
The infrared anisotropy of tendon as well as cartilage has
been investigated in regular, parallel and cross sections
from a 3D tissue block. The results are mutually consist-
ent, when the long axis of the fibrils is parallel to the plane
of the tissue section. An interesting situation is when the
long axis of the fibrils is perpendicular to the plane of the
tissue section. Though the infrared anisotropy of amide
components in tendon cross sections would be expected
to be isotropic, the experimental results show a clear ani-
sotropy for both amide I and amide II components in ten-
don. This could be attributed to the zigzag nature of the
collagen fibers in tendon. The results of the parallel sec-
tions from cartilage's superficial zone are similar to that of
regular sections in cartilage, which is also comparable to
the anisotropy in tendon's regular and parallel sections.
The parallel sections from cartilage's radial zone have a
nearly isotropic amide II absorption and a distinct amide
I anisotropy. The origins of these features are investigated
with the aid of a schematic model.
Competing interests
The authors declare that they have no competing interests.
Authors' contributions
NR carried out the FT-IR imaging experiments, analyzed
the raw data and drafted the manuscript. YX conceived of
the study, participated in its design and coordination,
finalized the data analysis, interpreted the concluding
results, made the final figures, revised and completed the
manuscript. AB performed the histological sectioning of
the tissue blocks and participated in the experiments. All
authors read and approved the final manuscript.
Acknowledgements
Yang Xia thanks the National Institute of Health (NIH) for R01 grants (AR
45172, AR52353). The authors are grateful to the laboratories of Drs. G.
Lust and (late) N. Burton-Wurster (James A. Baker Institute for Animal
Health, Cornell University, Ithaca, NY), and Dr. C. Les (Henry Ford hospi-
tal, Detroit, MI) for providing the canine joints and tendon tissues. Also, the
authors acknowledge Mr. A Yerasi for his assistance in data analysis.
References
1. Kannus P: Structure of tendon connective tissue. Scand J Med
Sci Sport 2000, 10:312-320.
2. de Campos Vidal B: Image analysis of tendon helical super-
structure using interference and polarized light microscopy.
Micron 2003, 34:423-432.
3. Svensson L, Aszodi A, Reinholt FP, Fassler R, Heinegard D, Oldberg
A: Fibromodulin-null mice have abnormal collagen fibrils, tis-
sue organization, and altered lumican deposition in tendon.
J Biol Chem 1999, 274:9636-9647.
4. Kjaer M: Role of extracellular matrix in adaptation of tendon
and skeletal muscle to mechanical loading. Physiol Rev 2004,
84:649-698.
5. Fleming BC, Beynnon BD: In vivo measurement of ligament/ten-
don strains and forces: a review. Ann Biomed Eng 2004,
32:318-328.
6. Derwin KA, Soslowsky LJ: A quantitative investigation of struc-
ture-function relationships in a tendon fascicle model. J Bio-
mech Eng 1999, 121:598-604.
7. Bayliss M, Venn M, Maroudas A, Ali SY: Structure of proteogly-
cans from different layers of human articular cartilage. Bio-
chem J 1983, 209:387-400.
8. Maroudas A: Biophysical chemistry of cartilaginous tissues
with special reference to solute and fluid transport. Biorheol-
ogy 1975, 12(3-4):233-248.
9. Mow VC, Guo XE: Mechano-electrochemical properties of
articular cartilage: their inhomogeneities and anisotropies.
Ann Rev Biomed Eng 2002, 4:175-209.
10. Venn M, Maroudas A: Chemical composition and swelling of
normal and osteoarthritic femoral head cartilage. Ann Rheum
Dis 1977, 36:121-129.
11. Xia Y: Magic Angle Effect in MRI of Articular Cartilage – A
Review.
Inv Radiol 2000, 35:602-621.
12. Camacho NP, West P, Torzilli PA, Mendelshon R: FTIR micro-
scopic imaging of collagen and proteoglycan in bovine carti-
lage. Biopol 2001, 62:1-8.
Publish with BioMed Central and every
scientist can read your work free of charge
"BioMed Central will be the most significant development for
disseminating the results of biomedical research in our lifetime."
Sir Paul Nurse, Cancer Research UK
Your research papers will be:
available free of charge to the entire biomedical community
peer reviewed and published immediately upon acceptance
cited in PubMed and archived on PubMed Central
yours — you keep the copyright
Submit your manuscript here:
/>BioMedcentral
Journal of Orthopaedic Surgery and Research 2008, 3:48 />Page 12 of 12
(page number not for citation purposes)
13. David-Vaudey E, Burghardt A, Keshari K, Brouchet A, Ries M, Majum-
dar S: Fourier Transform Infrared Imaging of focal lesions in
human osteoarthritic cartilage. Eur Cell Mater 2005, 10:51-60.
14. Gadaleta SJ, Landis WJ, Boskey AL, Mendelsohn R: Polarized FT-IR
microscopy of calcified turkey tendon. Conn Tis Res 1996,
34:203-211.
15. Lazarev YA, Grshkovsky BA, Khromova TB: Amide I band of IR
spectrum and structure of collagen and related peptides.
Biopol 1985, 24:1449-1478.
16. Potter K, Kidder LH, Levin IW, Lewis EN, Spencer RG: Imaging of
collagen and proteoglycan in cartilage sections using Fourier
transform infrared spectral imaging. Arth Rheum 2001,
44:846-855.
17. Wetzl DL, Post GR, Lodder RA: Synchrotron infrared micro-
spectroscopic analysis of collagens I, III and elastin on the
shoulders of human thin-cap fibroathermos. Vib Spectrosc
2005, 38:53-59.
18. West PA, Bostrom MPG, Torzilli PA, Camacho NP: Fourier Trans-
form Infrared Spectral Analysis of Degenerative Cartilage:
An Infrared Fiber Optic Probe and Imaging Study. Appl Spec-
tosc 2004, 58:376-381.
19. West PA, Torzilli PA, Chen C, Lin P, Camacho NP: Fourier Trans-
form Infrared Imaging Spectroscopy analysis of collagenese-
induced cartilage degradation. J Biomed Opt 2005, 10:014015.
20. Bi X, Li G, Doty SB, Camacho NP: A novel method for determi-
nation of collagen orientation in cartilage by Fourier trans-
form infrared imaging spectroscopy. Osteo Cart 2005,
13:1050-1058.
21. Pettibois C, Gouspillou G, Wehbe K, Delage J, Deleris G: Analysis
of type I and IV collagens by FT-IR spectroscopy and imaging
for a molecular investigation of skeletal muscle connective
tissue. Anal Bioanal Chem 2006, 386:1961-1966.
22. Scott JE, Orford CR, Hughes EW: Proteoglycan-collagen
arrangements in developing rat tail tendon. Biochem J 1981,
195:573-581.
23. Xia Y, Ramakrishnan N, Bidthanapally A: The Depth-dependent
Anisotropy of Articular Cartilage by Fourier-Transform
Infrared Imaging (FTIRI). Osteo Cart 2007, 15:780-788.
24. Ramakrishnan N, Xia Y, Bidthanapally A: Polarized IR Microscopic
Imaging of Articular Cartilage. Phys Med Biol 2007,
52:4601-4614.
25. Ramakrishnan N, Xia Y, Bidthanapally A, Lu M: Determination of
Zonal Boundaries in Articular Cartilage Using Infrared
Dichroism. Appl Spectrosc 2007, 61:1404-1409.
26. Fraser RDB, MacRae TP: Confirmation in Fibrous Proteins.
New York: Academic press; 1973:179-217.
27. Xia Y, Moody J, Alhadlaq H: Orientational dependence of T2
relaxation in articular cartilage: A microscopic MRI (μMRI)
study. Magn Reson Med 2002, 48:460-469.