báo cáo hóa học:" Function of anterior talofibular and calcaneofibular ligaments during in-vivo motion of the ankle joint complex" docx
Bạn đang xem bản rút gọn của tài liệu. Xem và tải ngay bản đầy đủ của tài liệu tại đây (2.92 MB, 6 trang )
BioMed Central
Page 1 of 6
(page number not for citation purposes)
Journal of Orthopaedic Surgery and
Research
Open Access
Research article
Function of anterior talofibular and calcaneofibular ligaments
during in-vivo motion of the ankle joint complex
Richard J de Asla, Michal Kozánek, Lu Wan, Harry E Rubash and Guoan Li*
Address: The Bioengineering Laboratory, Department of Orthopaedic Surgery, Massachusetts General Hospital and Harvard Medical School, 55
Fruit Street – GRJ 1215, Boston, MA 02114, USA
Email: Richard J de Asla - ; Michal Kozánek - ; Lu Wan - ;
Harry E Rubash - ; Guoan Li* -
* Corresponding author
Abstract
Background: Despite the numerous in-vitro studies on the mechanical properties and simulated
injury mechanisms of the anterior talofibular ligament (ATFL) and calcaneofibular ligament (CFL),
the in-vivo biomechanical behavior of these two ligaments has not yet been described.
Methods: Apparent length of the ATFL and CFL was measured in four ankles in healthy male
subjects between 32 and 45 years of age (two left and two right) during a dorsiflexion-
plantarflexion and supination-pronation arc of motion using a combined dual-orthogonal
fluoroscopic and magnetic resonance imaging technique.
Results: The ATFL elongated from the neutral position at 16.3 +/- 3.0 mm to 20.8 +/- 2.7 mm at
maximal plantarflexion and shortened significantly from the neutral position to 13.9 +/- 2.9 mm at
maximal dorsiflexion (p = 0.01). The CFL shortened from the neutral position at 28.0 +/- 2.9 mm
to 26.6 +/- 2.2 mm at maximal plantarflexion (p = 0.08) and elongated significantly from the neutral
position to 29.9 +/- 3.0 mm at maximal dorsiflexion (p = 0.003). The ATFL elongated significantly
from 14.8 +/- 2.5 mm at maximal pronation to 17.4 +/- 3.0 mm at maximal supination (p = 0.08).
At the same time, the CFL shortened from 31.0 +/- 3.8 mm at maximal pronation to 26.9 +/- 3.6
mm at maximal supination (p = 0.02).
Conclusion: The results showed that the ATFL elongates more during plantarflexion and
supination whereas the CFL increases in length with dorsiflexion and pronation. Concurrently,
these data also demonstrated the reciprocal function between the two ligaments. While one
shortens, the other one elongates. The different elongation of the ATFL and CFL during the same
motion arc suggests that under excessive loading conditions the ATFL might be more vulnerable in
plantarflexion and supination while the CFL might be more susceptible to injury in dorsiflexion and
pronation. Furthermore, in the case of surgical reconstruction the grafts used to reconstruct the
two ligaments may need to be tensioned at different positions of the ankle in order to reproduce
their natural in vivo function.
Published: 16 March 2009
Journal of Orthopaedic Surgery and Research 2009, 4:7 doi:10.1186/1749-799X-4-7
Received: 3 July 2008
Accepted: 16 March 2009
This article is available from: />© 2009 de Asla et al; licensee BioMed Central Ltd.
This is an Open Access article distributed under the terms of the Creative Commons Attribution License ( />),
which permits unrestricted use, distribution, and reproduction in any medium, provided the original work is properly cited.
Journal of Orthopaedic Surgery and Research 2009, 4:7 />Page 2 of 6
(page number not for citation purposes)
Introduction
Inversion injuries to the ankle are among the most com-
mon problems in musculoskeletal care, representing 10%
of all visits to the emergency room. [1,2] The incidence of
inversion ankle injuries is reported as one in 10,000 peo-
ple per day.[1,2] Up to 20% of patients sustaining an
inversion injury to the ankle will experience persistent
symptoms such as functional instability, recurrent sprains
or chronic pain.[3] The anterior talofibular ligament
(ATFL) and the calcaneofibular ligament (CFL) are the
most commonly involved lateral ankle ligaments.[4]
Numerous studies have investigated the mechanical prop-
erties and simulated injury mechanisms of the ATFL and
CFL in-vitro and much has been learned regarding liga-
ment morphology [5-8] and tensile strength[9] or strain
changes in-vitro.[7,10] However, the in-vivo behavior of
these two ligaments is still not well studied. To the best of
our knowledge, no data has been reported on the elonga-
tion of the ATFL and CFL in-vivo. The objective of the cur-
rent study was to measure the change in apparent length
of the ATFL and CFL, in-vivo, in uninjured healthy ankles
during a dorsiflexion-plantarflexion and supination-pro-
nation arc of motion using a combined dual-orthogonal
fluoroscopic and magnetic resonance (MR) imaging tech-
nique.[11]
Materials and methods
Subject recruitment
Four ankles of healthy male subjects between 32 and 45
years of age (two left and two right, average height of 175
cm and average body mass index (BMI) of 21.8 kg/m
2
)
were included in this study. None of the participating sub-
jects had subjective complaints of ankle pain, previous
history of ankle injury requiring treatment, systemic dis-
ease, or contraindication for MR imaging. Prior to MR
scanning, both ankles, including the scanned and the con-
tralateral one, were evaluated by an orthopaedic surgeon
in order to rule out pathology.
The purpose of the study was explained in detail to all par-
ticipants. An Institutional Review Board approved con-
sent form was obtained from each subject prior to
participation in the study.
Three dimensional model of the ankle joint complex (AJC)
Each ankle was MR imaged on a 1.5 T scanner (GE, Milwau-
kee, WI) using a surface coil and three-dimensional spoiled
gradient-recalled echo (3D SPGR) sequence with the sub-
ject lying in a relaxed, supine position. During the MR scan-
ning the ankle was held in a brace with the foot at a right
angle with respect to the shaft of the tibia. This position was
considered a neutral reference position. A field of view (16
× 16 × 10 cm
3
) that spanned the medial and lateral bound-
aries of the ankle joint complex (AJC) (which we define as
the distal tibia, fibula, talus, calcaneus, the tibiotalar joint,
and subtalar joint) was created from the MR scan with 16
cm in both anterior-posterior and proximal-distal direc-
tions and 10 cm in the medial-lateral direction. Parallel,
sagittal, coronal and axial images with a resolution of 512
× 512 pixels were taken, separated at 1 mm intervals (a
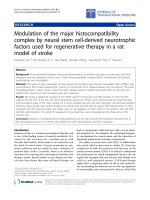
sample sagittal MR slice is shown on Figure 1a). The sagittal
MR images were imported into solid modeling software
(Rhinoceros
®
, Robert McNeel and Associates, Seattle, WA)
and digitized to outline the contours of tibia, fibula, talus,
and calcaneus. Afterwards, these outlines were used to
reconstruct 3D geometric models of the AJC (Figure 1b)
[11-13]. The ligament attachment sites were determined
from the MR images with the assistance of anatomical stud-
ies.[5,14] Once the MR images of each studied AJC were
obtained, they were imported into virtual environment of
(a) MR image of the ankle joint complex (AJC) used to create a three-dimensional virtual model (b) 3D model of the AJC with anterior talofibular ligament (ATFL) and calcaneofibular ligament (CFL)Figure 1
(a) MR image of the ankle joint complex (AJC) used
to create a three-dimensional virtual model (b) 3D
model of the AJC with anterior talofibular ligament
(ATFL) and calcaneofibular ligament (CFL).
Journal of Orthopaedic Surgery and Research 2009, 4:7 />Page 3 of 6
(page number not for citation purposes)
the solid modeling software where the insertions were dig-
itally outlined on each MR slice. Thereafter, an orthopedic
surgeon specializing in foot and ankle surgery as well as a
musculoskeletal radiologist verified the outlined insertions
on each studied AJC. Furthermore, in preparation for this
study we also dissected four cadaveric ankle specimens and
meticulously identified the insertion site anatomy of ATFL
and CFL.
Dual-orthogonal fluoroscopic imaging
Two fluoroscopes (OEC
®
9800 ESP, GE, Salt Lake City,
UT) were positioned in planes orthogonal to each other in
order to capture simultaneous images of the AJC from two
orthogonal projections (anterolateral and anteromedial).
The fluoroscopic images have a resolution of 1000 × 1000
pixels. During the experiment, the subject stood upright
with one leg on a platform and positioned the other (stud-
ied) ankle within the common imaging zone of the two
fluoroscopes. This was done with the assistance of laser
positioning devices embedded in the fluoroscopes. Each
ankle was then tested in four non-weightbearing posi-
tions: maximal plantarflexion (rotation around the
medial-lateral axis with the foot turning downward), max-
imal dorsiflexion (rotation around the medial-lateral axis
with the foot turning upward), maximal supination (foot
position that combines inversion, plantar flexion and
internal rotation) and maximal pronation (combination
of eversion, dorsal flexion and external rotation). During
these non-weightbearing tests, the subject lifted the test-
ing foot in view of both fluoroscopes and actively per-
formed the target motion.
Virtual reproduction of in-vivo AJC motion
The three-dimensional (3D) model of the AJC and the
fluoroscopic images were imported into the solid mode-
ling software to create a virtual dual-orthogonal fluoro-
scopic system. Two virtual cameras were created to
represent the X-ray sources of the two fluoroscopes. The
orthogonal fluoroscopic images were then placed to
reproduce the position of the two intensifiers of the fluor-
oscopes. Afterwards, the 3D AJC model was imported into
the virtual space and the position of the tibia, fibula, talus,
and calcaneus were each adjusted separately in six degrees
of freedom (6DOF) under visual control until the pro-
jected outlines of the AJC model matched the actual AJC
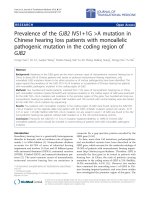
on the fluoroscopic images (Figure 2). [11] The process
was repeated for each AJC position. The method has been
rigorously validated and has an accuracy of 0.1 mm in
translation and 0.18 degrees in rotation.[15]
Measurement of apparent length of the ligaments
The apparent lengths of the ligaments were defined as the
shortest distances between the centroids of the digitized
attachment areas on talus, calcaneus and fibula. Once the
position of the AJC was reproduced in the modeling soft-
ware, the length of the ATFL and CFL was measured for
each testing position of AJC motion. There was no bony
interference with the path of the ATFL and CFL. The posi-
tion of the AJC during MR scanning was defined as the
neutral reference position. The length of the ATFL and CFL
was compared from dorsiflexion to plantar flexion and
from supination to pronation. The neutral position was
used as a reference in each comparison.
Data analysis
A Friedman's test was used to statistically compare the dif-
ferences between the lengths of the ligaments at each
tested position of the AJC. The level of significance was set
at p < 0.05.
Results
Maximal dorsiflexion and maximal plantarflexion
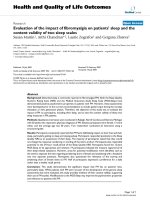
The ATFL elongated from the neutral position at 16.3 ±
3.0 mm to 20.8 ± 2.7 mm at maximal plantarflexion and
shortened significantly from the neutral position to 13.9
± 2.9 mm at maximal dorsiflexion (p = 0.01), as shown in
Figure 3. The ATFL also elongated significantly from max-
imal dorsiflexion to maximal plantarflexion (p = 0.049).
The average change in length of the ATFL from maximal
dorsiflexion to maximal plantarflexion was therefore 7
mm.
The CFL shortened from the neutral position at 28.0 ± 2.9
mm to 26.6 ± 2.2 mm at maximal plantarflexion (p =
0.08) and elongated significantly from the neutral posi-
tion to 29.9 ± 3.0 mm at maximal dorsiflexion (p =
0.003), as shown in Figure 3. The average change in length
of the CFL during the maximal dorsiflexion to maximal
plantarflexion arc of motion was 3 mm.
Maximal supination and maximal pronation
The ATFL elongated from the neutral position to 17.4 ±
3.0 mm at maximal supination (p = 0.09) and shortened
Reproduction of the in-vivo AJC position using the virtual dual-orthogonal fluoroscopic system setupFigure 2
Reproduction of the in-vivo AJC position using the
virtual dual-orthogonal fluoroscopic system setup.
Journal of Orthopaedic Surgery and Research 2009, 4:7 />Page 4 of 6
(page number not for citation purposes)
from neutral position to 14.8 ± 2.5 mm at maximal pro-
nation (p = 0.08; Figure 4). It also elongated significantly
from maximal pronation to maximal supination (p =
0.006). The average change in length of the ATFL from
maximal supination to maximal pronation was 2.6 mm.
The CFL shortened from the neutral position to 26.9 ± 3.1
mm at maximal supination (p = 0.07) and elongated sig-
nificantly from the neutral position to 31.0 ± 3.8 mm at
maximal pronation (p = 0.04), as shown in Figure 4. The
CFL also significantly elongated from maximal supination
to maximal pronation (p = 0.02). The average change in
length of the CFL from maximal supination to maximal
pronation was 4.1 mm.
Discussion
The present study investigated the changes in length of the
ATFL and CFL in-vivo during the positions of plantarflex-
ion, dorsiflexion, supination and pronation using a com-
bined MR and dual-orthogonal fluoroscopy. The results
showed that the ATFL is significantly more elongated at
plantarflexion than at dorsiflexion. Further, the ATFL is
also significantly more elongated at supination than at
pronation. Conversely, the CFL is more elongated with
dorsiflexion than with plantarflexion and was also found
to be more elongated at pronation than at supination.
Therefore, these data also demonstrated the reciprocal
function between the two ligaments. While one shortens,
the other one elongates and vice versa.
Several cadaveric studies investigated the length of lateral
ankle ligaments. Milner et al.[6] measured length of oste-
oligamentous preparations of collateral ligaments in 40
ankle specimens and reported the length of the ATFL and
CFL to be 13.0 ± 3.9 mm and 19.5 ± 3.9 mm respectively.
Siegler et al.[8] reported the average lengths of ATFL and
CFL measured in osteoligamentous preparations of 20
cadaveric ankles. In their study, the average ATFL length
was 17.8 ± 3.1 mm and the average CFL length was 27.7 ±
3.3 mm. Burks and Morgan also measured the length of
lateral ankle ligaments in their sample of 39 cadaveric
ankles.[5] They reported the average length of the ATFL
and CFL as 24.8 mm and 35.8 mm respectively. The in-
vivo length of the ATFL and CFL measured in this study in
a neutral position compares favorably with the results of
Milner et al.[6] and Siegler et al.[8] who measured the dis-
tance between the ligament attachment sites. In this study
the average length of the ATFL was 15.8 ± 2.9 mm and the
average length of the CFL was 27.7 ± 2.7 mm in the neu-
tral position. The study of Burks and Morgan measured
the length of the longest fibers, while our study used cen-
troids of insertion areas, which might explain why their
values were larger. Burks and Morgan also showed that the
ATFL and the CFL have adjacent attachment sites on the
anterior edge of the fibula 8–10 mm from the distal tip
and that with the foot in neutral position, the CFL forms
an angle of about 130 degrees with the fibula whereas the
ATFL was slightly less than 90 degrees anteriorly.[5] It was
therefore theorized that in dorsiflexion, the CFL assumes
a course parallel to the axis of the fibula thereby function-
ing as a collateral ligament. In plantarflexion, the orienta-
Lengths of the ATFL and CFL as measured at maximal plantarflexion (PF), maximal dorsiflexion (DF) and at neutral position (N)Figure 3
Lengths of the ATFL and CFL as measured at maxi-
mal plantarflexion (PF), maximal dorsiflexion (DF)
and at neutral position (N). *p < 0.05.
Lengths of the ATFL and CFL as measured at maximal supi-nation (SU), maximal pronation (PR) and at neutral position (N)Figure 4
Lengths of the ATFL and CFL as measured at maxi-
mal supination (SU), maximal pronation (PR) and at
neutral position (N). *p < 0.05.
Journal of Orthopaedic Surgery and Research 2009, 4:7 />Page 5 of 6
(page number not for citation purposes)
tion of ATFL fibers assumes this position and may be
expected to function as the main collateral liga-
ment.[5,16] Since the majority of sprains occur during
plantarflexion, [4,17] the ATFL would therefore be the
first ligament to suffer disruption in this type of injury, as
shown in several reports.[4,18,19] This notion was sup-
ported by numerous in-vitro studies which investigated
the changes in ATFL and CFL strain in response to loading
in various positions. Colville et al.[10] measured strain in
lateral ankle ligaments in 10 cadaveric ankles while apply-
ing inversion/eversion and internal/external rotational
forces during the flexion-extension arc of motion. They
demonstrated increased strain in the ATFL with increasing
plantarflexion, inversion and internal rotation. Strain in
the CFL was found to increase in dorsiflexion and inver-
sion. Ozeki et al.[7] investigated strain changes in central
fibers of the lateral ankle ligaments in 12 cadaveric speci-
mens during plantarflexion-dorsiflexion. Their results
showed that ATFL was taut in plantarflexion and the CFL
in dorsiflexion. The length change of each ligament dur-
ing the arc of motion was less than 1.6 mm. Renström et
al.[20], Rasmussen[21,22] and Bahr et al.[16] also found
that the ATFL acts as a primary restraint in inversion and
plantarflexion, whereas the CFL tension was increased
mainly in inversion and dorsiflexion. The lowest maxi-
mum load-to-failure of ATFL among the lateral ankle lig-
aments also explains why ATFL is often the first ligament
to rupture during an inversion injury to the ankle.[23]
These cadaveric studies have provided fundamental
knowledge for the understanding of function of these lig-
aments and injury mechanisms. However, the in-vivo
behavior of the lateral ankle ligaments during the range of
motion has not been well studied.
Data in this study demonstrate that the ATFL lengthens
more in plantarflexion and supination (combination of
plantarflexion, inversion and internal rotation) whereas
the CFL elongates more in dorsiflexion and pronation
(combination of dorsiflexion, eversion and external rota-
tion). These data compare favorably with the results of pre-
vious cadaveric studies and suggest that under excessive
loading conditions the ATFL might be more vulnerable in
plantarflexion and supination while the CFL might be
more susceptible to injury in dorsiflexion and pronation.
Certain limitations of this study should be noted. The
ankles were studied during non-weightbearing motion
and the subjects were asked to actively position their
ankles into the extreme positions of plantarflexion, dorsi-
flexion, supination, and pronation. These ranges of
motion are most likely smaller than what would be meas-
ured if the foot was passively moved and held in position.
Additionally, the volunteers may not have applied the
supination pronation motion in the same manner. How-
ever, we tried to minimize the potential inconsistencies by
instructing the subjects about the target positions and vis-
ually verifying them during the scanning. It should be
noted that this study did not investigate motion of the lig-
aments, but estimated the changes in length based on the
distances between the centroids of the digitized attach-
ment sites. The methodology has not been validated to
measure in-vivo motion of the ligaments. Further, this
study only included male subjects since it has been shown
that male and female ankles and feet differ in several
anthropometric characteristics.[24,25] Therefore, in the
future, ligament function should be investigated in female
subjects. Finally, only four positions were studied (full
plantarflexion, dorsiflexion, supination and pronation).
In conclusion, the results of this study contribute to the
small pool of data on in-vivo behavior of the lateral ankle
ligaments. We noted that the ATFL seems to elongate
more during plantarflexion and supination whereas the
CFL increases in length with dorsiflexion and pronation.
Concurrently, these data also demonstrated the reciprocal
function of the two ligaments. While one shortens, the
other one elongates. The different elongation of the ATFL
and CFL during the same motion arc suggests that under
excessive loading conditions the ATFL might be more vul-
nerable in plantarflexion and supination while the CFL
might be more susceptible to injury in dorsiflexion and
pronation. Furthermore, in the case of surgical reconstruc-
tion the grafts used to reconstruct the two ligaments may
need to be tensioned at different positions of the ankle in
order to reproduce their natural in vivo function. In the
future it will be possible to apply this technique to study
the ligament function after various types of injury and to
evaluate the effectiveness of operative or conservative
treatment in restoring normal ligament behavior in vivo.
Furthermore, dynamic motion of the ankle should be
studied.
Competing interests
The authors declare that they have no competing interests.
Authors' contributions
All authors were directly involved in the experiments, data
analysis, interpretation of results and preparation of the
manuscript. All authors have reviewed the text of the man-
uscript and agree with publication in the present form.
RJD carried out scanning, recruited subjects, performed
data analysis, prepared manuscript, revised manuscript.
MK carried out scanning, subject recruitment, image
processing, preparation of the manuscript and editing. LW
assisted with scanning, subject recruitment, image
processing and data analysis. HR supervised data analysis
and interpretation, advised co-authors in preparation and
revision of the manuscript. GL designed experiment,
supervised data analysis and manuscript preparation and
revision.
Publish with BioMed Central and every
scientist can read your work free of charge
"BioMed Central will be the most significant development for
disseminating the results of biomedical research in our lifetime."
Sir Paul Nurse, Cancer Research UK
Your research papers will be:
available free of charge to the entire biomedical community
peer reviewed and published immediately upon acceptance
cited in PubMed and archived on PubMed Central
yours — you keep the copyright
Submit your manuscript here:
/>BioMedcentral
Journal of Orthopaedic Surgery and Research 2009, 4:7 />Page 6 of 6
(page number not for citation purposes)
Acknowledgements
This study was financially supported by the Department of Orthopaedic
Surgery at Massachusetts General Hospital. The authors would also like to
acknowledge the study subjects for their participation.
References
1. Beynnon BD, Vacek PM, Murphy D, Alosa D, Paller D: First-time
inversion ankle ligament trauma: the effects of sex, level of
competition, and sport on the incidence of injury. Am J Sports
Med 2005, 33(10):1485-91.
2. Holmer P, Sondergaard L, Konradsen L, Nielsen PT, Jorgensen LN:
Epidemiology of sprains in the lateral ankle and foot. Foot
Ankle Int 1994, 15(2):72-4.
3. Freeman MA: Instability of the foot after injuries to the lateral
ligament of the ankle. J Bone Joint Surg Br 1965, 47(4):669-77.
4. Brostrom L: Sprained ankles. 3. Clinical observations in recent
ligament ruptures. Acta Chir Scand 1965, 130(6):560-9.
5. Burks RT, Morgan J: Anatomy of the lateral ankle ligaments.
Am J Sports Med 1994, 22(1):72-7.
6. Milner CE, Soames RW: Anatomy of the collateral ligaments of
the human ankle joint. Foot Ankle Int 1998, 19(11):757-60.
7. Ozeki S, Yasuda K, Kaneda K, Yamakoshi K, Yamanoi T: Simultane-
ous strain measurement with determination of a zero strain
reference for the medial and lateral ligaments of the ankle.
Foot Ankle Int 2002, 23(9):825-32.
8. Siegler S, Block J, Schneck CD: The mechanical characteristics of
the collateral ligaments of the human ankle joint. Foot Ankle
1988, 8(5):234-42.
9. St Pierre RK, Rosen J, Whitesides TE, Szczukowski M, Fleming LL,
Hutton WC: The tensile strength of the anterior talofibular
ligament. Foot Ankle 1983, 4(2):83-5.
10. Colville MR, Marder RA, Boyle JJ, Zarins B: Strain measurement
in lateral ankle ligaments. Am J Sports Med 1990, 18(2):196-200.
11. de Asla RJ, Wan L, Rubash HE, Li G: Six DOF in vivo kinematics
of the ankle joint complex: Application of a combined dual-
orthogonal fluoroscopic and magnetic resonance imaging
technique. J Orthop Res 2006, 24(5):1019-27.
12. Li G, Wan L, Kozanek M: Determination of real-time in-vivo
cartilage contact deformation in the ankle joint.
J Biomech
2008, 41(1):128-36.
13. Wan L, de Asla RJ, Rubash HE, Li G: Determination of in-vivo
articular cartilage contact areas of human talocrural joint
under weightbearing conditions. Osteoarthritis Cartilage 2006,
14(12):1294-301.
14. Taser F, Shafiq Q, Ebraheim NA: Anatomy of lateral ankle liga-
ments and their relationship to bony landmarks. Surg Radiol
Anat 2006, 28(4):391-7.
15. Li G, Wuerz TH, DeFrate LE: Feasibility of using orthogonal
fluoroscopic images to measure in vivo joint kinematics. J
Biomech Eng 2004, 126(2):314-8.
16. Bahr R, Pena F, Shine J, Lew WD, Engebretsen L: Ligament force
and joint motion in the intact ankle: a cadaveric study. Knee
Surg Sports Traumatol Arthrosc 1998, 6(2):115-21.
17. Freeman MA, Dean MR, Hanham IW: The etiology and preven-
tion of functional instability of the foot. J Bone Joint Surg Br 1965,
47(4):678-85.
18. Brostroem L: Sprained Ankles. I. Anatomic Lesions in Recent
Sprains. Acta Chir Scand 1964, 128:483-95.
19. Brostrom L: Sprained ankles. V. Treatment and prognosis in
recent ligament ruptures. Acta Chir Scand 1966, 132(5):537-50.
20. Renstrom P, Wertz M, Incavo S, Pope M, Ostgaard HC, Arms S,
Haugh L: Strain in the lateral ligaments of the ankle. Foot Ankle
1988, 9(2):59-63.
21. Rasmussen O: Stability of the ankle joint. Analysis of the func-
tion and traumatology of the ankle ligaments. Acta Orthop
Scand Suppl 1985, 211:1-75.
22. Rasmussen O, Andersen K: Ligament function and joint stability
elucidated by a new technique. Eng Med 1982, 11(2):77-81.
23. Attarian DE, McCrackin HJ, Devito DP, McElhaney JH, Garrett WE Jr:
A biomechanical study of human lateral ankle ligaments and
autogenous reconstructive grafts. Am J Sports Med 1985,
13(6):377-81.
24. Sforza C, Michielon G, Fragnito N, Ferrario VF: Foot asymmetry in
healthy adults: elliptic fourier analysis of standardized foot-
prints. J Orthop Res 1998, 16(6):758-65.
25. Wunderlich RE, Cavanagh PR: Gender differences in adult foot
shape: implications for shoe design. Med Sci Sports Exerc 2001,
33(4):605-11.