Báo cáo hóa học: " Blood genomic profiles of exposures to Venezuelan equine encephalitis in Cynomolgus macaques (Macaca fascicularis)" pot
Bạn đang xem bản rút gọn của tài liệu. Xem và tải ngay bản đầy đủ của tài liệu tại đây (386.78 KB, 11 trang )
BioMed Central
Page 1 of 11
(page number not for citation purposes)
Virology Journal
Open Access
Research
Blood genomic profiles of exposures to Venezuelan equine
encephalitis in Cynomolgus macaques (Macaca fascicularis)
Rasha Hammamieh
1
, Mohsen Barmada
1
, George Ludwig
2
, Sheila Peel
3
,
Nick Koterski
4
and Marti Jett*
1
Address:
1
Division of Pathology, Walter Reed Army Institute of Research, Silver Spring, MD, USA,
2
Office of the Principal Assistant for Research
and Technology, United States Army Medical Research and Materiel Command, Frederick, MD, USA,
3
Division of Retrovirology, Walter Reed Army
Institute of Research, Rockville, MD, USA and
4
Division of Virology, United States Army Medical Research and Materiel Command, Frederick, MD,
USA
Email: Rasha Hammamieh - ; Mohsen Barmada - ;
George Ludwig - ; Sheila Peel - ; Nick Koterski - ;
Marti Jett* -
* Corresponding author
Abstract
Background: Lymphocytes provide invaluable whistle blowers of changes due to infections. We
use the information registered by these cells using their mRNAs as they encounter the pathogen
to develop patterns of expression that correspond to that specific pathogen.
Venezuelan equine encephalitis (VEE) is a mosquito-borne viral disease characterized by fever and
one or more of the following: severe headache, back pain, myalgias, prostration, chills, nausea,
vomiting, weakness and other flu-like symptoms.
Screening for host mRNA obtained from blood samples after exposure to VEEV may provide the
means for early detection of surrogate markers of the impending illness and provide appropriate
strategies for treatment.
Results: We have been carrying out gene expression analysis of PBMC exposed to VEEV to
extract signatures and diagnostic markers of early exposure to be used in non invasive blood
analysis methods.
In this study, we used high throughput gene expression analysis to identify markers of early and late
exposures to VEEV in vivo in Cynomolgus macaques (Macaca fascicularis). We carried out cDNA
microarrays and real time PCR on blood samples obtained from the NHP model resulting in a panel
of host genes that are altered in response to VEEV.
Conclusion: Screening for host mRNA obtained from blood samples after exposure to VEEV may
provide the means for early detection of surrogate markers of the impending illness and provide
appropriate strategies for treatment.
Background
A reliable and rapid diagnosis of viral infections has long
been a major concern for clinicians due to the fact that
most of viral diseases exhibit flu-like symptoms early on
Published: 29 August 2007
Virology Journal 2007, 4:82 doi:10.1186/1743-422X-4-82
Received: 17 July 2007
Accepted: 29 August 2007
This article is available from: />© 2007 Hammamieh et al; licensee BioMed Central Ltd.
This is an Open Access article distributed under the terms of the Creative Commons Attribution License ( />),
which permits unrestricted use, distribution, and reproduction in any medium, provided the original work is properly cited.
Virology Journal 2007, 4:82 />Page 2 of 11
(page number not for citation purposes)
in the course of the illness and effective treatment often
requires intervention early in the course of disease. Detec-
tion of exposure to viral pathogens has relied on ever
more sensitive methods for pathogen identification.
Assessing exposure to a pathogen well in advance of onset
of illness or at various stages post-exposure would be
invaluable to clinicians. To counter the threat of biologi-
cal attack and emerging diseases, it is critical to develop
the capability to distinguish accurately between a com-
mon infection such as seasonal influenza and exposure to
a biological weapon or newly emerged or newly intro-
duced pathogen.
Lymphocytes, in their role as purveyors of humoral
immunity, may serve as invaluable indicators of the
changes that occur in response to particular infectious
processes. By monitoring their evolving pattern of mRNA
production as they encounter a pathogen, we may be able
to define patterns of expression that correspond to that
specific pathogen. Venezuelan equine encephalitis (VEE)
is a mosquito-borne viral disease caused by an enveloped
single-stranded RNA virus of the family Togaviridae,
genus Alphavirus [1]. Members of the virus complex that
cause VEE are endemic to different parts of South America,
Trinidad, Central America, Mexico, and Florida. Disease
caused by members of the VEE virus (VEEV) complex is
usually characterized by fever and one or more of the fol-
lowing: severe headache, back pain, myalgias, prostration,
chills, nausea, vomiting, and weakness and it may rarely
progress to encephalitis [2-4].
The aerosol form of VEEV is highly infectious, making
VEEV a potential biowarfare agent. If this virus was
deployed efficiently, it could incapacitate significant num-
bers of people for a week or more and cause untold psy-
chological stress to millions [5,6]. Like many other
viruses, VEEV is potentially susceptible to genetic manip-
ulation which could compound its virulence or render it
invisible to sequence-specific diagnostic identification
[3].
Diagnosis of VEE has traditionally relied on viral isolation
from acute phase serum or spinal fluid, IgG levels in
paired serum samples, or on detection of VEEV-specific
IgM in serum or the cerebrospinal fluid[7]. Recently, PCR
based assays have been developed and employed in many
testing laboratories for detection of VEEV infections.
The objective of the current study is to examine the early
cellular and molecular changes induced in peripheral
blood mononuclear cells (PBMC) of a non-human pri-
mate model in response to exposures to VEEV, which
likely mirror the initial stages of infection in the human
host.
We studied gene expression profiling in response to VEEV
infection in cynomolgus macaques (Macaca fascicularis)
that were used as part of a larger study carried out by the
Department of Defense to assess the host pathological
responses to VEEV.
In this report we identify biomarkers for exposures to
VEEV obtained from blood samples. Screening for host
mRNA obtained from PBMCs after exposure to VEEV may
provide the means for early detection of surrogate markers
of the impending illness.
The ability to identify specific gene patterns early on can
provide appropriate strategies for prevention or treatment
that would lead to amelioration of the disease progres-
sion.
Note: microarray data have been submitted to the Gene
Expression Omnibus (GEO) and can be searched using
the Platform ID: GPL5486.
Results
Microarray analysis of VEEV infected vs. uninfected NHPs
Inter-chip and intra-chip data normalizations were com-
puted using GeneSpring (Agilent, CA), as described in the
methods section. One-way ANOVA with a P-value < 0.05
identified 1378 genes of interest; listing the most differen-
tially expressed genes between the control and VEEV
exposed NHPs.
Figure 1 is a cluster view of genes differentially expressed
between the control and VEEV exposed NHPs. We carried
out PCA on the control and treated samples. Figure 2
shows that samples from NHPs exposed to VEEV were
clustered together and maintained a significant distance
from the control group along first principal component
axis (x-axis: PCA1), which, incidentally, represents the
highest variance between the two groups.
Confirmation of gene expression changes by Real-Time
PCR analysis
Four genes were selected for real-time polymerase chain
reaction (PCR). They are RNA binding motif protein 9
(AA451903
), collagen, type XV, programmed cell death 4
(N71003
), and the house keeping gene, GAPDH. Figure 3
illustrates that the real-time PCR expression profiles for
the selected genes are well correlated with the correspond-
ing microarray results.
Data mining of genes differentially expressed between
control and VEEV exposed NHPs
We used GeneSpring 7.1 and FATIGO+ [8] to functionally
classify genes and identify pathways that were regulated
by the VEEV in the blood of exposed NHPs.
Virology Journal 2007, 4:82 />Page 3 of 11
(page number not for citation purposes)
Cluster view of gene expression profiles showing altered regulation of genes induced by VEEV in PBMCFigure 1
Cluster view of gene expression profiles showing altered regulation of genes induced by VEEV in PBMC. Blood was collected at
various time point post exposure to VEEV. RNA was isolated, hybridized to human cDNA arrays, scanned and data analyzed
using Gene Spring. Red shows up regulated and green represents down regulated genes compared to control unexposed ani-
mals. Cluster analysis was performed using the Hierarchical cluster and Tree view.
Virology Journal 2007, 4:82 />Page 4 of 11
(page number not for citation purposes)
Using FATIGO
+
and GeneCite [9] we carried out a detailed
pathway analysis using the Biocarta pathways [10]. Figure
4 shows pathways differentially regulated by VEEV in the
blood samples.
Gene ontological classification, using FATIGO
+
and
GeneCite [9], of genes regulated by the VEEV in the blood
suggested that genes related to immune defense, transcrip-
tion factors, cell adhesion, cell growth, apoptosis and sig-
nal transduction were regulated by the virus.
Table 2 represents the functional classification of some of
the genes of interest.
Table 1: The sequences of the primers used in this study.
Name Gene Bank ID Description Sequence Product Size
COL15A AA455157 collagen, type XV, alpha 1 5'-CCA CCT ACC GAG CAT TCT TAT C-3'
5'-CAA TAC GTC TCG ACC ATC AAA G-3' 197 bp
PDCD4 N71003
programmed cell death 4 5'-CCG GTG ATG AAG AAA ATG CT-3'
5'-TGG TTG GCA CAG TTA ATC CA-3' 207 bp
RBM9 AA451903
RNA binding motif protein 9 5'-AAC TCC TGA CTC AAT GGT TC-3'
5'-CAT TTT GTG TGC TGG GTG AG-3' 194 bp
Principal component analysis of gene expression profiles in VEEV infected compared to control animalsFigure 2
Principal component analysis of gene expression profiles in VEEV infected compared to control animals. Although the animals
were clinically reported asymptomatic, the VEEV treated and control samples cluster far from each other along PCA1 axis.
Virology Journal 2007, 4:82 />Page 5 of 11
(page number not for citation purposes)
Effect of VEEV on the expression profiles of apoptosis
related genes
Ontological mining of the significantly regulated genes
revealed that apoptosis related genes, and especially the
caspase pathway genes, were highly up regulated in VEEV
infected animals. Granzyme B, caspase 3, lamin A/C, cas-
pase 10 and caspase 4 were all up regulated. Caspase 1 and
apoptosis inhibitor 5 (API5) were down regulated in these
animals when compared to the uninfected controls (Fig
5).
Exposure to the VEEV induces the up regulation of pro-
inflammatory genes
Exposure to the VEEV has also induced the up regulation
of pro-inflammatory genes such as IL-6, IFN-b, IL-1a, IL1-
b and the Fas ligand. IL-12 and IL-10 were down regu-
lated. Figure 6 shows the expression levels of some of
these genes.
Effect of VEEV on the expression patterns of androgen
related genes
Exposure to the VEEV down regulates the expression pat-
tern of the gene coding for the androgen receptor and the
Prostate androgen-regulated transcript 1 (PART1) (Fig. 7).
The androgen receptor functions as a steroid-hormone
activated transcription factor [11]. Upon binding the hor-
mone ligand, the receptor dissociates from accessory pro-
teins, translocates into the nucleus, and then stimulates
transcription of androgen responsive genes.
Discussion
Detection of the exposure to Venezuelan equine encepha-
litis virus currently uses culture methods, immunoassay
and gene amplification techniques. Traditional assays lack
the time sensitivity that is critical in diagnosing virus
infection well in advance of the onset of illness. Although
new methods are improving our ability to diagnose this
viral infection diagnose dramatically, they require specifi-
cally developed probes that can be circumvented by subtle
sequence changes.
Recent research suggests that with sufficient knowledge of
genomic expression patterns, pathogen induced changes
in cellular gene expression may provide the mean to iden-
tify specific biological agents. An understanding of the
internal language of the lymphocyte will also help us to
understand more about the intricacies of the host-patho-
gen interactions and recommend potential prophylactic
or therapeutic strategies.
In this study, we examined gene expression in VEEV
infected NHPs using cDNA microarrays and compared the
results to uninfected controls.
These animals developed fever and were viremic in
response to VEEV infection. They did seroconvert in
response to infection and a significant number of genes
exhibited altered expression profiles that paralleled VEEV
infection.
Genes related to apoptosis and the caspase pathway were
significantly regulated by VEEV infection. The expression
levels of Caspase 3, caspase 4, caspase 10 and lamin A/C
were increased in the infected animals compared to the
controls.
These alterations in gene expression may be permissive for
opportunistic infections by inducing apoptosis among the
affected cells.
Lower levels of expression were observed for the androgen
receptor and the prostate androgen-regulated transcript 1.
Muehlenbein et al had shown that the testosterone levels
were down regulated upon exposure to VEEV in these ani-
mals [12]. This alteration in the androgen related genes by
VEEV is suggested to be of benefit for the host by thwart-
ing a possible testosterone-mediated immunosupression
[12].
In summary, in this small sample of VEEV infected ani-
mals, expression was consistently altered in specific
groups of genes that code for a wide range of biochemical
functions. A few important genes of interest are discussed
here.
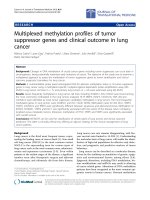
A comparative analysis of four selected genes using array analysis and Real-time PCRFigure 3
A comparative analysis of four selected genes using array
analysis and Real-time PCR. RNA binding motif protein 9 and
collagen, type XV, were down regulated in VEEV infected ani-
mals while programmed cell death 4 was down regulated.
-4
-3
-2
-1
0
1
2
3
RNA binding mot if protein
9
Collagen XV Programmed cell death 4
Fold Change (log
)
Microarray
Real-time PCR
Virology Journal 2007, 4:82 />Page 6 of 11
(page number not for citation purposes)
Expression of Apoptosis related genesFigure 5
Expression of Apoptosis related genes. The caspase pathway genes, were highly up regulated in VEEV infected animals.
0.00
5.00
10.00
15.00
20.00
25.00
30.00
35.00
granzyme B Caspase Lamin A/C caspase 10 Caspase 4 parathyroid
hormone-like
tumor protein
p53
MAPKKK10
Fold Change
Ontological analysis of the genes that were up (a) or down (b) regulated by VEEV in PBMCFigure 4
Ontological analysis of the genes that were up (a) or down (b) regulated by VEEV in PBMC. RNA samples were isolated and
hybridized on the cDNA microarray slides as detailed in materials and methods. Images were analyzed using GenePix 4.0 and
data were analyzed using GeneSpring 7.0. Data were then analyzed using FATIGO
+
to identify functional classes regulated by
the virus. We calculated the percentage of each ontological class found in the list of genes regulated by VEEV and compared it
to the percentage of found in the total gene list of the cDNA array.
0
2
4
6
8
10
12
14
Angiotensin-
converting
enzyme 2
regulates heart
Cyclin E
Destruction
Pathway
Phospholipase
C d1 in
phospholipid
associated cell
Endocytotic
role of NDK
Bystander B
Cell
Activation
E2F1
Destruction
Pathway
cdc25 and
chk1
Regulatory
Pathway
Up regulated
Total genes
0
2
4
6
8
10
12
Activation of
PKC through
G protein
coupled
recept
Small
Leucine-rich
Proteoglycan
(SLRP)
molecules
CXCR4
Signaling
Pathway
Integrin
Signaling
Pathway
IL-7 Signal
Transduction
Signaling of
Hepatocyte
Growth
Factor
Receptor
Dendritic
cells in
regulating
TH1 and
TH2
Developm
Down regulated
Total genes
A. B.
Present call (%)
Present call (%)
Virology Journal 2007, 4:82 />Page 7 of 11
(page number not for citation purposes)
Conclusion
The present study, along with correlating some genes with
exposure to the VEEV, identifies several novel genes as
potential diagnostic and therapeutic markers for Venezue-
lan equine encephalitis in the blood.
Methods
Animals and virus
A total of 11 captive-born, adult male cynomolgus mon-
keys were used in this study. Research was conducted in
compliance with the Animal Welfare Act and other federal
statutes and regulations relating to animals and experi-
ments involving animals and adheres to principles stated
in the Guide for the Care and Use of Laboratory Animals,
National Research Council, 1996. The facility where this
research was conducted is fully accredited by the Associa-
tion for Assessment and Accreditation of Laboratory Ani-
mal Care International. Blood samples were obtained
from the monkeys on day 0 (pre-exposure). Randomly
selected monkeys were exposed to a dose of 1 × 10
8
plaque
forming units (PFU) of VEEV, the Trinidad strain, which is
a virulent epizootic IA/B variant virus. At days 3, 4 and 14
post-exposure to VEEV, 2 of these monkeys were ran-
domly selected on each day to obtain whole blood sample
as described in Muehlenbein et al. [12].
RNA isolation
Whole blood samples were collected into CPT Vacutainer
tubes (BD, Franklin Lakes, NJ) and processed in accord-
ance with the manufacturer's specifications, which allow
Expression patterns of androgen related genes: The andro-gen receptor and the Prostate androgen-regulated transcript 1 (PART1) were both down regulated by the VEEV in the blood of infected animalsFigure 7
Expression patterns of androgen related genes: The andro-
gen receptor and the Prostate androgen-regulated transcript
1 (PART1) were both down regulated by the VEEV in the
blood of infected animals.
-3
-2.5
-2
-1.5
-1
-0.5
0
Androgen receptor
Prostate androgen-regulated
transcript 1
Fold Change
Expression patterns of pro-inflammatory genes: RNA samples were isolated and hybridized on the cDNA microarray slides as detailed in materials and methodsFigure 6
Expression patterns of pro-inflammatory genes: RNA samples were isolated and hybridized on the cDNA microarray slides as
detailed in materials and methods. Images were analyzed using GenePix 4.0 and data were analyzed using GeneSpring 7.0
-10
-5
0
5
10
15
20
25
30
35
40
IL-1b
IFN
b
IL-9 Rece
p
tor
I
L
-
10
Rece
p
tor
IL-12
IL-6
In
terle
u
kin
e
nh
a
n
c
e
r
bind
in
g fa
c
to
r
I
L
-
1 r
e
c
e
p
t
or
-
like
1
IL-13 receptor alpha 1
TN
F
liga
nd
mem
ber
10
IL-11
F
as (TNFRS
F
6)
b
indin
g f
actor 1
TN
F
liga
nd
mem
ber
17
T
N
F
lig
and
mem
ber
10b
Fold Change
Virology Journal 2007, 4:82 />Page 8 of 11
(page number not for citation purposes)
Table 2: Functional classification of some of the genes of interest.
Gene ID Fold Change
Toll-Like Receptors
AF051151 toll-like receptor 5 1.46 ± 0.50
AF177765
toll-like receptor 4 0.67 ± 0.27
AL050262
toll-like receptor 1 0.41 ± 0.13
AL570789
toll-like receptor 3 1.47 ± 0.48
NM_003264
toll-like receptor 2 0.50 ± 0.19
Cytokines
NM_001558 interleukin 10 receptor, alpha 0.18 ± 0.09
S36219
prostaglandin-endoperoxide synthase 1 0.30 ± 0.06
AV707896
Small inducible cytokine subfamily E, member 1 0.33 ± 0.11
D87931
Rho-associated, protein kinase 2 0.40 ± 0.13
NM_003809
tumor necrosis factor (ligand) superfamily, 0.42 ± 0.25
NM_005211
colony stimulating factor 1 receptor 0.46 ± 0.18
NM_001380
dedicator of cytokinesis 1 0.47 ± 0.24
NM_004120
guanylate binding protein 2, interferon-inducible 1.91 ± 0.29
NM_002988
chemokine (C-C motif) ligand 18 2.23 ± 0.81
NM_002186
interleukin 9 receptor 3.17 ± 2.37
AB006967
suppressor of cytokine signaling 3 3.60 ± 2.87
NM_005408
chemokine (C-C motif) ligand 13 6.00 ± 3.46
Neuronal related genes
NM_005045 reelin 0.32 ± 0.12
NM_006334
olfactomedin 1 0.34 ± 0.17
AF165124
gamma-aminobutyric acid (GABA) A receptor, 0.35 ± 0.11
AU134339
Ceroid-lipofuscinosis, neuronal 3, juvenile 0.37 ± 0.22
NM_000727
calcium channel, voltage-dependent, gamma 0.43 ± 0.18
X57548
cadherin 2, type 1, N-cadherin (neuronal) 0.44 ± 0.05
NM_000742
cholinergic receptor, nicotinic, alpha 2 (neuronal) 0.44 ± 0.18
NM_005612
RE1-silencing transcription factor 0.49 ± 0.15
NM_002738
protein kinase C, beta 1 0.49 ± 0.30
BG169625
Enolase 2 (gamma, neuronal) 0.50 ± 0.20
NM_001830
chloride channel 4 0.55 ± 0.28
M34064
cadherin 2, type 1, N-cadherin (neuronal) 0.58 ± 0.38
NM_002522
neuronal pentraxin I 0.61 ± 0.44
AF166003
potassium voltage-gated channel, member 1 1.95 ± 0.68
NM_004061
cadherin 12, type 2 (N-cadherin 2) 1.98 ± 0.82
AA975079
Ankyrin 2, neuronal 2.22 ± 0.57
NM_000620
nitric oxide synthase 1 (neuronal) 2.27 ± 0.38
AI986443
Similar to neuronal pentraxin receptor isoform 2 2.60 ± 0.40
AK001991
leucine rich repeat neuronal 3 2.80 ± 1.35
AF169693
protocadherin 20 3.02 ± 1.50
NM_014211
gamma-aminobutyric acid (GABA) A receptor, pi 3.17 ± 2.99
X90846
mitogen-activated protein kinase kinase kinase 10 6.00 ± 1.85
AA243675
Solute carrier family 1 7.37 ± 2.78
AI912373
Neuronal guanine nucleotide exchange factor 29.3 ± 7.91
Caspase pathway
NM_001223 caspase 1 0.26 ± 0.16
NM_004131
granzyme B 1.68 ± 0.47
AU125557
Caspase 3 2.09 ± 0.88
H22169
Lamin A/C 3.62 ± 0.80
NM_001230
caspase 10 4.43 ± 1.33
AA041298
Caspase 4 28.3 ± 5.56
Virology Journal 2007, 4:82 />Page 9 of 11
(page number not for citation purposes)
for the enrichment of peripheral mononuclear cells
(PBMC). Total RNA was subsequently isolated from
PBMCs using TRIzol reagent (Invitrogen, Carlsbad, CA)
following manufacturer protocol. RNA quantity was
measured via spectrophotometry followed by analysis
with a Bioanalyzer 2100 (Agilent Technologies, CA)
Custom made cDNA Microarray Slide Preparation and
Hybridization
Human cDNA microarrays were prepared by using
sequence verified PCR elements produced from approxi-
mately 6900 well-characterized human genes of The Easy
to Spot Human UniGEM V2.0 cDNA library (Incyte
Genomics, Inc). The PCR products, ranging from 500 to
700 bps, were deposited in 3·saline sodium citrate (SSC)
at an average concentration of 165 µg/µl on CMT-GAPS II
aminopropyl silane-coated slides (Corning, Corning, NY)
using a VersArray microarryer (Bio-Rad, Inc). The arrays
were post processed by UV-cross linking at 1200 mJ,
baked for 4 h at 80°C, and then the positively charged
amine groups on the slide surface were treated with suc-
cinic anhydride/N-methyl-2-pyrrolidinone.
Microarray hybridization and image processing
Microarray labeling was performed using Micromax Tyra-
mide Signal Amplification (TSA) Labeling and Detection
Kit (Perkin Elmer, Inc., MA). The slides were hybridized
for 16 h at 60°C. The GenePix Pro 4000b (Axon Instru-
ments, Inc., CA) optical scanner was used to scan the
hybridized slides and the raw intensity was recorded
Induction of Apoptosis
AF181850 inhibitor of growth family, member 1 2.09 ± 0.40
AI591151
parathyroid hormone-like hormone 21.6 ± 7.25
L26165
cyclin-dependent kinase inhibitor 1A 2.11 ± 0.84
NM_000546
tumor protein p53 2.37 ± 1.05
NM_001230
caspase 10 4.43 ± 1.33
NM_002048
growth arrest-specific 1 4.14 ± 0.80
NM_003123
sialophorin (leukosialin, CD43) 3.01 ± 1.10
X90846
mitogen-activated protein kinase kinase kinase 10 6.00 ± 1.85
Integrins
BG032225 integrin beta 1 binding protein 1 0.63 ± 0.06
N95414
Integrin, alpha 2 0.39 ± 0.23
NM_000885
integrin, alpha 4 0.50 ± 0.21
NM_000887
integrin, alpha X 0.27 ± 0.17
AW513695
Integrin, beta 1 0.46 ± 0.18
AL581999
Integrin, beta 7 0.31 ± 0.07
AA569711
Integrin, beta 8 0.65 ± 0.15
Immune Response
M12824 CD8a molecule 0.20 ± 0.12
NM_002647
phosphoinositide-3-kinase, class 3 0.23 ± 0.11
NM_003998
nuclear factor of kappa light polypeptide 0.32 ± 0.11
NM_000569
Fc fragment of IgG, low affinity IIIa, receptor 0.34 ± 0.11
NM_001734
complement component 1, s subcomponent 0.34 ± 0.18
AF077196
regulatory factor X-associated ankyrin-containing 0.36 ± 0.14
AL050262
toll-like receptor 1 0.41 ± 0.13
X14831
carcinoembryonic antigen-related cell adhesion 0.42 ± 0.20
S82807
thyroid stimulating hormone receptor 2.17 ± 1.22
L13210
lectin, galactoside-binding protein 2.32 ± 0.42
AF004231
leukocyte immunoglobulin-like receptor 2.41 ± 1.45
M14058
complement component 1, r subcomponent 2.51 ± 2.44
NM_003123
sialophorin (leukosialin, CD43) 3.01 ± 1.10
NM_000063
complement component 2 3.26 ± 1.16
NM_003319
titin 3.68 ± 1.64
NM_003804
(TNFRSF)-interacting serine-threonine kinase 1 3.69 ± 1.82
NM_004415
desmoplakin 4.91 ± 4.10
D90277
carcinoembryonic antigen-related cell adhesion 6.81 ± 4.05
Table 2: Functional classification of some of the genes of interest. (Continued)
Virology Journal 2007, 4:82 />Page 10 of 11
(page number not for citation purposes)
through the Gene Pix 4000 software package (Axon
Instruments, Inc., CA). Intensity of the scanned images
was digitalized through Genepix 4.0 software.
Microarray analysis
Assessment of the overall integrity of the microarray experiment
The quality of the RNA, used for microarray, was tested
beforehand using a 2000 BioAnalyzer (Agilent, CA).
Upon hybridization, the quality of each microarray, i.e.
the efficiency of reverse transcription (RT) reactions, labe-
ling competence etc. was assessed. Microarray images
were visualized using Imagene v.6 (BioDiscovery, Inc.,
CA) and data were analyzed using GeneSpring V. 7.1 (Sil-
icon Genetics, CA) and Partek Pro. V. 5.0 (Partek, MI).
Data cleansing and normalization
Using ImaGene (BioDiscovery Inc., CA), background and
foreground pixels of each spot were segmented and the
highest and lowest 2% of the probe intensity was dis-
carded. Local background correction was applied to each
individual spot. The genes that passed this filter in all
given experiments were selected for further study.
Data cleansing and statistical analysis was carried out
using GeneSpring
®
7.1 (Agilent Tech., CA). Local back-
ground was subtracted from individual spot intensity.
Genes that failed this 'background check' in any of the
experiments were eliminated from further analysis. Each
chip was next subjected to intra-chip normalization
(LOWESS). The genes that varied most between control
and treated sample sets were selected via t-test analysis.
The p-value cutoff was set at 0.05. Four hundreds and
thirty two genes were differentially expressed between
VEEV-infected and control uninfected animals with p <
0.05.
The pattern of gene expression variability of the experi-
mental set having reduced dimension was evaluated using
principal component analysis (PCA) classifying VEEV-
infected and control samples as the two variable classes.
We used the reference design, where a reference RNA sam-
ple is co-hybridized with each sample on the slide. This
design allows us to normalize between the slide for varia-
tions that can be due to hybridization, transcription and
labeling efficiencies (technical variations).
Clustering
Principal component analysis (PCA) was performed over
the given dataset classifying each sample as a statistical
variable, in order to confirm the extent of variability
within the sample classes, as well as among the pre-
designed groups.
A two dimensional hierarchal clustering calculation using
Pearson correlation around zero was also performed.
Real time PCR
The t-test result was corroborated through real time
polymerized chain reaction (Real-time PCR). A web-
based primer designing tool was used to design the prim-
ers for the selected genes [13]. Sequences of the primers
used for the selected genes are listed in table 1. The specif-
icity of each primer sequence was further confirmed by
running a blast search. Reverse transcription and Real-
time PCR reactions were carried out using reverse tran-
scription kit (Invitrogen, Carlsbad, CA) and Real-time
PCR kit (Roche, IN), respectively. Each reaction with five
technical duplicates was run in I-Cycler machine (Bio-
Rad, CA). Each sample was also amplified using a primer
set for the house-keeping probe of the experiment: glycer-
aldehyde 3 phosphate dehydrogenase (GAPDH). The
resultant cycle threshold data from each real-time-PCR
'run' was converted to fold-change using an established
algorithm [14].
Quantitative and qualitative verification of the PCR prod-
uct was accomplished by running 1% agarose gel electro-
phoresis using SYBR Green I (Kamtek, Rockville, MD).
Gel images were captured using FX Molecular Imager sys-
tem (Bio-Rad, CA) scanner and analyzed using Quantity
One software (Bio-Rad, CA).
Competing interests
The author(s) declare that they have no competing inter-
ests.
Authors' contributions
RH participated in the design of the study, carried out the
microarray data analysis, data mining and participated in
drafting the manuscript.
MB carried out the microarray and real time PCR studies.
GL participated in the design of the study and interpreta-
tion of the results.
SP participated in the microarray study.
NK participated in the design of the study and interpreta-
tion of the results.
MJ conceived of the study, and participated in its design
and coordination. All authors read and approved the final
manuscript.
References
1. Johnston REPC: Alphaviruses 3rd edition. New York: Raven Press;
1995.
Publish with BioMed Central and every
scientist can read your work free of charge
"BioMed Central will be the most significant development for
disseminating the results of biomedical research in our lifetime."
Sir Paul Nurse, Cancer Research UK
Your research papers will be:
available free of charge to the entire biomedical community
peer reviewed and published immediately upon acceptance
cited in PubMed and archived on PubMed Central
yours — you keep the copyright
Submit your manuscript here:
/>BioMedcentral
Virology Journal 2007, 4:82 />Page 11 of 11
(page number not for citation purposes)
2. Vogel P, Abplanalp D, Kell W, Ibrahim MS, Downs MB, Pratt WD,
Davis KJ: Venezuelan equine encephalitis in BALB/c mice:
kinetic analysis of central nervous system infection following
aerosol or subcutaneous inoculation. Arch Pathol Lab Med 1996,
120:164-172.
3. Vogel P, Fritz DL, Kuehl K, Davis KJ, Geisbert T: The agents of bio-
logical warfare. Jama 1997, 278:438-439.
4. Vogel P, Kell WM, Fritz DL, Parker MD, Schoepp RJ: Early events
in the pathogenesis of eastern equine encephalitis virus in
mice. Am J Pathol 2005, 166:159-171.
5. Arboviral disease – United States, 1994. MMWR Morb Mortal
Wkly Rep 1995, 44:641-644.
6. Weaver SC, Barrett AD: Transmission cycles, host range, evo-
lution and emergence of arboviral disease. Nat Rev Microbiol
2004, 2:789-801.
7. Calisher CH: Medically important arboviruses of the United
States and Canada. Clin Microbiol Rev 1994, 7:89-116.
8. [
].
9. Hammamieh R, Chakraborty N, Wang Y, Laing M, Liu Z, Mulligan J,
Jett M: GeneCite: A Stand-alone Open Source Tool for High-
Throughput Literature and Pathway Mining. Omics 2007, 11:.
10. [
].
11. Lee HJ, Mowszowicz I, Chang C: The first detection of complete
androgen insensitivity with no mutation in the coding
sequence of the androgen receptor gene. Front Biosci 1996,
1:a34-38.
12. Muehlenbein MP, Cogswell FB, James MA, Koterski J, Ludwig GV:
Testosterone correlates with Venezuelan equine encephali-
tis virus infection in macaques. Virol J 2006, 3:19.
13. PCR Desig [ />]
14. Hammamieh R, Chakraborty N, Das R, Jett M: Molecular impacts
of antisense complementary to the liver fatty acid binding
protein (FABP) mRNA in DU 145 prostate cancer cells in
vitro. J Exp Ther Oncol 2004, 4:195-202.