Báo cáo hóa học: " The evolution of human influenza A viruses from 1999 to 2006: A complete genome study" docx
Bạn đang xem bản rút gọn của tài liệu. Xem và tải ngay bản đầy đủ của tài liệu tại đây (535.53 KB, 19 trang )
BioMed Central
Page 1 of 19
(page number not for citation purposes)
Virology Journal
Open Access
Research
The evolution of human influenza A viruses from 1999 to 2006: A
complete genome study
Karoline Bragstad
1
, Lars P Nielsen
2
and Anders Fomsgaard*
1
Address:
1
Laboratory of Virus Research and Development, Statens Serum Institut, DK 2300 Copenhagen, Denmark and
2
WHO National Influenza
Centre, Statens Serum Institut, DK-2300 Copenhagen, Denmark
Email: Karoline Bragstad - ; Lars P Nielsen - ; Anders Fomsgaard* -
* Corresponding author
Abstract
Background: Knowledge about the complete genome constellation of seasonal influenza A viruses from
different countries is valuable for monitoring and understanding of the evolution and migration of strains.
Few complete genome sequences of influenza A viruses from Europe are publicly available at the present
time and there have been few longitudinal genome studies of human influenza A viruses. We have studied
the evolution of circulating human H3N2, H1N1 and H1N2 influenza A viruses from 1999 to 2006, we
analysed 234 Danish human influenza A viruses and characterised 24 complete genomes.
Results: H3N2 was the prevalent strain in Denmark during the study period, but H1N1 dominated the
2000–2001 season. H1N2 viruses were first observed in Denmark in 2002–2003. After years of little
genetic change in the H1N1 viruses the 2005–2006 season presented H1N1 of greater variability than
before. This indicates that H1N1 viruses are evolving and that H1N1 soon is likely to be the prevalent
strain again. Generally, the influenza A haemagglutinin (HA) of H3N2 viruses formed seasonal phylogenetic
clusters. Different lineages co-circulating within the same season were also observed. The evolution has
been stochastic, influenced by small "jumps" in genetic distance rather than constant drift, especially with
the introduction of the Fujian-like viruses in 2002–2003. Also evolutionary stasis-periods were observed
which might indicate well fit viruses. The evolution of H3N2 viruses have also been influenced by gene
reassortments between lineages from different seasons. None of the influenza genes were influenced by
strong positive selection pressure. The antigenic site B in H3N2 HA was the preferred site for genetic
change during the study period probably because the site A has been masked by glycosylations.
Substitutions at CTL-epitopes in the genes coding for the neuraminidase (NA), polymerase acidic protein
(PA), matrix protein 1 (M1), non-structural protein 1 (NS1) and especially the nucleoprotein (NP) were
observed. The N-linked glycosylation pattern varied during the study period and the H3N2 isolates from
2004 to 2006 were highly glycosylated with ten predicted sequons in HA, the highest amount of
glycosylations observed in this study period.
Conclusion: The present study is the first to our knowledge to characterise the evolution of complete
genomes of influenza A H3N2, H1N1 and H1N2 isolates from Europe over a time period of seven years
from 1999 to 2006. More precise knowledge about the circulating strains may have implications for
predicting the following season strains and thereby better matching the vaccine composition.
Published: 7 March 2008
Virology Journal 2008, 5:40 doi:10.1186/1743-422X-5-40
Received: 9 January 2008
Accepted: 7 March 2008
This article is available from: />© 2008 Bragstad et al; licensee BioMed Central Ltd.
This is an Open Access article distributed under the terms of the Creative Commons Attribution License ( />),
which permits unrestricted use, distribution, and reproduction in any medium, provided the original work is properly cited.
Virology Journal 2008, 5:40 />Page 2 of 19
(page number not for citation purposes)
Background
Every year the influenza A virus causes human infection
with varying severity depending on the host acquired
immunity against the particular virus strain. Three to five
million people experience severe illness and 0.25 to 0.5
million people die of influenza yearly worldwide (WHO
EB111/10). The influenza virus evades host immunity by
accumulation of point mutations (drift) in the major sur-
face glycoproteins, haemagglutinin (HA) and neuramini-
dase (NA) or by reassortment of segments from different
viruses co-infecting the same cell leading to a new stain
with a HA (and NA) not seen in the population before
(shift). In the worst case, shifts may cause pandemics.
There have been three pandemics the last hundred years,
the Spanish flu in 1918 (H1N1), the Asian flu in 1957
(H2N2) and the Hong Kong flu in 1968 (H3N2). It is
believed that new pandemics emerge through shifts with
strains from the avian reservoir, as was the case of the pan-
demics of 1957 and 1968, or by direct introduction of an
avian strain into the human population as suggested for
the 1918 pandemic [1]. At present only two of the 16 pos-
sible HA subtypes (H1 and H3), and two of the nine pos-
sible NA subtypes (N1 and N2) are circulating in man.
H3N2 and H1N1 influenza A viruses have co-circulated in
the human population since the re-emergence of H1N1 in
1977, increasing the possibility for genetic reassortments.
The prevalence of the different subtype combinations may
vary from season to season. The H3N2 has been the pre-
dominant influenza A strain during the last 20 years, with
the exception of the 1988–1989 and 2000–2001 seasons
where H1N1 infections dominated [2]. In the 2000–2001
season a new reassorted human strain, H1N2, emerged in
Europe and became established in the autumn 2001 [3,4].
The new H1N2 subtype was covered by the 2002–2003
H1 and N2 trivalent vaccine components and because
both H1 and N2 viruses had circulated the previous years
some degree of herd immunity against the new strain was
expected. The H1N2 viruses were not associated with
severe influenza illness that season. In 2002, a new line-
age A/Fujian/411/02(H3N2)-like emerged in Asia and
caused significant outbreaks on every continent [5,6].
For the northern hemisphere the WHO issues the recom-
mendation for strains to be included in the trivalent vac-
cine for the next season based on epidemiological data
and antigenic and genetic analyses of circulating strains.
Until the recent release of over 1,800 complete influenza
A genome sequences from the Influenza Genome
Sequencing Project managed by US National Institute of
Allergy and Infectious Diseases [7,8] very few complete
genome sequences have been published to the GenBank.
Also, there have been limited longitudinal studies of the
complete genome of influenza A viruses. The present
study characterise the complete genome evolution of
H3N2, H1N1 and H1N2 influenza A virus from Denmark
spanning seven seasons from 1999 to 2006.
Results
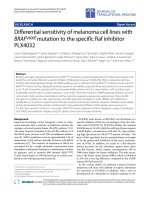
Prevalence of influenza A in Denmark from 1999 to 2006
The relative prevalence of influenza virus varies from sea-
son to season. Influenza A H3N2 was the dominating
strain in Denmark during the last seven years, with the
exception of the 2000–2001 season where the H1N1
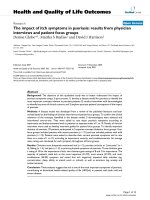
viruses dominated, as can be seen in Figure 1.
Only H3N2 viruses were isolated during the 2001–2002
season. In the 2002–2003 season the H3N2 and H1N1
reassorted influenza A virus strain, H1N2, emerged in
Denmark, but has not been isolated in Denmark since
2003–2004. Higher prevalence of H1N1 viruses co-circu-
lating with H3N2 viruses was observed the last two sea-
sons, 2004/2005 and 2005/2006.
Genetic evolution of influenza A
H3N2 viruses
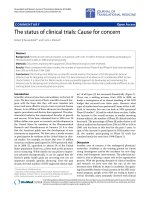
Based on phylogenetic analysis of the HA and NA nucle-
otide sequences from 1999 to 2006 (Figure 2), ten isolates
representative for the phylogenetic clustering of sequences
from each subtype in each season, as far as possible, were
included in the final HA and NA tree (Figure 2) and rep-
resentatives were chosen for complete genome sequenc-
ing. Generally the H3N2 HA and NA genes formed
seasonal phylogenetic clusters (Figure 2). However, we
observed that strains of different lineages and clusters co-
circulated within the same season and that viruses had
reassorted with viruses from previous seasons (Figure 2).
The HA gene of the influenza H3N2 strains from the
1999–2000 season formed a phylogenetic subclade to A/
Moscow/10/99(H3N2) and A/Sydney/5/97(H3N2) (rep-
resented by A/Memphis/31/98) (Figure 2), located
between A/Moscow/10/99 and A/Panama/2007/99 (not
shown). The antigenicity of these strains was A/Moscow/
10/99(H3N2)-like in a haemagglutination inhibition
assay, and will therefore be referred to as Moscow-like
throughout this report. The NA and the internal genes
were all A/Moscow/10/99(H3N2)-like, with the excep-
tion of the matrix (M) gene that clustered as a subclade to
the A/New York/55/01-like strains (Figure 3).
The 2001–2002 season was represented as a mono-
phyletic cluster of A/New York/55/01(H3N2)-like viruses
in all genes (Figure 2). The next season, 2002–2003, was
characterised by co-circulating lineages. These were of
viruses most closely related to A/New York/55/01(H3N2)
from the previous season, H1N2 viruses (described in
more detail below) and a new H3 lineage, the A/Fujian/
411/02(H3N2)-like viruses. The introduction of the A/
Fujian/411/02(H3N2)-like viruses caused a "jump" in the
Virology Journal 2008, 5:40 />Page 3 of 19
(page number not for citation purposes)
evolution of the H3N2 viruses (Figure 2). The HAs in sub-
sequent seasons have evolved from these viruses.
In 2003–2004 the HAs form a subclade to the A/Fujian/
411/02(H3N2)-like lineage from 2002–2003. These
viruses were reassortants probably acquiring the rest of the
genome from the 2001–2002 or 2002–2003 A/New York/
55/01(H3N2)-like viruses (Figure 2, 3 and 4) and became
the predominant lineage co-circulating with the A/Wel-
lington/1/04(H3N2)-like viruses introduced from the
southern hemisphere. One single H1N2 virus isolate was
also observed this season. The A/Wellington/1/
04(H3N2)-like lineage, the following season (2004/
2005), had drifted into a more A/California/7/04(H3N2)-
like lineage, causing a revision of the vaccine composition
from A/Fujian/411/02(H3N2) to A/California/7/
04(H3N2) [9]. In 2005–2006 the 2004–2005 A/Califor-
nia/7/04(H3N2)-like lineages continued to circulate
together with the slightly different A/Wisconsin/67/
05(H3N2)-like viruses (Figure 2). As a result the H3N2
vaccine component for the northern hemisphere 2006–
2007 was changed to A/Wisconsin/67/05(H3N2) [9]. The
A/Fujian/411/02(H3N2), A/Wellington/1/04(H3N2)
and A/California/7/04(H3N2)-like viruses all share the
same type of NS segments and there are few variations
between the Wellington, California and Wisconsin-like
strains, especially in the internal genes (Figure 3 and 4).
However, the internal genes of the A/Wisconsin/67/
05(H3N2)-like viruses, especially the polymerase acidic
(PA), nucleoprotein (NP) and M are more closely related
to the A/Fujian/411/02(H3N2)-like viruses from 2002–
2003 than the A/California/7/04(H3N2) from the previ-
ous season (Figure 3 and 4).
H1N1 viruses
H1N1 viruses dominated the 2000–2001 season in Den-
mark (Figure 1). Thirteen isolates from this season were
available for sequencing, and all were of the H1N1 sub-
type. These sequences represented two different co-circu-
lating lineages (Figure 4). Lineage I is A/Bayern/7/
95(H1N1)-like and lineage II include the H1N1 strains of
today and the A/New Caledonia/20/99(H1N1) vaccine
reference strain (Figure 4). The phylogenetic trees of NA
and the internal genes showed the same topology (Figure
3 and 4). The lineage II strains are characterised by a dele-
tion K130 in HA (K134 in H3 numbering) (Table 1).
H1N1 virus was again isolated in 2004–2005 and showed
a homogeneous distribution in the lineage II for all genes
Relative prevalence of sentinel and routine influenza A viruses in Denmark 1999 to 2006Figure 1
Relative prevalence of sentinel and routine influenza A viruses in Denmark 1999 to 2006. The actual numbers of influenza A
positive samples for the respective seasons are as follows; 1999–2000 49, 2000–2001 28, 2001–2002 80, 2002–2003 61, 2003–
2004 83, 2004–2005 91 and 2005–2006 54.
0
10
20
30
40
50
60
70
80
90
100
1999-2000 2000-2001 2001-2002 2002-2003 2003-2004 2004-2005 2005-2006
Seasons
Prevalence %
H1N2
H1N1
H3N2
Virology Journal 2008, 5:40 />Page 4 of 19
(page number not for citation purposes)
(Figure 3 and 4). Higher nucleotide variation was
observed among the 2005–2006 H1N1 sequences in both
HA and NA genes (Figure 4). This could indicate that the
H1N1 viruses are in progression, away from the A/New
Caledonia/20/99(H1N1)-like viruses.
H1N2 viruses
In 2002–2003 the reassorted H1N2 subtype combination
was isolated for the first time in Denmark. The HA was
derived from A/New Caledonia/20/99(H1N1)-like line-
age II strains and the rest of the genome from A/Moscow/
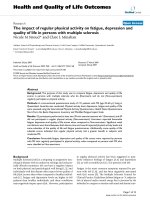
Evolutionary relationships of circulating H3N2 influenza A viruses sampled in Denmark from 1999 to 2006Figure 2
Evolutionary relationships of circulating H3N2 influenza A viruses sampled in Denmark from 1999 to 2006. The nucleotide
coding region trees were generated with maximum parsimony, heuristic random branch swapping search (neighbor joining and
maximum likelihood analysis revealed the same tree topology). Bootstrap values of 1000 resamplings in per cent (>70%) are
indicated at key nodes. H3N2 HA and NA trees are rooted to A/Beijing/353/89 and A/Beijing/32/92. Reference sequences
referred to in the text are shown in bold. The A/Fujian/411/02(H3N2) reference sequence is represented by A/Wyoming/03/
03.
A/Denmark/203/05
A/Denmark/04/05
A/Denmark/10/03
A/Denmark/13/03
A/Denmark/24/02
N2
A/Denmark/33/06
A/Denmark/22/06
A/Denmark/27/06
A/Denmark/10/06
A/Denmark/45/06
2005-2006
A/Wisconsin/67/05
A/Denmark/112/06
A/Denmark/07/06
A/Denmark/68/05
A/Denmark/200/05
2004-2005
A/Denmark/46/06
A/Denmark/36/05
A/Denmark/13/06
2005-2006
2004-2005
A/California/07/04
2004-2005
A/Denmark/87/03
A/Denmark/1-2/04
2003-2004
A/Wellington/01/04
A/Denmark/83/05
A/Denmark/84/05
A/Denmark/07/05
A/Denmark/201/05
A/Denmark/67/05
A/Denmark/202/05
2004-2005
A/Denmark/32/03
A/Denmark/39/03
A/Denmark/59/03
A/Denmark/24/03
A/Denmark/58/03
2002-2003
A/Denmark/07/03
A/Wyoming/03/03
A/Denmark/41/03
A/Denmark/52/03
A/Denmark/50/03
A/Denmark/56/03
A/Denmark/12/03
A/Denmark/86/03
H1N2
A/Denmark/207/00
A/Denmark/208/00
A/Denmark/38/00
A/Denmark/204/00
A/Denmark/200/00
A/Denmark/203/00
A/Denmark/206/00
A/Denmark/35/00
1999-2000
A/Moscow/10/99
A/Denmark/205/00
A/Denmark/37/00
1999-2000
A/New York/55/01
A/Denmark/01/02
A/Denmark/04/02
2001-2002
2002-2003
A/Denmark/02/02
A/Denmark/06/02
A/Denmark/05/02
A/Denmark/08/02
A/Denmark/13/02
2001-2002
2002-2003
2001-2002
A/Denmark/22/02
A/Denmark/26/02
A/Denmark/85/03
A/Denmark/03/04
A/Denmark/15-2/04
A/Denmark/78/03
A/Denmark/05/04
A/Denmark/06/04
A/Denmark/11/04
A/Denmark/81/03
2003-2004
A/Memphis/31/98
A/Beijing /32/92
A/Beijing /353/89
73
99
99
99
99
93
99
99
5
2005-2006
A/Denmark/1-2/04
A/Denmark/87/03
H3
A/Denmark/27/06
A/Denmark/33/06
A/Denmark/22/06
A/Denmark/10/06
A/Denmark/45/06
A/Wisconsin/67/05
A/Denmark/7/06
A/Denmark/112/06
A/Denmark/46/06
A/California/07/04
A/Denmark/200/05
A/Denmark/04/05
A/Denmark/68/05
A/Denmark/203/05
2004-2005
A/Denmark/13/06
A/Denmark/35/06
2005-2006
A/Denmark/83/05
A/Denmark/84/05
A/Denmark/07/05
A/Denmark/201/05
A/Denmark/202/05
A/Denmark/67/05
2004-2005
A/Wellington/01/04
A/Denmark/11/04
A/Denmark/06/04
A/Denmark/81/03
A/Denmark/05/04
A/Denmark/15-2/04
A/Denmark/03/04
A/Denmark/78/03
A/Denmark/85/03
2003-2004
A/Denmark/32/03
A/Denmark/52/03
2002-2003
A/Denmark/07/03
A/Wyoming/03/03
A/Denmark/59/03
A/Denmark/41/03
A/Denmark/39/03
A/Denmark/58/03
A/Denmark/24/03
A/Denmark/02/02
A/Denmark/05/02
A/Denmark/06/02
A/New York/55/01
A/Denmark/08/02
A/Denmark/13/02
A/Denmark/01/02
A/Denmark/04/02
2001-2002
A/Denmark/22/02
A/Denmark/26/02
A/Denmark/24/02
A/Denmark/13/03
A/Denmark/10/03
2002-2003
A/Denmark/205/00
A/Denmark/37/00
A/Denmark/203/00
A/Denmark/38/00
A/Denmark/208/00
A/Denmark/207/00
A/Denmark/206/00
A/Denmark/35/00
A/Denmark/204/00
A/Denmark/200/00
1999-2000
A/Moscow/10/99
A/Memphis/31/98
A/Beijing /353/89
A/Beijing /32/92
99
99
94
98
94
87
93
98
99
99
84
93
10
Virology Journal 2008, 5:40 />Page 5 of 19
(page number not for citation purposes)
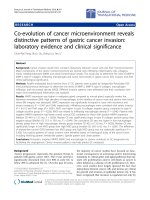
Evolutionary relationships of circulating H3N2 and H1N1 influenza A viruses sampled in Denmark from 1999 to 2006Figure 3
Evolutionary relationships of circulating H3N2 and H1N1 influenza A viruses sampled in Denmark from 1999 to 2006. The
nucleotide coding region trees were generated with maximum parsimony, heuristic random branch swapping search (neighbor
joining and maximum likelihood analysis revealed the same tree topology). Bootstrap values of 1000 resamplings in per cent
(>70%) are indicated at key nodes. The trees for H3N2 and H1N1 PB2, PB1, PA and NP genes are mid-point rooted for means
of clarity. Reference sequences referred to in the text are shown in bold. The A/Fujian/411/02(H3N2) reference sequence is
represented by A/Wyoming/03/03.
PB1
PA NP
H3N2
H1N1
H3N2
H1N1
H1N1
H3N2
PB2
A/California/07/04
2004-2005
A/Denmark/84/05
2004-2005
A/Denmark/67/05
2005-2006
A/Denmark/35/05
2004-2005
A/Denmark/68/05
A/Wisconsin/67/05
2005-2006
A/Denmark/10/06
A/Wellington/01/04
2003-2004
A/Denmark/1-2/04
2005-2006
A/Denmark/112/06
A/Wyoming/03/2003
2002-2003
A/Denmark/41/03
A/Moscow/10/99
A/Denmark/205/00
A/Denmark/35/00
1999-2000
2002-2003
A/Denmark/12/03
2003-2004
A/Denmark/86/03
A/New York/55/01
2001-2002
A/Denmark/08/02
2001-2002
A/Denmark/22/02
2002-2003
A/Denmark/13/03
A/Denmark/81/03
A/Denmark/15-2/04
2003-2004
A/Texas/36/91
2000-2001
A/Denmark/40/01
2000-2001
A/Denmark/40/00
A/NewCaledonia/20/99
2000-2001
A/Denmark/11/01
2005-2006
A/Denmark/47/06
2005-2006
A/Denmark/49/06
A/Denmark/22/05
A/Denmark/16/04
2004-2005
76
97
98
99
51
49
75
90
99
50
A/Denmark/67/05
A/Denmark/84/05
2004-2005
A/California/07/04
2004-2005
A/Denmark/68/05
2003-2004
A/Denmark/1-2/04
A/Wellington/01/04
2005-2006
A/Denmark/35/06
A/Wyoming/3/03
2002-2003
A/Denmark/41/03
A/Wisconsin/67/05
A/Denmark/10/06
A/Denmark/112/06
2005-2006
2002-2003
A/Denmark/12/03
2003-2004
A/Denmark/86/03
A/Denmark/205/00
A/Denmark/35/00
1999-2000
A/Moscow/10/99
A/New York/55/01
2002-2003
A/Denmark/13/03
2001-2002
A/Denmark/22/02
A/Denmark/81/03
A/Denmark/15-2/04
2003-2004
A/Texas/36/91
2000-2001
A/Denmark/40/01
2000-2001
A/Denmark/40/00
A/New Caledonia/20/99
2000-2001
A/Denmark/11/01
2005-2006
A/Denmark/47/06
2005-2006
A/Denmark/49/06
A/Denmark/16/04
A/Denmark/22/05
2004-2005
89
90
43
93
94
35
90
55
84
99
78
96
50
H3N2
H1N1
H1N2
H1N2
A/Denmark/67/05
A/Denmark/84/05
A/Denmark/68/05
2004-2005
A/California/07/4
2005-2006
A/Denmark/35/06
A/Wellington/01/04
2003-2004
A/Denmark/1-2/04
A/Wyoming/03/03
2002-2003
A/Denmark/41/03
2005-2006
A/Denmark/112/06
A/Wisconsin/67/05
2005-2006
A/Denmark/10/06
A/Moscow/10/99
1999-2000
A/Denmark/205/00
1999-2000
A/Denmark/35/00
2002-2003
A/Denmark/12/03
A/New York/55/01
2001-2002
A/Denmark/08/02
2001-2002
A/Denmark/22/02
2002-2003
A/Denmark/13/03
A/Denmark/15-02/04
A/Denmark/81/03
2003-2004
A/Texas/36/91
2000-2001
A/Denmark/40/01
2000-2001
A/Denmark/40/00
A/New Caledonia/20/99
2000-2001
A/Denmark/11/01
2005-2006
A/Denmark/47/06
2005-2006
A/Denmark/49/06
A/Denmark/22/05
A/Denmark/16/04
2004-2005
98
99
99
100
92
33
66
99
97
97
20
H1N2
A/California/07/05
2004-2005
A/Denmark/67/05
2005-2006
A/Denmark/35/06
2004-2005
A/Denmark/68(05
2004-2005
A/Denmark/84/05
2003-2004
A/Denmark/1-2/04
A/Wellington/01/04
A/Wyoming/03/03
2002-2003
A/Denmark/41/03
2005-2006
A/Denmark/112/06
A/Wisconsin/67/05
2005-2006
A/Denmark/10/06
A/Moscow/10/99
A/Denmark/205/00
A/Denmark/35/00
1999-2000
2002-2003
A/Denmark/12/03
2003-2004
A/Denmark/86/03
2002-2003
A/Denmark/13/03
2001-2002
A/Denmark/22/02
A/New York/55/01
2001-2002
A/Denmark/08/02
A/Denmark/81/03
A/Denmark/15/02/04
2003-2004
A/Texas/36/91
2000-2001
A/Denmark/40/01
A/New Caledonia/20/99
2000-2001
A/Denmark/11/01
2000-2001
A/Denmark/40/00
2005-2006
A/Denmark/47/06
2005-2006
A/Denmark/49/06
A/Denmark/22/05
A/Denmark/16/04
2004-2005
99
99
71
99
99
100
70
97
74
20
H1N2
Virology Journal 2008, 5:40 />Page 6 of 19
(page number not for citation purposes)
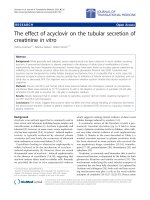
Evolutionary relationships of circulating H3N2 and H1N1 influenza A viruses sampled in Denmark from 1999 to 2006Figure 4
Evolutionary relationships of circulating H3N2 and H1N1 influenza A viruses sampled in Denmark from 1999 to 2006. The
nucleotide coding region trees were generated with maximum parsimony, heuristic random branch swapping search (neighbor
joining and maximum likelihood analysis revealed the same tree topology). Bootstrap values of 1000 resamplings in per cent
(>70%) are indicated at key nodes. The trees for H3N2 and H1N1 M and NS and H1N1 HA and NA genes are mid-point
rooted for means of clarity. Reference sequences referred to in the text are shown in bold. The A/Fujian/411/02(H3N2) refer-
ence sequence is represented by A/Wyoming/03/03.
NSM
H1 N1
H3N2
H1N1
H3N2
H1N1
2003-2004
A/Denmark/1-2/04
2004-2005
A/Denmark/68/05
A/California/07/04
A/Wellington/03/03
2005-2006
A/Denmark/35/06
A/Denmark/67/05
A/Denmark/84/05
2004-2005
A/Wyoming/3/03
2002-2003
A/Denmark/41/03
2005-2006
A/Denmark/112/06
A/Wisconsin/67/05
2005-2006
A/Denmark/10/06
A/Moscow/10/99
A/Denmark/35/00
A/Denmark/205/00
1999-2000
2002-2003
A/Denmark/12/03
2003-2004
A/Denmark/86/03
A/New York/55/01
2001-2002
A/Denmark/08/02
2001-2002
A/Denmark/22/02
2002-2003
A/Denmark/13/03
A/Denmark/81/03
A/Denmark/15-2/04
2003-2004
A/Texas/36/91
2000-2001
A/Denmark/40/01
A/New Caledonia/10/99
2000-2001
A/Denmark/11/01
2000-2001
A/Denmark/40/00
2005-2006
A/Denmark/47/06
2005-2006
A/Denmark/49/05
A/Denmark/22/05
A/Denmark/16/04
2004-2005
99
84
78
97
99
99
10
H1N2
A/Denmark/84/05
A/Denmark/67/05
2004-2005
A/California/07/04
2005-2006
A/Denmark/112/06
2003-2004
A/Denmark/1-2/04
A/Wisconsin/67/05
2004-2005
A/Denmark/68/05
2005-2006
A/Denmark/35/06
2002-2003
A/Denmark/41/03
2005-2006
A/Denmark/10/06
A/Wyoming/03/03
A/Wellington/01/04
A/Denmark//35/00
A/Denmark/205/00
1999-2000
A/Moscow/10/99
2002-2003
A/Denmark/12/03
2003-2004
A/Denmark/86/03
A/Denmark/15-2/04
A/Denmark/81/03
2003-2004
2001-2002
A/Denmark/22/02
2002-2003
A/Denmark/13/03
A/New York/55/01
2001-2002
A/Denmark/08/02
A/Texas/36/91
2000-2001
A/Denmark/40/01
A/New Caledonia/20/99
2000-2001
A/Denmark/11/01
2000-2001
A/Denmark//40/00
2005-2006
A/Denmark/47/06
2005-2006
A/Denmark/49/06
A/Denmark/16/04
A/Denmark/22/05
2004-2005
99
99
99
83
94
10
H1N2
A/Denmark/54/05
A/Denmark/110/05
A/Denmark/116/05
A/Denmark/29/05
A/Denmark/22/05
A/Denmark/15/04
A/Denmark/17/04
A/Denmark/16/04
A/Denmark/03/05
A/Denmark/11/05
2004-2005
2005-2006
A/Denmark/48/06
A/Denmark/50/06
A/Denmark/49/06
2005-2006
2000-2001
A/Denmark/16/01
2005-2006
A/Denmark/47/06
A/Denmark/03/01
A/Denmark/11/01
2000-2001
A/Denmark/86/03
A/Denmark/12/03
A/Denmark/56/03
A/Denmark/50/03
H1N2
A/New Caledonia/20/99
A/Denmark/20/01
A/Denmark/40/00
2000-2001
A/Beijing/262/95
A/Texas/36/91
A/Johannesburg/82/96
A/Denmark/40/01
A/Denmark/17/01
A/Denmark/06/01
A/Denmark/14/01
2000-2001
100
100
99
95
86
98
97
97
100
100
100
100
10
I
II
A/Denmark/22/05
A/Denmark/54/05
A/Denmark/110/05
A/Denmark/79/05
A/Denmark/116/05
A/Denmark/15/04
A/Denmark/17/04
A/Denmark/03/05
A/Denmark/16/04
A/Denmark/11/05
2004-2005
2005-2006
A/Denmark/48/06
A/Denmark/50/06
A/Denmark/49/06
2005-2006
2000-2001
A/Denmark/16/01
2005-2006
A/Denmark/47/06
A/New Caledonia/20/99
A/Denmark/03/01
A/Denmark/11/01
2000-2001
A/Denmark/40/00
A/Denmark/20/01
2000-2001
A/Texas/36/91
A/Johannesburg/82/96
A/Denmark/40/01
A/Denmark/17/01
A/Denmark/14/01
A/Denmark/06/01
2000-2001
100
100
99
100
94
100
95
99
96
88
10
II
I
Virology Journal 2008, 5:40 />Page 7 of 19
(page number not for citation purposes)
Table 1: Amino acid changes in H3N2, H1N1 and H1N2 viruses between seasons *
H3 N2 H1 N1
Amino acid 1999–00 2001–02 2002–03 2003–04 2004–05 2005–06 Amno acid 1999–00 2001–02 2002–03 2003–04 2004–05 2005–06 H1N2 Amino acid H3 no. 2000–01 2004–05 2005–06 H1N2 Amino acid N2 no. 2000–01 2004–05 2005–06
5 VGGGGG 18 A S(A) A(S) S S 43 53 L(R) L L L 15
Pa
15 V/I I I
25 LI(L)III19 T 47 56 I(T) I I I 23 23 M/I M M
33 HQQQQQ 23 L F(L) L(F) F F 57 66 V(I) I I I 45
Pb
49 H/Y H H
45
c
SI(S)24 MT69
Cb
78 L(S) L L L 48 52 I(V) I I
50
c
R G(R) G(E) G G 30 V I(V) V(I) I I 71 80 I(F) I I I 52 56 R/K R R/K
56 HH(Y) 40 YH(Y) 80 88 V(A) V V V 59 63 S/R S S
75
E
HQ(H)QQQ42 C F(C) C(F) F F 86 93 E(K) E E E 64 68 H/Q H H
83
E
EK(E)KKK44 SS(P)89 96 TA(T)75 79 V(I) V V
92
E
TKKKKK 65 II(T) 94 100 YH81
Pc
81 T/P T T
106 AVA(V) 93 NN(D)DS(N/D)120 124 D(E/G) E E E 83 83 V/M V V
112 V I(V) V(I) 143 G V(G) G(V) V V 130 134 -(K) - - - 93 93 S/P S S
126
a
ND(N)150 HH(G)133 136 S(T) S S S 94 94 II/V
128
b
TA(T) 172 K R K(R) R(K) 146 149 R(K) R R R 95 95 S/R S S
131
a
A T(A)TTT194 VV(I)153
Sb
156 G(E) G G G 149 149 V(I) V V
144
a
I D N(D) N(D) N N 199
b
E KKKK163
Sa
166 K(M) K K K 155 155 Y/F Y Y
145
a
KS/NN216 G V(G) G(V) V V 166
Ca1
169 V(A) A A A 173 172 K/R K K
155
b
H T(H)TTT221
b
K K(N) K(D/E) E 168 171 N(K) N N N 188
Pd
187 M/L M M
156
b
QH(Q)HHH258 EK170
Ca1
173 E(G) E E E 220 219 KK(E)K
159
b
YY(F)FF265 T I T(I) I(T) 175 177 LI222 221 Q(R) R R
164 LL(Q) 267 LTTTTTT179 181 VV(I)249
Pf
248 G/R G G
173
D
K E(K) E(K) 307 V I(V) V(I) I I 183 186 P(S) P P P 254 253 K/R K K
186
b
S GGGGG310 YY(H)185 188 I(M) I I I 262 261 K/R K K
188
b
DD(Y)329
c
N N(T) N(D) 187 190 D(N) D D D 270 269 N/D N N
189
b
SS(N)NN332
c
S F S(F) F(S) 190
Sb
193 AT274 273 F/Y F F
193
b
SF(S)370
c
LS(L)191 194 L(I) L L L 332
Pi
332 EKK
199 SS(P)372 SS(L)S(L)194 197 T(K) T T T 344
Pj
347 D(N) D D
202 VI(V)III385
a
K N(K) K(N) N N 202 205 V(L) V V V 352
Pk
355 K/R K K
222 W R(W)RRR392
a
II(T) 215 218 AT364 367 S(N) S S
225 G D(G) D D N(D) 393
a
NN(K) 237
Ca1
240 GG/R389
Pm
397 M/V V V
226
D
VII399
a
D E D(E) E(D) 239 242 T(S) T T T 396
Pm
399 I/M I I
227
D
SS(P)PP401
a
GD252 255 WR RW418 418 I/M I I
271 NDDDDD431 KN253 256 YFFY432
Pn
432 R(K) R R
304
c
AA/PA(P) 432 QEQ(E)E E E 267 269 T(I) T T T 450 450 NDD
347 VMV(M) 437 L W L(W) W(L) 271 273 P(S) P P P 452 452 D/E D D
361 TII 273 275 D(G) D D D
375 N D(N) D(N) 310 312 A(T) A A A
386 EG(E)GGG 315 317 VAVV
450 RR/K 321 323 I(V) I I I
452 RKKKKK 345 347 V(I) V V V
479 GE(G) 382 384 V(I) V V V
529 VIV(I) 398 400 NSNN
530 V A(V) A A A(V) 451 453 S(T) S S S
473 475 NDDN
491 493 E(K) E E E
506 508 ED
510 511 V(I) V V V
* Amino acids in brackets indicate less than half but more than two substitutions at the given amino acid position within a season. A single amino acid change in one position is not shown. Amino acids
separated by '/' indicate equal substitutions of either amino acid at the given position. Letters in upper case above an amino acid indicate the antigenic site location of the residue. In N1 the upper case
letter '
P
' stands for phylogenetically important region (PIR) and the following letters indicate the actual PIR.
Virology Journal 2008, 5:40 />Page 8 of 19
(page number not for citation purposes)
10/99(H3N2)-like viruses from the 1999–2000 season
(Figure 2, 3 and 4). One single H1N2 sample was col-
lected in the following 2003–2004 season and none have
been sampled since in Denmark.
Variations in the haemagglutinins
Variation among H3N2 viruses
The amino acid positions in H3N2 HA that have become
fixed after 1999–2000 are G5, Q33, K92, G186, D271 and
K452 (Table 1). After 2002, positions I25, Q75, K83,
T131, T155, H156, I202, R222 and G386 have been stable
(Table 1). Positions 50, 144, 145 and 225 had the highest
variability represented by three different amino acids
(Table 1).
The 2002–2003 season A/Fujian/411/02(H3N2)-like
strains possessed eight substitutions at antigenic sites in
HA compared to the strains of the previous A/New York/
55/01(H3N2)-like season (Table 2) and the highest ratio
of change was seen for antibody antigenic site B. This indi-
cate that the preferred antigenic site in the change to A/
Fujian/411/02(H3N2)-like strains was site B (P
epitope
=
0.190). The A/California/7/04(H3N2)-like strains from
2004–2005 showed changes at seven positions in the B-
cell antigenic sites compared to the A/Fujian/411/
02(H3N2)-like strains (Table 2) and again the preferred
antigenic site for change was site B (P
epitope
= 0.143). Sev-
eral changes were also observed at antigenic site D (P
epitope
= 0.073) (Table 2).
The H3 strain component of the 2006–2007 influenza
vaccine for the northern hemisphere was A/Wisconsin/
67/05(H3N2). We measured the rate of change at anti-
genic sites between the A/California/7/04(H3N2)-like
viruses from 2004–2005 and the 2005–2006 A/Wiscon-
sin/67/2005(H3N2)-like viruses. Only two substitutions
at HA antigenic sites defined the A/Wisconcin/67/
2005(H3N2)-like viruses (Table 2). Amino acids at posi-
tions 225 to 227 in H3 have greatly changed the last sea-
sons (Table 1). Position 226 and 227 are directly involved
in the antigenic site D.
Since the introduction of Fujian like strains in 2002–2003
there have been substitutions at sites that may influence
the capacity for egg growth; 131, 155, 156, 186, 222, 225
and 226 (possibly also positions 144, 145, 159 and 193)
[10] (Table 1). Amino acids 193, 222, 225, 226 and 227
are involved in receptor binding sites in the HA, therefore
the changes observed at these sites in our dataset may
influence receptor binding. Amino acids defining the T-
cell epitopes (after the list of Suzuki [11]) in HA have
remained unchanged since 1999.
Variation among H1N1 viruses
The phylogenetic H1N1 lineage II is characterised by an
amino acid deletion K130 (position 134 in H3 number-
ing) (Table 1) and certain amino acid differences in the
antibody antigenic sites; substitution M166K in the anti-
genic site Sa, E156G in site Sb, V169A and G173E in site
Ca1 and substitution S78L at site Cb (H3 numbering)
(Table 1). The calculated P
epitope
values indicate that anti-
genic site Ca1 has been the site with the largest proportion
of substitutions (P
epitope
= 0.500) in the change from H1
lineage I to lineage II (Table 1). Some isolates from 2005–
2006 possessed an additional change V181I. One change,
G240R, found in two of four isolates from 2005–2006, is
positioned in the Ca1 antigenic site (Table 1).
The H1N2 viruses
The HA gene of the Danish H1N2 viruses belong to the
H1N1 A/New Caledonia/20/99(H1N1)-like lineage II
with the K134 deletion. The HA from the H1N2 reas-
sorted strains possessed one additional substitution in the
antibody antigenic sites of HA, A193T (H3 numbering)
site Sb, compared to other HAs from lineage II H1N1
viruses. Other amino acids that characterised the HA
H1N2 viruses were: A96, I177, T218 and D508 (H3 num-
bering) (Table 1).
Table 2: Amino acid variations at antibody antigenic sites in HA (A-E) and NA (A-C) of H3N2 viruses 1999 to 2006
Haemagglutinin Neuraminidase
Antigenic
site
Moscow-New
York-like
New York-
Fujian-like
Fujian-
California-like
California-
Wisconsin-like
Moscow-New
York-like
New York-
Fujian-like
Fujian-
California-like
California-
Wisconsin-like
A I144D A131T
D144N
K145N D399E K385N
E399D
B S186G T128A
H155T
Q156H
A128T
Y159F
S189N
S193F E119K
K221E
C R50G S332F F332S L370S
D K173E
V226I
S227P
E173K
E T92K H75Q
E83K
Virology Journal 2008, 5:40 />Page 9 of 19
(page number not for citation purposes)
Variations in the neuraminidases
The amino acid change L267T in the N2 neuraminidase
has become fixed after 1999. NAs from 2004 to 2006 all
possess K199 and E432. Comparing consensus sequences
of the different phylogenetic clusters it is clear that after
1999 there have been changes at the antibody antigenic
sites of NA (Table 2). In addition, two out of ten H3N2
isolates from 2004–2005 and three out of ten H3N2 iso-
lates from the 2005–2006 seasons differed also at anti-
body antigenic site C N329T and N329D, respectively,
compared to the seasons before. The NAs of the H1N2
viruses were most closely related to the 1999–2000 sea-
sons A/Moscow/10/99(H3N2)-like viruses but varied at
six amino acid residues: M24T, E199K, E258K, L267T,
G401D and K431N (Tabel 1). Position K199 found in
antigenic site B, D401 in antigenic site A and N431 may
influence antigen binding. The observed changes at site 93
in N2 from 2003 to 2006 (Table 1) are located in the HLA-
A*0201 NA
90–99
(PQCNITGFAP) CTL epitope [12].
For the N1 viruses there have been several changes at phy-
logenetically important regions (PIRs) [13] (Table 1).
Changes were observed at regions equivalent to the N2
antigenic sites, namely: PIR-I E332K, PIR-J N344D, PIR-K
R352K, PIR-M M389V and M396I, and PIR-N K432R.
No genetic indication of neuraminidase drug resistance at
positions 119, 152, 274, 292 or 294 was found in the NA
dataset from 1999 to 2006.
Variations in the internal genes
The substitution PB2 (polymerase basic 2 protein) S569A
in the H3N2 sequences has become fixed after the 1999–
2000 season (not shown). All H3N2 isolates from 2004 to
2006 have changed at position V709I in the PB1 protein.
The lineage I H1N1 PA protein possessed the amino acid
C226 (as did the H3 isolates) instead of I226 found in the
H1 lineage II isolates. This position is part of a HLA-
A*0201 PA
225–233
(CLENFRAYV) T-cell epitope [12]. Also
the substitution V602I is located in the HLA-B*8 PA
601–609
(SVKEKDMTK) CTL epitope [14] for all H1N1 viruses and
the H3N2 2005–2006 season viruses.
The T146A substitution in the H3N2 NP protein has
become fixed after 1999–2000 season. The substitution
NP Y52H found in the A/California/7/04(H3N2)-like iso-
lates from 2004 to 2006 is located in a CTL epitope HLA-
A*01 NP
44–52
(CTELKLSDY) [15]. The H1N1 isolates pos-
sessed a S50N replacement in this epitope. The H3 A/New
York/55/01(H3N2)-like isolates from 2001–2002 and
2002–2003 together with the Fujian/New York reassor-
tants from 2003–2004 possessed K98 in the HLA-A*6801
NP
91–99
(KTGGPIYRR) [16]. Also H1N1 strains from the
lineage II possessed this change. The isolates from 1999–
2000 and after 2002 possessed the "original" CTL epitope
HLA-B*1508 NP
103–111
(KWMRELVLY) [17] while the
2001–2002 viruses possessed a K103R replacement. This
replacement was also seen in some 2003–2004 isolates.
All H1N1 isolates have the M105V replacement. The HLA-
B*4002 NP
251–259
(AEIEDLIFL) epitope has been con-
served in the H3N2 and H1N2 isolates. The H1N1 isolates
have a I257T substitution.
After 1999 CTL epitope HLA-B*1402 NP
146–154
(TTYQR-
TRAL) [18] has changed with the substitution T146A in
the H3 isolates, all H1 viruses still possess T146. The New
York/55/01(H3N2)-like viruses possessed the substitu-
tion V197I in the CTL epitope HLA-A*1101 NP
188–198
(TMVMELIRMVK) [12] as did the H1N1 viruses. The
H1N1 isolates also had a M191V change in this epitope
region. The A/Wisconsin/67/05(H3N2)-like viruses from
the 2005–2006 season changed in the CTL epitope HLA-
DQA1*0501/HLA-DQB1*0201 NP
365–379
(IASNENMD-
NMGSSTL) [19] with the substitution S377G. The H1N1
viruses had three amino acid differences in this epitope;
N373A, M374I and G375V. All virus subtypes in this data-
set had the R384G substitution in the CTL epitope HLA-
B*27 NP
383–391
(SPYWAIRTR) [14]. The A/Fujian/411/
02(H3N2), A/California/7/04(H3N2) and A/Wisconsin/
67/05(H3N2)-like viruses possess the substitution V425I
in the CTL-cell epitope HLA-B*0702/HLA-B*3501 NP
418–
426
(LPFEKSTVM) [20] as did the H1N1 viruses. Two addi-
tional differences were observed in this region of the
H1N1 viruses, E421D and S423T.
The H1N2 viruses differed in the M2 protein from the A/
Moscow/10/99(H3N2)-like viruses with the amino acid
substitutions; G16E, C17Y and N20S. The substitution
V15I in the M1 protein located in the HLA-A*1101 M1
13–
21
epitope [12] was found in two of the H1 isolates from
2000–2001, one in lineage I and one in lineage II. The
H3N2 and H1N2 viruses in this dataset before 2005–06
had the substitution R174K in CTL epitope HLA-B*39
M1
173–181
(IRHENRMVL) [14]. The substitution S31N in
the M2 protein of the A/Wisconsin/67/05(H3N2)-like
2005–2006 viruses indicates resistance to the influenza
matrix ion channel inhibitory drug amantadine [21,22].
H3N2 NS1 (non-structural protein) amino acids that have
become fixed after 1999 are K26E and E221K. The NS1
CTL epitope HLA-DR*03 NS1
34–42
(DRLRRDQKS) identi-
fied in H1N1 and H5N1 viruses [23] has the substitution
K41R in the H3N2 viruses from this dataset. The HLA-
A*0201 NS1
122–130
(AIMDKNIIL) epitope identified in
H1N1 viruses has the D125E and I129M amino acid dif-
ferences in the H3N2 isolates. There has been a substitu-
tion, F166L, in the HLA-B*44 NS1 158–166 CTL epitope
[24] for 2000–2001 H1N1 isolates in both lineage I and
lineage II.
Virology Journal 2008, 5:40 />Page 10 of 19
(page number not for citation purposes)
Glycosylation patterns
Eight potential N-glycosylation sites in H3 HA1 have been
constant since 1999, namely: 8, 22, 63, 133, 165, 246, 285
in H1 and 483 in HA2 (Figure 5). These glycosylation sites
have been conserved in our dataset from 1999 to 2006.
The A/Moscow/10/99(H3N2)-like viruses from the 1999–
2000 season possessed two additionally predicted sites 38
and 126. The A/New York/55/01(H3N2)-like viruses
from the 2001–2002 season had lost the position 38
sequon but possessed the potential glycosylation site at
position 126. The position 38 sequon was observed after
1999–2000, but the predicted score has been below the
set threshold value of 0.5 and therefore not included in
the count further (Figure 5). In 2002–03 two out of four
A/New York/55/01(H3N2)-like viruses possessed ten
potential glycosylation sites. Compared to the A/New
York/55/01(H3N2)-like viruses from the season before,
they gained a glycosylation at position 144. The A/Fujian/
411/02(H3N2)-like viruses from the 2002–2003 season
possessed nine potential glycosylations, they kept the
newly introduced sequon at position 144 but did not pos-
sess the 126 sequon (Figure 5). The 2003–2004 A/Fujian/
411/02(H3N2)-like reassorted viruses had the same glyc-
osylation pattern as the previous season Fujian-like
viruses. However, Fujian-like viruses that neither pos-
sessed the 126 nor the 144 potential glycosylation
sequons were also observed, resulting in a total of eight
potential sites only. The A/Wellington/1/04(H3N2)-like
viruses from 2003–2004 season possessed ten potential
glycosylation sites. In addition to the eight conserved they
had glycosylation sites at position 126 and 144. The A/
California/7/04(H3N2) and A/Wisconsin/67/05(H3N2)-
like viruses from 2004 to 2006 have the same ten glyco-
sylation sites as the A/Wellington/1/04(H3N2)-like
viruses. Both position 126 and 144 are located at HA anti-
genic site A.
Six potential N-linked glycosylation sites were predicted
for N2 strains from 1999 to 2003, namely: 61, 70, 86, 93,
146 and 234 (Figure 5). In the 2003–2004 season a
Fraction of predicted N-linked glycosylation sequons in HA and NA of H3N2 and H1N1 viruses sampled in Denmark seasons 1999 to 2006Figure 5
Fraction of predicted N-linked glycosylation sequons in HA and NA of H3N2 and H1N1 viruses sampled in Denmark seasons
1999 to 2006. Sites with predicted potential threshold values above 0.5 are shown. Sites not shown for H3 (n = 204): 122, N2
(n = 166): 200, 329, 402, H1 (n = 27): 10, position 539 is positively predicted; however this site is located at the cytosolic
region of HA and is therefore not glycosylated, N1 (= 30): 455.
0 100 200 300 400 500 600
0
0.2
0.4
0.6
0.8
1
Amino acid position
Fraction of N-linked glycosylation site
0
1
0
0
2
0
0
3
0
0
4
0
0
5
0
0
0
0
.
2
0
.
4
0
.
6
0
.
8
1
A
m
i
n
o
a
c
i
d
p
o
s
i
t
i
o
n
F
r
a
c
t
i
o
n
o
f
N
-
l
i
n
k
e
d
g
l
y
c
o
s
y
l
a
t
i
o
n
s
i
t
e
0 100 200 300
400 500
600
0
0.2
0.4
0.6
0.8
1
Amino acid
position
F
r
a
c
t
i
o
n
o
f
N
-
l
i
n
k
e
d
g
l
y
c
o
s
y
l
a
t
i
o
n
s
i
t
e
0
1
0
0
2
0
0
3
0
0
4
0
0
5
0
0
0
0
.
2
0
.
4
0
.
6
0
.
8
1
A
m
i
n
o
a
c
i
d
p
o
s
i
t
i
o
n
F
r
a
c
t
i
o
n
o
f
N
-
l
i
n
k
e
d
g
l
y
c
o
s
y
l
a
t
i
o
n
s
i
t
e
H3
N2
H1
N1
Virology Journal 2008, 5:40 />Page 11 of 19
(page number not for citation purposes)
minority of the isolates and all of the isolates the follow-
ing season had lost the potential site 93. The 93 predicted
sequon was seen again in three (A/Wisconsin/67/
05(H3N2)-like) out of ten isolates from the 2005–2006
season. The same glycosylation pattern was observed for
the NA of both H3N2 and H1N2 sequences.
The H1 HA strains from 1999 to 2006 have seven pre-
dicted potential N-linked glycosylation sites in HA1 (11,
23, 54, 87, 125, 159, 286) and one in HA2 (480) (H1 lin-
eage II numbering) (Figure 5). The exception is one single
isolate (A/Denmark/03/05) from 2004–2005 which
lacked the sequon at position 54. The isolates in lineage I
possessed one additional sequon at position 268; how-
ever the calculated potential was below the threshold
value of 0.5 and therefore not counted (Figure 5). Three
out of four HA H1N2 sequences lacked the position 87
sequon.
The eight potential glycosylation sites in the N1 NA pro-
tein have been conserved since 1999 (positions 44, 58,
63, 70, 88, 146, 235 and 434).
Sequence data
The proposed "jump" in the evolution of H3 with the
introduction of the A/Fujian/411/02(H3N2)-like viruses
in 2002–2003 can also be seen in Figure 6. Rather than
constant drift the genes have evolved in a more stochastic
like process (Figure 6). The evolution of H3N2 viruses was
influenced by a reassortment event in 2003–2004 where
the drifted A/Fujian/411/02(H3N2)-like viruses acquired
a A/New York/55/01(H3N2)-like backbone from viruses
that circulated in 2001–2002 and to some extent in 2002–
2003 (Figure 2, 3 and 4). The 2003–2004 viruses had few
variations in the HA compared to the previous season and
the 2005–2006 viruses had few variations compared to
viruses circulating the season before, both in HA and NA
genes (Figure 6B). These stasis-periods might indicate a
well fit virus in less need for change.
Based on the ratio of non-synonymous versus synony-
mous substitutions none of the influenza A genes were
directly influenced by positive selection (dN/dS<1) (Table
3). However, as expected the HA1 region of both H3 and
H1 viruses were more influenced by evolutionary pressure
(Table 3). We applied FEL and SLAC maximum-likeli-
hood methods to estimate individual positively selected
sites in H3N2 HA and NA and added REL for smaller data-
sets in all genes (se methods section). The FEL method
found one site in the H3 protein (n = 204), position 199
(p = 0.046) to be positively selected, while the more con-
servative SLAC analysis found none. No positive selected
sites were predicted for the N2 genes (n = 166) and none
in the internal genes (n = 15) estimated by FEL and SLAC.
The REL analysis retrieved four sites in the M1 gene to be
selected namely positions 208, 211, 218 and 219. No sites
in HA (n = 27) and NA (n = 30) of the H1N1 viruses were
directly positively selected with any of the three methods
of analysis.
Discussion
Prevalence of influenza A from 1999–2006 in Denmark
The H3N2 strains have had the highest prevalence since
1999 in Denmark. The H3N2 strains have undergone
more changes in the antigenic sites each season in HA and
NA than have H1N1 strains, thereby evading the host
immune system more efficiently than H1N1. The excep-
tion is the 2000–2001 season which was dominated by a
newly introduced H1N1 strain, the lineage II A/New Cal-
edonia/20/99(H1N1)-like viruses, antigenically different
from the previous lineage I-like viruses (A/Bayern/7/
95(H1N1)-like).
In 2002–2003 the H1N2 reassorted strain was observed in
Denmark for the first time. This strain probably emerged
in South Asia in 2001 and spread to many countries
[4,25,26] The H1N1 component in the vaccine for that
season matched the H1 and the H3N2 component
matched the N2 subtypes of the reassortant strain.
Thereby, the new strain was expected fully covered by the
vaccine for that season [26] and it was anticipated that
there would be some extent of herd immunity in the pop-
ulation against this new reassortant.
Genetic evolution of influenza A
The phylogenetic trees of H3N2 HA and NA showed sea-
sonal clusters but also co-circulating lineages within sea-
sons. The introduction of the A/Fujian/411/02(H3N2)
strains in 2002–2003 caused a "jump" in the evolution of
both HA and NA genes. Many of the substitutions in HA
introduced with the A/Fujian/411/02(H3N2)-like viruses
have become fixed, probably reflecting a very fit virus. The
genetic variation before the 2003–2004 season may have
been more influenced by introduction of new viruses
through viral migration than adaptive evolution of the
genes. A constant rate of drift was not observed for HA but
instead periods of change followed by stasis periods. The
low dN/dS ratios (0.232 for HA and 0.247 for NA) also
indicated that the influenza genes were not directly influ-
enced by positive selection. Reassortments between co-cir-
culating strains and viruses from previous seasons, and
introduction of viruses from other parts of the world
might play a larger role than natural selection for some
seasons, as also observed by others [27,28].
The A/Fujian/411/02(H3N2)-like viruses, genetically and
antigenically different from the previous seasons, were
first seen in Denmark in 2002–2003. The 2002–2003 sea-
son was clearly a turning point in regard to circulating
influenza A H3N2 viruses in Denmark and caused a mis-
Virology Journal 2008, 5:40 />Page 12 of 19
(page number not for citation purposes)
(A) Seasonal amino acid distances of H3N2 HA and NA proteins since 1999 and (B) amino acid distances of H3N2 HA and NA from one season to the nextFigure 6
(A) Seasonal amino acid distances of H3N2 HA and NA proteins since 1999 and (B) amino acid distances of H3N2 HA and NA
from one season to the next. The same trends were observed for nucleotide distances. In 2000–2001 H1N1 viruses only were
observed and therefore not included. Distance means were computed as the arithmetic mean of all pair wise distances
between two seasons in the inter-season comparisons by the MEGA v.3.1 software [68]
0.00
1. 0 0
2.00
3.00
4.00
5.00
6.00
1999-00 2001-02 2002-03 2003- 04 2004- 05 2005- 06
Seasons
Amino acid differences (%)
HA
NA
A
B
2.1
1.8
2.8
2.7
1.5
2.9
2
3.1
1.2
1.2
0 2 4 6 8 10 12 14
HA
NA
HA
NA
HA
NA
HA
NA
HA
NA
Seasons
Amino acid differences (%)
2004-052003-04
2002-03
2001-02
2004-05
Virology Journal 2008, 5:40 />Page 13 of 19
(page number not for citation purposes)
match in the herd immunity of the population and in the
protection of the seasonal influenza vaccine containing
the A/Moscow/10/99(H3N2) strain [29]. The fitness of
the Fujian-like viruses in Denmark was increased by a
reassortment event in 2003–2004 when drifted HA A/
Fujian/411/02(H3N2)-like viruses acquired the rest of the
genome from A/New York/55/01(H3N2)-like viruses sea-
sons before. The reassortment has also been observed for
isolates from New York State [28]. This reassorted strain
caused the only epidemic in the study period in Denmark.
The increased fitness could have been a result of a more
effective New York-like NA, compared to the weak Fujian-
like NA circulating the season before shown by others
[30]. The HA genes from viruses circulating after 2002–
2003 are derived from the A/Fujian/411/02(H3N2)-like
viruses. The viruses circulating in the 2005–2006 season
had few variations in HA and NA compared to the viruses
circulating the season before. However; the internal genes
of the A/Wisconcin/67/05(H3N2)-like viruses, especially
PA, NP and M, were more realated to the A/Fujian/411/
02(H3N2)-like viruses rather than the previous seasons A/
California/07/04(H3N2)-like viruses.
Two H1N1 lineages, lineage I (A/Bayern/7/95(H1N1)-
like) and II (A/New Caledonia/20/99(H1N1)-like), co-
circulated in the 2000–2001 season in Denmark. A vari-
ant of A/Beijing/262/95(H1N1)-like viruses with the
K130 deletion was isolated in New Caledonia in the
southern Pacific in 1999, A/New Caledonia/20/
99(H1N1)-like viruses (lineage II). These viruses replaced
the A/Bayern/7/95(H1N1) lineage (lineage I) [31] as was
also the case in Denmark. Subsequently the northern
hemisphere vaccine composition was changed from A/
Beijing/262/95(H1N1) to A/New Caledonia/20/
99(H1N1) for the 2000–2001 season [32]. Since the
introduction of the A/New Caledonia/20/99(H1N1)-like
viruses to Denmark in 2000–2001 there have been few
substitutions in the glycoproteins. This is also seen in the
rest of the world and the H1N1 component in the triva-
lent vaccine recommended for the northern hemisphere
has been A/New Caldonia/20/99(H1N1) since 2000–
2001. The greater variability of the 2005–2006 H1N1
viruses observed in the phylogenetic trees possibly indi-
cates that the virus is changing. If the new viruses are able
to evade the host immune system more efficiently, H1N1
may become the prevalent strain again in near future.
The reassorted H1N2 strain was first observed in Denmark
in 2002–2003, while circulating in many parts of the
world in 2001–2002 [2,4,25,26]. The reassorted H1N2
viruses possessed only the HA from A/New Caldonia/20/
99(H1N1)-like viruses and the rest of the genome from A/
Moscow/10/99(H3N2)-like viruses as also reported by
others using partial sequences [25]. The H1N2 viruses
have been introduced to Denmark from elsewhere and are
not a local reassortant.
Amino acid changes in the haemagglutinins
Key positions in H3 HA for antibody antigenic change are
144 and 145 located in antigenic site A. Changes in the
140–146 region, antigenic site A, is characteristic for anti-
genically distinct viruses of epidemic significance [33].
Post-infection sera contain antibodies that recognise
mainly residue 144 but also residue 198 and 157 on site
B [34,35]. Position 144 changed from I144 to D144
between 1999–2000 and 2001–2002 and further to N144
with the introduction of the A/Fujian/411/02(H3N2)-like
viruses in 2002–2003. This important residue (N144) has
hereafter remained unchanged. Several amino acid substi-
tutions introduced with the A/Fujian/411/02(H3N2)-like
viruses were retained the subsequent seasons (Table 1)
suggesting they may be important for viral escape from
the host immune system and the overall fit of the virus.
The A/Fujian/411/02-like(H3N2) viruses did not antigen-
ically match the A/Moscow/10/99(H3N2) strain included
in the 2002–2003 vaccine [29,36]. The HA substitution
D144N was however not responsible for the antigenic
drift of the Fujian-like viruses. It has been shown that only
two amino acid changes, H155T and Q156H, specified
the antigenic difference from Moscow-like to Fujian-like
[37], both are located at antigenic site B. The T155 and
H156 amino acids have been maintained in all Danish
isolates after the introduction of the Fujian-like viruses.
Table 3: Non-synonymous/synonymous substitution ratio for
H3N2 and H1N1 isolates sampled in Denmark from 1999 to
2006*
Gene dN/dS
H3N2 H1N1
a
HA 0.23 0.18
HA1 0.53 0.21
HA2 0.11 0.08
NA 0.25 0.17
PB2 0.06 Na
PB1
b
0.07 Na
PA 0.08 Na
NP 0.08 Na
M1 0.07 Na
M2 0.38 Na
NS1 0.23 Na
NS2 0.19 Na
* dN/dS is the ratio of nonsynonymous vs. synonymous substitutions
calculated by SLAC likelihood analysis.
a
The internal genes of H1N1 viruses were not included due to the
few sequences available (Na). H3 n = 204, N2 n = 166, internal genes
n = 15, H1 n = 27, N1 n = 30.
b
dN/dS for PB1-F2 was not included because the method used was
biased by the PB1-F2 +1 reading frame from PB1. Synonymous
substitutions in PB1 would therefore be assigned as non-synonymous
in PB1-F2 not reflecting positive selection on the PB1-F2 itself.
Virology Journal 2008, 5:40 />Page 14 of 19
(page number not for citation purposes)
With the A/California/7/04(H3N2)-like viruses in 2004–
2005, site 145 has changed from K to S in some isolates
and to N in others. S145 has been found at this position
before 1999 and N145K was the only cluster-difference
substitution between isolates from the seasons 1987/
1989 and 1992/1995 [38]. It was therefore suggested that
substitutions at this site alone could have large antigenic
effect. Antigenic site A, located in a loop, makes few con-
tacts with the rest of the structure, therefore 144 and 145
may change drastically without influencing on the overall
shape of the HA molecule.
Antigenic site A is supposed to be ideal for antibody bind-
ing and for amino acid replacements [33]. The preferred
antigenic site in the change from A/Moscow/10/
99(H3N2) to A/Fujian/411/02(H3N2)-like viruses was
site B. This observation is in accordance with previously
published data [39]. One region in HA, position 225 to
227, that influence antigenic site D, has changed drasti-
cally during the study period from GVS → DVS → DIP →
NIP. The influence of antigenic site D was first apparent in
the antigenic change from Fujian-like viruses to Califor-
nia-like viruses; however, the antigenic site B was still the
preferred site for antigenic change. It has been proposed
that a minimum of four substitutions in two or more anti-
body binding sites are required for an epidemically
important strain [40]. The 2002–2003 A/Fujian/411/
02(H3N2)-like viruses in Denmark had changed at eight
positions in four HA antigenic sites and three changes in
two NA antigenic sites compared to the 2000–2001 New
York-like viruses. The change from Fujian-like to Califor-
nia-like viruses involved seven changes at three HA anti-
genic sites and two changes at one NA antigenic site. The
vaccine composition was subsequently changed for the
2005–2006 season [9]. The 2006–2007 vaccine composi-
tion was again changed to include A/Wisconsin/67/
05(H3N2). The observed difference from circulating Dan-
ish California-like to Wisconsin like viruses involved only
two substitutions at two antigenic sites in HA and one in
NA.
Neuraminidase
Gulati et al., [41] have suggested that new antigenic vari-
ants may arise from changes that influence on N2 anti-
genic site B. The A/Fujian/411/02(H3N2)-like reassorted
viruses from 2003–2004 introduced a E199K change in
NA which since has become fixed in Danish isolates. The
A/Wisconsin/67/05(H3N2)-like viruses from 2005–2006
introduced the K221E substitution, both found in the
antigenic site B. Neuraminidase substitutions inducing
resistance to neuraminidase inhibitory drugs like amanta-
dine might include one or more of the amino acid resi-
dues 119, 152, 274, 292 and 294 (N2 numbering). The
most frequent NA substitutions observed in vitro are the
active site residues E119G/D/A and R292K [22,42-45].
The substitution H274Y is the only neuraminidase resist-
ance mutation identified in H1N1 viruses to date [46,47].
Danish isolates did not possess any resistance mutations
in the NAs. Neuraminidase inhibitory drugs are rarely
used for influenza prophylaxis or treatment in Denmark.
Internal proteins
T-cell epitopes are more conserved than antibody
epitopes. Fifteen per cent of the T-cell epitopes are con-
served while only 2.7% of the antibody epitopes [48]. The
reason for this higher degree of conservation is that 80%
of the antibody epitopes are located in the variable glyco-
proteins HA and NA, while only 40% of the T-cell
epitopes are found in these proteins [48]. Recent research
has shown some degree of escape from CTL-mediated
immunity in addition to escape from neutralizing anti-
bodies [28]. In our dataset we found several substitutions
in regions involved in protective T-cell response [48] in
NA, PA, M1, NS1 and most in the NP protein. This is not
unexpected because most T-cell epitopes are defined for
the NP protein and this protein is the main target for the
cytotoxic host immune response [49,50]. The extensive
variations in the T-cell epitopes during 1999 to 2006 sug-
gest that these regions and the antibody epitopes are
working together for efficient escape from the host
defence responses.
The M2 proteins from the Danish Wisconsin-like viruses
in 2005–2006 possessed the substitution S31N, associ-
ated with resistance to matrix inhibitory drugs, like aman-
tadine [22,44,45,51]. These types of drugs are not used for
prophylaxis or treatment in Denmark. The S31N substitu-
tion is therefore not a local introduced resistance muta-
tion. We cannot exclude that this substitution has arisen
by chance, but it is more likely that the mutation has
emerged as a resistance mutation in other countries like
the USA [52] and Australia [53] where the prevalence of
amantadine resistance is high. The resistance may also be
related to the increased use of this drug in Asia during the
SARS epidemic [21].
Variations in receptor specificity
The A/Fujian/411/02(H3N2)-like clinical Danish viruses
had several substitutions in HA at sites that might influ-
ence the virus' capability for egg growth [10,37]. These
include; A131T, I144N, H155T, Q156H, W222R and
G225D. The A/California/20/99(H3N2)-like viruses had
further changes at positions K145S/N, Y159F, S193F and
V226I and A/Wisconsin/67/05(H3N2) possessed in addi-
tion S193F and D225N. All isolates after the 1999–2000
A/Moscow/10/99(H3N2)-like viruses possess S186G. In
recent years H3N2 viruses have had poor replication effi-
ciency in eggs [54,55]. It has been shown that positions
186, 226 and 196 are critical determinants for egg growth.
The changes G186V and V226I increased egg viral replica-
Virology Journal 2008, 5:40 />Page 15 of 19
(page number not for citation purposes)
tion of A/Fujian/411/02(H3N2) viruses so did the
changes G186V and A196T for A/California/20/
99(H3N2) viruses [56,57]. On the contrary, others have
stated that the V226I change in combination with T155
and H156 do not result in viral recovery in eggs [37,54].
This might explain the delay in the 2006–2007 vaccine
production for the northern hemisphere due to egg prop-
agation difficulties with the A/Wisconsin/67/05(H3N2)
strain. The influence on replication efficiency by the other
substitutions observed at receptor binding sites should be
investigated further.
We did not observe amino acids in the N2 NA protein that
would decrease virus replication in eggs. The amino acids
known to give good replication in eggs (Q119, K136 and
Y347) [56] were all present in this dataset.
N-linked glycosylation pattern
Oligosaccharides at the surface proteins HA and NA might
have greater impact on viral escape from the immune sys-
tem than single amino acid changes in the antigenic sites.
Oligosaccharides which are recognised as "self" by the
host immune system may pose conformational changes
in the molecule and mask antigenic sites, thereby prevent
binding of host antibodies. The number of N-linked glyc-
osylation sites in the H3 HA protein has increased during
the years from only three attachment sites in 1968 [58,59]
to ten predicted sites in the Danish isolates after 2004.
The A/Fujian/411/02(H3N2)-like stains from the 2002–
2003 season gained a potential glycosylation site at posi-
tion 144, thereby masking the supposed "key" site for
antigenic change [33]. Substitutions at antigenic site B
and the predicted N-glycosylation at position 144 in HA
antigenic site A together with a stronger NA might have
contributed to the increased infectivity of the reassorted
Fujian-like viruses of the 2003–2004 season, causing an
epidemic in Denmark. We have shown that the preferred
antibody epitope for genetic change is antigenic site B for
the Danish dataset also reflecting that site A is camou-
flaged by glycosylation. Thus the antigenic changes at a
glycosylated site A may not play a major role in escape
from the immune system as long as the glycosylation is
present.
Six potential N-glycosylation sites have been conserved in
the N2 NA Danish dataset from 1999 to 2003. The major-
ity of isolates from 2003 to 2006 have lost the site at posi-
tion 93 which is located in a CTL epitope (HLA-A*0201)
region of NA [12]. The recent NAs may therefore be more
easily recognised by the cytotoxic immune system. We
found two predicted N-glycosylation sites (61 and 70) in
the N2 NA stalk region in sequences from 1999–2006.
Greater density of carbohydrate in the stalk region of NA
might reflect a need for proteolytic protection. The two
observed carbohydrates in the stalk have been reported
for other isolates in other time periods and other conti-
nents [58,60]. The stalk region has therefore stayed
unchanged and the two sequons seem to be conserved.
Sequence data
As expected a higher dN/dS ratio was observed for the sur-
face glycoproteins, although none were directly influ-
enced by positive selection. We observed that the HA1
region and the M2 protein have a slightly higher global
dN/dS ratio than the other genes (Table 3). This is consist-
ent with the findings of others [11,61]. The M2 protein is
a membrane ion channel protein on the surface of the
virus molecule, a higher dN/dS ratio for this protein com-
pared to the internal proteins is expected. The ratio might,
however, be biased because the M2 protein is spliced from
M and the dS is suppressed for overlapping regions giving
a higher dN/dS ratio [11].
Earlier findings support positive selection at sites involved
in receptor and antigen binding [11,62]. Five of the 18
codons in HA proposed by Bush et al., [63] to be under
positive selection were found to have changed in our HA
dataset of H3N2 since 1999, namely: pos 145, 156, 186,
193 and 226. In our H3 dataset (n = 204) site 199 was
influenced by positive selection as calculated by FEL anal-
ysis, but no positively selected sites were found applying
the more conservative SLAC method. Position 199 may be
involved in receptor binding and influence on the virus
ability to grow in eggs [10]. In a similar study on a slightly
larger dataset (n = 284) positions 220 and 229 were found
to be positively selected [11]. Another study found posi-
tions 13 and 236 [62]; however, suggested positively
selected sites may vary by the dataset applied, method
used and the significance level selected for a site to be clas-
sified as positively selected. REL analysis identified four
sites (208, 211, 218 and 219) in M1 under positive selec-
tion pressure. REL analysis tends to give better estimates
on small datasets than SLAC and FEL. Sites 211, 218, and
219 were still selected when the bayes factor cut-off was
increased from 50 to 200. Further analysis would be
needed to determine if these sites actually are positively
selected.
Conclusion
There is a need for complete genome analysis of European
human influenza A viruses in order to gather a compre-
hensive picture of the evolution and migration of viruses.
Our results support the suggestion that the evolution of
influenza A viruses is more complex than originally
believed [28,62]. Local short term evolution of influenza
virus is a stochastic process, also involving gene reassort-
ments. It will be interesting to further investigate how
viruses from other parts of Europe influence on the evolu-
Virology Journal 2008, 5:40 />Page 16 of 19
(page number not for citation purposes)
tion of Danish isolates when more full length sequences
from Europe are made public.
Methods
Human samples
A total of 234 Danish human nasal swab suspensions or
nasopharyngeal aspirates positive for influenza A, from
1999 to 2006, were available at the WHO National Influ-
enza Centre, Copenhagen. The seasonal distribution was
as follows: 1999–2000 15 samples, 2000–2001 13 sam-
ples, 2001–2002 10 samples, 2002–2003 30 samples,
2003–2004 76 samples, 2004–2005 51 samples and
2005–2006 39 samples. Based on the phylogenetic clus-
tering of all HAs and NAs, ten representative samples from
each season and each subtype, if possible, were selected
for further analysis.
RNA extraction and full-length one-step RT-PCR
Viral RNA was extracted from 140 µl of human nasal swab
suspension or nasopharyngeal aspirate by QIAamp
®
Viral
RNA Mini Kit (QIAGEN, Germany) as described by the
manufacturer or by an automated MagNA Pure LC Instru-
ment applying the MagNa Pure LC Total Nucleic Acid Iso-
lation Kit (Roche Diagnostics, Basel, Switzerland). The
different gene segments were amplified by OneStep RT-
PCR Kit (QIAGEN) as previously described [64], applying
a two minute elongation step for all genes. The primers for
RT-PCR were segment specific but subtype universal tar-
geting the highly conserved noncoding RNA regions at the
5'- and 3'-end of each segment [65]. PCR products were
purified using the GFX™ PCR DNA and Gel Band Purifica-
tion Kit (Amersham Biosciences, Germany) prior to
sequencing.
Sequencing and phylogenetic analyses
Purified PCR products were sequenced directly. Primer
sequences are available upon request. The sequencing
reaction was performed by ABI PRISM
®
BigDye™ Termina-
tors v3.1 Cycle Sequencing Kit (Applied Biosystems, USA)
as described previously [66]. The sequences were devel-
oped on an automatic ABI PRISM
®
3130 genetic analyzer
(Applied Biosystems) with 80 cm capillaries. Consensus
sequences were generated in SeqScape
®
Software v2.5
(Applied Biosystems). Sequence assembly, multiple align-
ment and alignment trimming were performed with the
BioEdit software v.7.0.5 [67]. Distance based neighbor
joining (NJ) phylogenetic trees and character based maxi-
mum parsimony (MP) trees were generated using the
Molecular Evolutionary Genetics Analysis (MEGA) soft-
ware v.3.1 [68]. Maximum likelihood trees were generated
by the Phylogenetic Analysis Using Parsimony (PAUP
4.0) Software (Sinauer Associates, Inc.) [69] applying the
HKY85 nucleotide model, allowing transitions and trans-
versions to occur at different rates.
Sequence data
The between-seasons nucleotide distance means were
computed as the arithmetic mean of all pair wise distances
between two seasons in the inter-season comparisons
using the MEGA v.3.1 software [68]. The global rate
between dN and dS substitutions and the individual site-
specific selection pressure were measured by the likeli-
hood based single likelihood ancestor counting (SLAC)
method in Datamonkey (modified Suzuki-Gojobori
method) [70,71]. For datasets over 100 sequences (H3 n
= 204 and N2 n = 166) the HyPhy package [72] was
applied. The estimations are likelihood-based, employing
a codon model cross between HKY85 and MG94. To elu-
cidate single, positively selected amino acids, the HA and
NA datasets were analysed with SLAC and a two rate fixed
effects likelihood (FEL) [73] using a likelihood approach
with neighbor joining phylogenetic trees (HyPhy). Sites
with dN>dS with a <0.05 significance level for likelihood
ratio test (LRT) were implied as positively selected for the
large HA and NA datasets. For the small datasets (genes
coding for the internal proteins <15 and the H1N1 viruses
<30) we additionally ran a random effects likelihood
(REL) analysis using an empirical Bayes approach with NJ
phylogenetic trees in Datamonkey [70]. This method is
expected to calculate positively selected sites more accu-
rately in small datasets. The accepted significance level for
a positively selected site was set at <0.1 (two-tailed
binominal distribution) for SLAC and FEL analyses and
>50 bayes factor for REL.
Prediction of glycosylation sites
Potential N-linked glycosylation sites were predicted
using nine artificial neural networks with the NetNGlyc
1.0 Server [74]. A threshold value of >0.5 average poten-
tial score was set to predict glycosylated sites. The N-Gly-
cosite prediction tool at Los Alamos [75] was used to
visualise the fraction of isolates possessing certain glyco-
sylated sites along the sequence alignment.
Calculation of antigenic distance
The specific measure of antigenic distance between two
strains of influenza were calculated as P
epitope
values by the
method suggested by Muñoz, et al., [39]. The P
epitope
value
was calculated as the number of mutations within an anti-
body antigenic site divided by the number of amino acids
defining the site. It is assumed that an antigenic epitope
which has the greatest percentage of mutations is domi-
nant, because that epitope is influenced by the greatest
selective pressure from the immune system. The P
epitope
distance is defined as the fractional change between the
dominant antigenic epitopes of one strain compared to
another. The P
epitope
Calculator [76,77] was applied for H3
sequences. Residues in antigenic epitopes were collected
from several references [9,13,39,40,48,78-83,83,84].
Virology Journal 2008, 5:40 />Page 17 of 19
(page number not for citation purposes)
Nucleotide sequence accession numbers
Nucleotide sequence accession numbers submitted to
GenBank are; H3: AY531039
–AY531046, AY531048–AY5
31049, AY531051–AY531052, AY531054, AY531056–
AY531057
, EU103820–EU103823, EU103631–EU1038
19, N2: AY531006–AY531013, AY531015–AY531016,
AY531018
–AY531020, AY531023, AY531026–AY5310
28, EU103825–EU103977, H1: EU097933–EU097962,
EU103824
, N1: EU097708–EU097737, PB2: EU097738–
EU097768
, PB1: EU097769–EU097801, PA: EU097802–
EU097833
, NP: EU097834–EU097866, M: EU097867–
EU097899
, NS: EU097900–EU097932].
Competing interests
The author(s) declare that they have no competing inter-
ests.
Authors' contributions
KB conceived and designed the experiments. KB per-
formed the experiments, data analysis and wrote the
paper. LPN and AF contributed reagents and materials.
AFO supervised the research. Further LPN and AF critically
revised the manuscript and AF gave the final approval for
publication. All authors read and approved the final man-
uscript.
Acknowledgements
We thank Bente Østergaard, Christine Valdez and Bente Andersen for
their excellent laboratory work and Sofie E. Midgley for kindly proof read-
ing the manuscript.
References
1. Taubenberger JK, Morens DM: 1918 Influenza: the Mother of All
Pandemics. Emerg Infect Dis 2006, 12:15-22.
2. Lin YP, Gregory V, Bennett M, Hay A: Recent changes among
human influenza viruses. Virus Research 2004, 103:47-52.
3. Paget WJ, Meerhoff TJ, Goddard NL: Mild to moderate influenza
activity in Europe and the detection of novel A(H1N2) and B
viruses during the winter of 2001-02. Euro Surveill 2002,
7:147-157.
4. Ellis JS, Alvarez-Aguero A, Gregory V, Lin YP, Hay A, Zambon MC:
Influenza AH1N2 viruses, United Kingdom, 2001-02 influ-
enza season. Emerg Infect Dis 2003, 9:304-310.
5. Chi SX, Bolar TV, Zhao P, Tam JS, Rappaport R, Cheng S: Molecular
Evolution of Human Influenza A/H3N2 Virus in Asia adn
Europe from 2001 to 2003. Journal of Clinical Microbiology 2005,
43:6130-6132.
6. Barr IG, Komadina N, Hurt A, Iannello C, Tomasov R, Shaw R, Dur-
rant C, Sjogren H, Hampson AW: An Influenza A (H3) Reassor-
tant Was Epidemic in Australia and New Zealand in 2003. J
Med Virol 2005, 76:391-397.
7. Ghedin E, Sengamalay NA, Shumway M, Zaborsky J, Feldblyum T,
Subbu V, Spiro DJ, Sitz J, Koo H, Bolotov P, Dernovoy D, Tatusova T,
Bao Y, St George K, Taylor J, Lipman DJ, Fraser CM, Taubenberger
JK, Salzberg SL: Large-scale sequencing of human influenza
reveals the dynamic nature of viral genome evolution. Nature
2005, 437:1162-1166.
8. Influenza Genome Sequencing Project 2008 [http://
www.ncbi.nlm.nih.gov/genomes/FLU/Database/shipment.cgi].
9. Macken C, Lu H, Goodman J, Boykin L: The value of a database in
surveillance and vaccine selection. In Options for the Control of
Influenza IV Edited by: Osterhaus A, Cox N and Hampson AW.
Amsterdam: Elsevier Science; 2001:103-106.
10. Hardy CT, Young SA, Webster RG, Naeve CW, Owens RJ: Egg flu-
ids and cells of the chorioallantoic membrane of embryo-
nated chicken eggs can select different variants of influenza
A (H3N2) viruses. Virology 1995, 211:302-306.
11. Suzuki Y: Natural Selection on the Influenza Virus Genome.
Mol Biol Evol 2006, 23:1902-1911.
12. Gianfrani C, Oseroff C, Sidney J, Chesnut RW, Sette A: Human
memory CTL response specific for influenza A virus is broad
and multispecific. Hum Immunol 2000, 61:438-452.
13. Fanning TG, Reid AH, Taubenberger JK: Influenza A Virus Neu-
raminidase: Regions of the Protein Potentially Involved in
Virus-Host Interactions. Virology 2000, 276:417-423.
14. Wang M, Lamberth K, Harndahl M, Roder G, Stryhn A, Larsen MV,
Nielsen M, Lundegaard C, Tang ST, Dziegiel MH, Rosenkvist J, Peder-
sen AE, Buus S, Claesson MH, Lund O: CTL epitopes for influenza
A including the H5N1 bird flu; genome-, pathogen-, and
HLA-wide screening. Vaccine 2007, 25:2823-2831.
15. DiBrino M, Tsuchida T, Turner RV, Parker KC, Coligan JE, Biddison
WE: HLA-A1 and HLA-A3 T cell epitopes derived from influ-
enza virus proteins predicted from peptide binding motifs. J
Immunol 1993, 151:5930-5935.
16. Guo HC, Jardetzky TS, Garrett TP, Lane WS, Strominger JL, Wiley
DC: Different length peptides bind to HLA-Aw68 similarly at
their ends but bulge out in the middle. Nature 1992,
360:364-366.
17. Berkhoff EG, Geelhoed-Mieras MM, Fouchier RA, Osterhaus AD,
Rimmelzwaan GF: Assessment of the extent of variation in
influenza A virus cytotoxic T-lymphocyte epitopes by using
virus-specific CD8+ T-cell clones. J Gen Virol 2007, 88:530-535.
18. DiBrino M, Parker KC, Margulies DH, Shiloach J, Turner RV, Biddison
WE, Coligan JE: The HLA-B14 peptide binding site can accom-
modate peptides with different combinations of anchor res-
idues. J Biol Chem 1994, 269:32426-32434.
19. Vartdal F, Johansen BH, Friede T, Thorpe CJ, Stevanovic S, Eriksen JE,
Sletten K, Thorsby E, Rammensee HG, Sollid LM: The peptide bind-
ing motif of the disease associated HLA-DQ (alpha 1* 0501,
beta 1* 0201) molecule. Eur J Immunol 1996, 26:2764-2772.
20. Rohrlich PS, Cardinaud S, Firat H, Lamari M, Briand P, Escriou N,
Lemonnier FA: HLA-B*0702 transgenic, H-2KbDb double-
knockout mice: phenotypical and functional characteriza-
tion in response to influenza virus. Int Immunol 2003,
15:765-772.
21. Bright RA, Medina MJ, Xu X, Perez-Oronoz G, Wallis TR, Davis XM,
Povinelli L, Cox NJ, Klimov AI: Incidence of adamantane resist-
ance among influenza A (H3N2) viruses isolated worldwide
from 1994 to 2005: a cause for concern. Lancet 2005,
366:1175-1181.
22. Hay AJ, Zambon MC, Wolstenholme AJ, Skehel JJ, Smith MH: Molec-
ular basis of resistance of influenza A viruses to amantadine.
J Antimicrob Chemother 1986, 18 Suppl B:19-29.
23. Jameson J, Cruz J, Terajima M, Ennis FA: Human CD8+ and CD4+
T lymphocyte memory to influenza A viruses of swine and
avian species. J Immunol 1999, 162:7578-7583.
24. DiBrino M, Parker KC, Margulies DH, Shiloach J, Turner RV, Biddison
WE, Coligan JE: Identification of the peptide binding motif for
HLA-B44, one of the most common HLA-B alleles in the
Caucasian population. Biochemistry 1995, 34:10130-10138.
25. Gregory V, Bennett M, Orkhan MH, Al Hajjar S, Varsano N, Mendel-
son E, Zambon M, Ellis J, Hay A, Lin YP: Emergence of Influenza
A H1N2 Reassortant Viruses in the Human Population dur-
ing 2001. Virology 2002, 300:1-7.
26. Xu X, Smith CB, Mungall BA, Lindstrom SE, Hall HE, Subbarao K, Cox
NJ, Klimov A: Intercontinental circulation of human influenza
A(H1N2) reassortant viruses during the 2001-2002 influenza
season. J Infect Dis 2002, 186:1490-1493.
27. Lindstrom SE, Hiromoto Y, Nerome R, Omoe K, Sugita S, Yamazaki
Y, Takahashi T, Nerome K: Phylogenetic analysis of the entire
genome of influenza A (H3N2) viruses from Japan: evidence
for genetic reassortment of the six internal genes. J Virol 1998,
72:8021-8031.
28. Holmes EC, Ghedin E, Miller N, Taylor J, Bao Y, St George K, Grenfell
B T, Salzberg SL, Fraser CM, Lipman DJ, Taubenberger JK: Whole-
genome analysis of human influenza A virus reveales multi-
ple persistent lineages and reassortment among recent
H3N2 viruses. In PLoS Biology Volume 3. Plos Biol; 2005:1579-1589.
29. Centers for Disease Control and Prevention (CDC): Preliminary
assessment of the effectiveness of the 2003-04 inactivated
Virology Journal 2008, 5:40 />Page 18 of 19
(page number not for citation purposes)
influenza vaccine Colorado, December 2003. MMWR Morb
Mortal Wkly Rep 2004, 53:8-11.
30. Gulati U, Wu W, Gulati S, Kumari K, Waner JL, Air GM: Mis-
matched hemagglutinin and neuraminidase specificities in
recent human H3N2 influenza viruses. Virology 2005,
339:12-20.
31. Daum LT, Canas LC, Smith CB, Klimov A, Huff W, Barnes W, Lohman
KL: Genetic and antigenic analysis of the first A/New Caledo-
nia/20/99-like H1N1 influenza isolates reported in the Amer-
icas. Emerg Infect Dis 2002, 8:408-412.
32. Organization WH: Recommended composition of influenza
virus vaccines for use in the 2000-2001 season. Wkly Epidemiol
Rec 2000:61-68.
33. Wiley DC, Wilson IA, Skehel JJ: Structural identification of the
antibody-binding sites of Hong Kong influenza haemaggluti-
nin and their involvement in antigenic variation. Nature 1981,
289:373-378.
34. Wang ML, Skehel JJ, Wiley DC: Comparative Analyses of the
Specificities of Anti-Influenza Hemagglutinin Antibodies in
Human Sera. J Virol 1985, 57:124-128.
35. Lambkin R, McLain L, Jones SE, Aldridge SL, Dimmock NJ: Neutrali-
zation escape mutants of type A influenza virus are readily
selected by antisera from mice immunized with whole virus:
a possible mechanism for antigenic drift. J Gen Virol 1994,
75:3493-3502.
36. Yohannes K, Roche P, Hampson A, Miller M, Spencer J: Annual
report of the National Influenza Surveillance Scheme, 2003.
Commun Dis Intell 2004, 28:160-168.
37. Jin H, Zhou H, Liu H, Chan W, Adhikary L, Mahmood K, Lee MS,
Kemble G: Two residues in the hemagglutinin of A/Fujian/411/
02-like influenza viruses are responsible for antigenic drift
from A/Panama/2007/99. Virology 2005, 336:113-119.
38. Smith DJ, Lapedes AS, de Jong JC, Bestebroer TM, Rimmelzwaan GF,
Osterhaus AD, Fouchier RA: Mapping the Antigenic and
Genetic Evolution of Influenza Virus. Science 2004,
305:371-376.
39. Munoz ET, Deem MW: Epitope analysis for influenza vaccine
design. Vaccine 2005, 23:1144-1148.
40. Wilson IA, Cox NJ: Structural Basis of Immune Recognition of
Influenza Virus Hemagglutinin. Annual Review of Immunology
1990, 8:737-787.
41. Gulati U, Hwang CC, Venkatramani L, Gulati S, Stray SJ, Lee JT, Laver
WG, Bochkarev A, Zlotnick A, Air GM: Antibody epitopes on the
neuraminidase of a recent H3N2 influenza virus (A/Mem-
phis/31/98). J Virol 2002, 76:12274-12280.
42. Tisdale M: Monitoring of viral susceptibility: new challenges
with the development of influenza NA inhibitors. Rev Med
Virol 2000, 10:45-55.
43. Kiso M, Mitamura K, Sakai-Tagawa Y, Shiraishi K, Kawakami C,
Kimura K, Hayden FG, Sugaya N, Kawaoka Y: Resistant influenza
A viruses in children treated with oseltamivir: descriptive
study. The Lancet 2004, 364:759-765.
44. Ilyushina NA, Govorkova EA, Webster RG: Detection of amanta-
dine-resistant variants among avian influenza viruses iso-
lated in North America and Asia. Virology 2005, 341:102-106.
45. Suzuki H, Saito R, Masuda H, Oshitani H, Sato M, Sato I: Emergence
of amantadine-resistant influenza A viruses: epidemiological
study. J Infect Chemother 2003, 9:195-200.
46. Gubareva LV, Kaiser L, Hayden FG: Influenza virus neuramini-
dase inhibitors. Lancet 2000, 355:827-835.
47. Ives JA, Carr JA, Mendel DB, Tai CY, Lambkin R, Kelly L, Oxford JS,
Hayden FG, Roberts NA: The H274Y mutation in the influenza
A/H1N1 neuraminidase active site following oseltamivir
phosphate treatment leave virus severely compromised
both in vitro and in vivo. Antiviral Res 2002, 55:307-317.
48. Bui HH, Peters B, Assarsson E, Mbawuike I, Sette A: Ab and T cell
epitopes of influenza A virus, knowledge and opportunities.
Proc Natl Acad Sci U S A 2007, 104:246-251.
49. Townsend AR, Skehel JJ: The influenza A virus nucleoprotein
gene controls the induction of both subtype specific and
cross-reactive cytotoxic T cells. J Exp Med 1984, 160:552-563.
50. Winter G, Fields S: The structure of the gene encoding the
nucleoprotein of human influenza virus A/PR/8/34. Virology
1981, 114:423-428.
51. Abed Y, Goyette N, Boivin G: Generation and characterization
of recombinant influenza A (H1N1) viruses harboring aman-
tadine resistance mutations. Antimicrob Agents Chemother 2005,
49:556-559.
52. Bright RA, Shay DK, Shu B, Cox NJ, Klimov A: Adamantane Reas-
istance Among Influenza A Viruses Isolated Early During the
2005-2006 Influenza Season in the United States. JAMA 2006,
295:891-894.
53. Barr IG, Hurt AC, Iannello P, Tomasov C, Deed N, Komadina N:
Increased adamantane resistance in influenza A(H3) viruses
in Australia and neighbouring countries in 2005. Antiviral Res
2007, 73:112-117.
54. Medeiros R, Escriou N, Naffakh N, Manuguerra JC, van der Werf S:
Hemagglutinin Residues of Recent Human A(H3N2) Influ-
enza Viruses That Contribute to the Inability to Agglutinate
Chicken Erythrocytes. Virology 2001, 289:74-85.
55. Mochalova L, Gambaryan A, Romanova J, Tuzikov A, Chinarev A, Kat-
inger D, Katinger H, Egorov A, Bovin N: Receptor-binding prop-
erties of modern human influenza viruses primarily isolated
in Vero and MDCK cells and chicken embryonated eggs.
Virology 2003, 313:473-480.
56. Lu B, Zhou H, Ye D, Kemble G, Jin H: Improvement of Influenza
A/Fujian/411/02 (H3N2) Virus Growth in Embryonated
Chicken Eggs by Balancing the Hemagglutinin and Neurami-
nidase Activities, Using Reverse Genetics. J Virol 2005,
79:6763-6771.
57. Lu B, Zhou H, Chan W, Kemble G, Jin H: Single amino acid sub-
stitutions in the hemagglutinin of influenza A/Singapore/21/
04 (H3N2) increase virus growth in embryonated chicken
eggs. Vaccine 2006, 24:6691-6693.
58. Abe Y, Takashita E, Sugawara K, Matsuzaki Y, Muraki Y, Hongo S:
Effect of the addition of oligosaccharides on the biological
activities and antigenicity of influenza A/H3N2 virus hemag-
glutinin. J Virol 2004, 78:9605-9611.
59. Knossow M, Skehel JJ: Variation and infectivity neutralization in
influenza. Immunology 2006, 119:1-7.
60. Xu X, Cox NJ, Bender CA, Regnery HL, Shaw MW: Genetic varia-
tion in neuraminidase genes of influenza A (H3N2) viruses.
Virology 1996, 224:175-183.
61. Wolf YI, Viboud C, Holmes EC, Koonin EV, Lipman DJ: Long inter-
vals of stasis punctuated by bursts of positive selection in the
seasonal evolution of influenza A virus. Biol Direct 2006, 1:34.
62. Nelson MI, Simonsen L, Viboud C, Miller MA, Taylor J, George KS,
Griesemer SB, Ghedi E, Sengamalay NA, Spiro DJ, Volkov I, Grenfell
BT, Lipman DJ, Taubenberger JK, Holmes EC: Stochastic Proc-
esses Are Key Determinants of Short-Term Evolution in
Influenza A Virus. PLoS Pathog 2006, 2:e125.
63. Bush RM, Fitch WM, Bender CA, Cox NJ: Positive selection on
the H3 hemagglutinin gene of human influenza virus A. Mol
Biol Evol 1999, 16:1457-1465.
64. Bragstad K, Jorgensen PH, Handberg KJ, Fomsgaard A: Genome
characterisation of the newly discovered avian influenza A
H5N7 virus subtype combination. Arch Virol 2006.
65. Hoffmann E, Stech J, Guan Y, Webster RG, Perez DR: Universal
primer set for the full-length amplification of all influenza A
viruses. Arch Virol 2001, 146:2275-2289.
66. Bragstad K, Jorgensen PH, Handberg KJ, Mellergaard S, Corbet S,
Fomsgaard A: New avian influenza A virus subtype combina-
tion H5N7 identified in Danish mallard ducks. Virus Res 2005,
109:181-190.
67. Hall TA: BioEdit: a user-friendly biological sequence align-
ment editor and analysis program for Windows 95/98/NT.
Nucl Acids Symp Ser 1999, 41:95-98 [ />BioEdit/bioedit.html].
68. Kumar S, Tamura K, Nei M: Integrated Software for Molecular
Evolutionary Genetics Analysis and Sequence Alignment.
Briefings in Bioinformatics 2004, 5:150-163 [asoft
ware.net].
69. Swafford DL: Phylogenetic Analysis Using Parsimony, PAUP.
Sinauer Associates, Inc. Publishers; 2003.
70. Pond SL, Frost SD: Datamonkey: rapid detection of selective
pressure on individual sites of codon alignments. Bioinformatics
2005, 21:2531-2533.
71. Suzuki Y, Gojobori T: A method for detecting positive selection
at single amino acid sites. Mol Biol Evol 1999, 16:1315-1328.
72. Pond SL, Frost SD, Muse SV: HyPhy: hypothesis testing using
phylogenies. Bioinformatics 2005, 21:676-679.
Publish with BioMed Central and every
scientist can read your work free of charge
"BioMed Central will be the most significant development for
disseminating the results of biomedical research in our lifetime."
Sir Paul Nurse, Cancer Research UK
Your research papers will be:
available free of charge to the entire biomedical community
peer reviewed and published immediately upon acceptance
cited in PubMed and archived on PubMed Central
yours — you keep the copyright
Submit your manuscript here:
/>BioMedcentral
Virology Journal 2008, 5:40 />Page 19 of 19
(page number not for citation purposes)
73. Kosakovsky Pond SL, Frost SDW: Not So Different After All: A
Comparison of Methods for Detecting Amino Acid Sites
Under Selection. Mol Biol Evol 2005, 22:1208-1222.
74. Gupta R, Jung E, Brunak S: Prediction of N-glycosylation sites in
human proteins. 2004 [ />].
75. Zhang M, Gaschen B, Blay W, Foley B, Haigwood N, Kuiken C, Kor-
ber B: Tracking global patterns of N-linked glycosylation site
variation in highly variable viral glycoproteins: HIV, SIV, and
HCV envelopes and influenza hemagglutinin. Glycobiology
2004, 14:1229-1246.
76. Gupta V, Earl DJ, Deem MW: Quantifying influenza vaccine effi-
cacy and antigenic distance. Vaccine 2006, 24:3881-3888.
77. Calculation of Pepitope using Microsoft Excel 2008 [http://
www.mwdeem.rice.edu/pepitope/].
78. Air GM, Els MC, Brown LE, Laver WG, Webster RG: Location of
antigenic sites on the three-dimensional structure of the
influenza N2 virus neuraminidase. Virology 1985, 145:237-248.
79. Caton AJ, Brownlee GG, Yewdell JW, Gerhard W: The antigenic
structure of the influenza virus A/PR/8/34 hemagglutinin (H1
subtype). Cell 1982, 31:417-427.
80. Colman PM, Varghese JN, Laver WG: Structure of the catalytic
and antigenic sites in influenza virus neuraminidase. Nature
1983, 303:41-44.
81. Fanning TG, Taubenberger JK: Phylogenetically important
regions of the Influenza A H1 hemagglutinin protein. Virus
Research 1999, 65:33-42.
82. Wiley DC, Skehel JJ: The structure and function of the hemag-
glutinin membrane glycoprotein of influenza virus. Annu Rev
Biochem 1987, 56:365-394.
83. Colman PM: Influenza virus neuraminidase: Structure, anti-
bodies, and inhibitors. Protein Sci 1994, 3:1687-1696.
84. Air GM, Laver WG: The neuraminidase of influenza virus. Pro-
teins 1989, 6:341-356.