REPORT NO. 2011-108 FEBRUARY 2011 SEMINOLE STATE COLLEGE OF FLORIDA Financial Audit For the Fiscal Year Ended June 30, 2010_part1 pdf
Bạn đang xem bản rút gọn của tài liệu. Xem và tải ngay bản đầy đủ của tài liệu tại đây (268.51 KB, 7 trang )
REPORT NO. 2011-108
F
EBRUARY 2011
SEMINOLE STATE COLLEGE OF
FLORIDA
Financial Audit
For the Fiscal Year Ended
June 30, 2010
This is trial version
www.adultpdf.com
BOARD OF TRUSTEES AND PRESIDENT
Members of the Board of Trustees and President who served during the 2009-10 fiscal year are listed below:
Lisa M. Greer, Vice Chair to 7-19-09, Chair from 7-20-09 (1)
Scott D. Howat, Vice Chair from 7-20-09
Christopher E. Dorworth, Chair to 7-19-09 (2)
Cynthia L. Drago from 7-31-09
Charles W Gregg, Sr.
Deanne F. Schaffner to 7-30-09 (3)
Notes: (1)
(2)
(3)
Dr. E. Ann McGee, President
May 31, 2010.
Board member served beyond end of term,
Board member served beyond end of term,
May 31, 2009.
Board member resigned May 1, 2010.
T
he Auditor General conducts audits of governmental entities to provide the Legislature, Florida’s citizens, public entity
management, and other stakeholders unbiased, timely, and relevant information for use in promoting government
accountability and stewardship and improving government operations.
The audit team leader was Patrick M. Dougherty, CPA, and the audit was supervised by Keith A. Wolfe, CPA, Please address
inquiries regarding this report to James R. Stultz, CPA, Audit Manager, by e-mail at
or by telephone
at (850) 922-2263.
This report and other reports prepared by the Auditor General can be obtained on our Web site at
www.myflorida.com/audgen
; by telephone at (850) 487-9175; or by mail at G74 Claude Pepper Building, 111 West Madison
Street
,
Tallahassee
,
Florida 32399-1450.
This is trial version
www.adultpdf.com
FEBRUARY 2011 REPORT NO. 2011-108
SEMINOLE STATE COLLEGE OF FLORIDA
TABLE OF CONTENTS
PAGE
NO.
EXECUTIVE SUMMARY i
INDEPENDENT AUDITOR’S REPORT ON FINANCIAL STATEMENTS 1
MANAGEMENT’S DISCUSSION AND ANALYSIS 3
BASIC FINANCIAL STATEMENTS
Statement of Net Assets 12
Statement of Revenues, Expenses, and Changes in Net Assets 14
Statement of Cash Flows 15
Notes to Financial Statements 17
OTHER REQUIRED SUPPLEMENTARY INFORMATION
Schedule of Funding Progress – Other Postemployment Benefits Plan 38
Notes to Required Supplementary Information 39
INDEPENDENT AUDITOR’S REPORT ON INTERNAL CONTROL OVER
FINANCIAL REPORTING AND ON COMPLIANCE AND OTHER MATTERS
BASED ON AN AUDIT OF THE FINANCIAL STATEMENTS PERFORMED
IN ACCORDANCE WITH
GOVERNMENT AUDITING STANDARDS
40
Internal Control Over Financial Reporting 40
Compliance and Other Matters 41
This is trial version
www.adultpdf.com
FEBRUARY 2011 REPORT NO. 2011-108
2
INDEPENDENT AUDITOR’S REPORT ON INTERNAL CONTROL OVER FINANCIAL
REPORTING AND ON COMPLIANCE AND OTHER MATTERS BASED ON AN AUDIT OF THE
FINANCIAL STATEMENTS PERFORMED IN ACCORDANCE WITH
GOVERNMENT AUDITING
STANDARDS
. The purpose of that report is to describe the scope of our testing of internal control over financial
reporting and compliance and results of that testing, and not to provide an opinion on the internal control over
financial reporting or on compliance. That report is an integral part of an audit performed in accordance with
Government Auditing Standards and should be considered in assessing the results of our audit.
Accounting principles generally accepted in the United States of America require that MANAGEMENT’S
DISCUSSION AND ANALYSIS on pages 3 through 11 and OTHER REQUIRED SUPPLEMENTARY
INFORMATION on pages 38 and 39 be presented to supplement the basic financial statements. Such information,
although not a required part of the basis financial statements, is required by the Governmental Accounting Standards
Board who considers it to be an essential part of financial reporting for placing the basic financial statements in an
appropriate, operational, economic, or historical content. We have applied certain limited procedures to the required
supplementary information in accordance with auditing standards generally accepted in the United States of America,
which consisted of inquiries of management about the methods of preparing the information and comparing the
information for consistency with management’s responses to our inquiries, the basic financial statements, and other
knowledge we obtained during our audit of the basic financial statements. We do not express an opinion or provide
any assurance on the information because the limited procedures do not provide us with sufficient evidence to
express an opinion or provide any assurance.
Respectfully submitted,
David W. Martin, CPA
February 9, 2011
This is trial version
www.adultpdf.com
FEBRUARY 2011 REPORT NO. 2011-108
4
net assets. When the reverse occurs, the result is a decrease in net assets. The relationship between revenues and
expenses may be thought of as Seminole State College of Florida’s operating results.
These two statements report Seminole State College of Florida’s net assets and changes in them. You can think of the
College’s net assets, the difference between assets and liabilities, as one way to measure the College’s financial health,
or financial position. Over time, increases or decreases in the College’s net assets are one indication of whether its
financial health is improving or deteriorating. You will need to consider many other nonfinancial factors, such as
certain trends, student retention, condition of the buildings, and the safety of the campuses, to assess the College’s
overall financial health.
These statements include all assets and liabilities using the accrual basis of accounting, which is similar to the
accounting used by most private-sector institutions. All of the current fiscal year’s revenues and expenses are taken
into account regardless of when cash is received or paid.
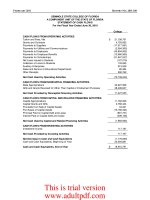
A condensed statement of assets, liabilities, and net assets of the College and its component unit as of June 30, 2010,
and June 30, 2009, is shown in the following table:
Condensed Statement of Net Assets at
(In Thousands)
6-30-10 6-30-09 6-30-09 6-30-10
Assets
Current Assets 24,575$ 29,513$ 4,583$ 4,281$
Capital Assets, Net 171,768 164,771 872 872
Other Noncurrent Assets 6,300 12,862 6,418 6,670
Total Assets
202,643 207,146 11,873 11,823
Liabilities
Current Liabilities 3,742 14,694 152 303
Noncurrent Liabilities 14,579 15,131 702 902
Total Liabilities
18,321 29,825 854 1,205
Net Assets
Invested in Capital Assets,
Net of Related Debt 161,370 153,482 170 11
Restricted 14,750 20,802 10,215 9,894
Unrestricted 8,202 3,037 634 713
Total Net Assets
184,322$ 177,321$ 11,019$ 10,618$
Increase (Decrease) in Net Assets
7,001$ 3.9% 401$ 3.8%
College Component Unit
The decrease in total assets is a result of a decrease in receivables due from State for major construction projects, and
a decrease in restricted cash and cash equivalents used for major construction projects, offset with an increase in
capital assets primarily related to completion of the University Partnership building, the Public Safety building, and
certain parking and roadway projects. Current liabilities decreased as a result of the completion and payment of large
amounts of construction related invoices and retainage payables that existed at the end of the prior fiscal year, related
to the previously mentioned projects. The increase in total net assets is attributable to an increase in the unrestricted
fund balance as a result of net revenue increases from enrollment and tuition growth. The increase in the net assets in
the invested in capital asset category is offset with the decrease in the restricted net assets that resulted from the
completion of the University Partnership building, Public Safety building, and certain parking and roadway projects.
This is trial version
www.adultpdf.com
FEBRUARY 2011 REPORT NO. 2011-108
5
Revenues and expenses of the College and its component unit for the 2009-10 and 2008-09 fiscal years are shown in
the following table:
Condensed Statement of Revenues, Expenses, and Changes in Net Assets
For the Fiscal Years Ended
(In Thousands)
6-30-10 6-30-09 6-30-10 6-30-09
Operating Revenues
Student Tuition and Fees, Net of Scholarship
Allowances 22,279$ 20,157$ $ $
Federal Grants and Contracts 2,419 2,347
State and Local Grants and Contracts 842 983
Nongovernmental Grants and Contracts 1,173 1,480
Sales and Services of Educational Departments 78 107
Auxiliary Enterprises 1,404 1,129
Other Operating Revenues 491 191 1,733 1,797
Total Operating Revenues
28,686 26,394 1,733 1,797
Less, Operating Expenses 105,290 85,243 2,105 3,407
Operating Loss
(76,604) (58,849) (372) (1,610)
Nonoperating Revenues (Expenses)
State Appropriations 32,928 35,670 54 98
Other Nonoperating Revenues 38,687 17,948 719 477
Nonoperating Expenses (529) (558) (1,443)
Net Nono
p
eratin
g
Revenues
(
Ex
p
enses
)
71,086 53,060 773 (868)
Income (Loss) Before Other Revenues,
Expenses, Gains, or Losses
(5,518) (5,789) 401 (2,478)
Capital Appropriations 9,751 16,306
Capital Grants, Contracts, Gifts, and Fees 2,768 9,893
Increase (Decrease) in Net Assets
7,001 20,410 401 (2,478)
Net Assets, Beginning of Year 177,321 156,911 10,618 13,096
Net Assets, End of Year
184,322$ 177,321$ 11,019$ 10,618$
College Component Unit
Operating Revenues
GASB Statement No. 35 categorizes revenues as either operating or nonoperating. Operating revenues generally
result from exchange transactions where each of the parties to the transaction either gives or receives something of
equal or similar value.
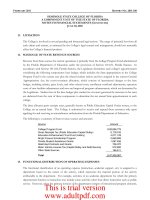
The following chart presents the College’s operating revenues for the 2009-10 and 2008-09 fiscal years:
This is trial version
www.adultpdf.com
FEBRUARY 2011 REPORT NO. 2011-108
6
Operating Revenues: College
(In Thousands)
College operating revenue changes were the result of the following factors:
An 8 percent tuition increase and a new 5 percent technology fee, coupled with a 24 percent increase in fee-
paying enrollment resulted in a $2.1 million, or 10.5 percent, increase in student tuition and fees.
Federal grants and contracts revenues increased slightly by $0.1 million, or 3.1 percent, primarily due to
increases in Department of Labor healthcare grants offset with decreases in grants related to Adult Education
and Information Technology.
State and nongovernmental grants and contract revenues decreased by $0.4 million, or 18.2 percent, due to
the downturn in the State and local economies that impacted the amount of funds available for such grants
and contracts.
Auxiliary enterprises revenues increased by $0.3 million, or 24.4 percent, primarily due to increased revenues
generated from bookstore commissions.
Other revenue increases of $0.3 million, or 157.1 percent, are due to energy rebate checks received from
utility companies.
Operating Expenses
Expenses are categorized as operating or nonoperating. The majority of the College’s expenses are operating
expenses as defined by GASB Statement No. 35. GASB gives financial reporting entities the choice of reporting
operating expenses in the functional or natural classifications. The College has chosen to report the expenses in their
natural classification on the statement of revenues, expenses, and changes in net assets and has displayed the
functional classification in the notes to financial statements.
Operating expenses for the College and its component unit for the 2009-10 and 2008-09 fiscal years are presented in
the following table:
$22,279
$2,419
$842
$1,173
$78
$1,404
$491
$20,157
$2,347
$983
$1,480
$107
$1,129
$191
$0 $15,000 $30,000
Student Tuition and Fees, Net
Federal Grants and Contracts
State and Local Grants and Contracts
Nongovernmental Grants and Contracts
Sales and Services of Educational
Departments
A
uxiliary Enterprises
Other
2008-09
2009-10
This is trial version
www.adultpdf.com