REPORT NO. 2011-108 FEBRUARY 2011 SEMINOLE STATE COLLEGE OF FLORIDA Financial Audit For the Fiscal Year Ended June 30, 2010_part2 pptx
Bạn đang xem bản rút gọn của tài liệu. Xem và tải ngay bản đầy đủ của tài liệu tại đây (140.46 KB, 10 trang )
FEBRUARY 2011 REPORT NO. 2011-108
7
Operating Expenses
(In Thousands)
6-30-10 6-30-09 6-30-10 6-30-09
Operating Expenses
Personnel Services 57,263$ 53,846$ 565$ 709$
Scholarships and Waivers 21,847 11,517 1,140 1,731
Utilities and Communications 2,578 2,494
Contractual Services 2,790 3,247 103 122
Other Services and Expenses 4,943 4,606 255 810
Materials and Supplies 9,222 4,481 42 35
Depreciation 6,647 5,052
Total Operating Expenses
105,290$ 85,243$ 2,105$ 3,407$
College Component Unit
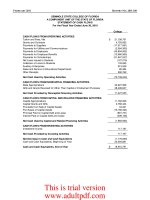
The following chart presents the College’s operating expenses for the 2009-10 and 2008-09 fiscal years:
Operating Expenses: College
(In Thousands)
College operating expense changes were the result of the following factors:
Personnel expenses increased $3.4 million, or 6.3 percent, due to compensation adjustments and increased
staffing levels necessitated by enrollment growth.
Scholarship expenses increased $10.3 million, or 89.7 percent, primarily due to increases in Federal Pell Grant
awards due to increased enrollment and the new year-round Federal Pell Grant regulation, and increases in
Bright Futures, Federal Supplemental Educational Opportunity Grants, and First Generation in College
scholarships. Additionally, the increased enrollment at the College resulted in increased scholarship expenses.
Materials and supplies expenses increased $4.7 million, or 105.8 percent, over the prior year due to significant
amounts of minor equipment purchases related to furnishing the new University Partnership building and
Public Safety building. Additionally many noncapitalized repairs, renovations, and remodels on the
Sanford/Lake Mary campus occurred during the 2009-10 fiscal year.
$6,647
$9,222
$4,943
$2,790
$2,578
$21,847
$57,263
$5,052
$4,481
$4,606
$3,247
$2,494
$11,517
$53,846
$0 $35,000 $70,000
Depreciation
Materials and Supplies
Other Services and Expenses
Contractual Services
Utilities and Communications
Scholarships and Waivers
Personnel Services
2008-09
2009-10
This is trial version
www.adultpdf.com
FEBRUARY 2011 REPORT NO. 2011-108
8
Nonoperating Revenues and Expenses
Certain revenue sources that the College relies on to provide funding for operations, including State appropriations,
certain gifts and grants, and investment income, are defined by GASB as nonoperating. Nonoperating expenses
include capital financing costs and other costs related to capital assets. The following summarizes the College’s
nonoperating revenues and expenses for the 2009-10 and 2008-09 fiscal years:
Nonoperating Revenues (Expenses): College
(In Thousands)
2009-10 2008-09
State Appropriations 32,928$ 35,670$
Gifts and Grants 38,500 17,640
Investment Income 113 244
Other Nonoperating Revenues 74 64
Interest on Capital Asset-Related Debt (499) (539)
Other Nonoperating Expenses (30) (19)
Net Nonoperating Revenues
71,086$ 53,060$
Nonoperating revenue changes were the result of the following factors:
Although State appropriations decreased by $2.7 million, or 7.7 percent, the College received $2.9 million in
Federal stimulus dollars, which accounts for some of the increase in the gifts and grants category.
The gifts and grants nonoperating revenue increased $20.9 million, or 118.3 percent partly due to the Federal
stimulus dollars appropriated from the State, as well as increased Federal Pell grant revenue.
Other Revenues, Expenses, Gains, or Losses
This category is comprised of capital appropriations and capital grants, contracts, gifts, and fees. The following
summarizes the College’s other revenues, expenses, gains, or losses for the 2009-10 and 2008-09 fiscal years:
Other Revenues, Expenses, Gains, or Losses: College
(In Thousands)
2009-10 2008-09
Capital Appropriations 9,751$ 16,306$
Capital Grants, Contracts, Gifts, and Fees 2,768 9,893
Total
12,519$ 26,199$
Other revenues, expenses, gains, or losses changes were the result of the following factors:
Capital appropriations decreased by $6.6 million, or 40.2 percent, due to decreased Public Education Capital
Outlay funds received from the State for construction projects. The prior year capital appropriations
included major building renovations on the Sanford/Lake Mary campus and the University Partnership
building.
Capital grants and contracts decreased by $7.1 million, or 72 percent, mainly due to the prior year funds,
which were the final contributions, received from the University of Central Florida for the University
Partnership building.
This is trial version
www.adultpdf.com
FEBRUARY 2011 REPORT NO. 2011-108
9
T
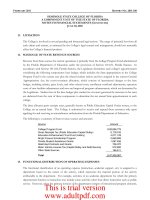
HE STATEMENT OF CASH FLOWS
Another way to assess the financial health of an institution is to look at the statement of cash flows. Its primary
purpose is to provide relevant information about the cash receipts and cash payments of an entity during a period.
The statement of cash flows also helps users assess:
An entity’s ability to generate future net cash flows.
Its ability to meet its obligations as they come due.
Its need for external financing.
A summary of the College’s cash flows for the 2009-10 and 2008-09 fiscal years is presented in the following table:
Condensed Statement of Cash Flows: College
(In Thousands)
2009-10 2008-09
Cash Provided (Used) by:
Operating Activities (70,739)$ (53,426)$
Noncapital Financing Activities 71,428 53,310
Capital and Related Financing Activities (1,984) 1,384
Investing Activities 117 251
Net Increase (Decrease) in Cash and Cash Equivalents
(1,178) 1,519
Cash and Cash Equivalents, Beginning of Year 20,095 18,576
Cash and Cash Equivalents, End of Year
18,917$ 20,095$
Major sources of funds came from State appropriations ($32.9 million), capital appropriations ($11.8 million), net
student tuition and fees ($21.2 million), and noncapital gifts and grants ($38.5 million). Major uses of funds were for
payments to employees ($45.9 million), payments for scholarships ($21.8 million), payments to suppliers ($17 million),
payments for employee benefits ($11 million), and the purchase of capital assets ($15.2 million). Changes in cash and
cash equivalents were the result of the following factors:
Operating Activities used $17.3 million more cash compared to the previous fiscal year. The majority of this
increase was related to an increase of $10.3 million in scholarship disbursements compared to the prior fiscal
year. Additional cash outflow increases are related to supplier and employee payments.
Noncapital financing activities increased the College’s cash position by $18.1 million. This increase is mainly
due to an $18 million increase in cash inflows for Federal Pell grants and State scholarships, and the receipt of
Federal stimulus dollars of $2.9 million, offset by $2.7 million less received this year for State appropriations.
Cash inflows from capital and related financing activities decreased by $3.4 million primarily due to a decrease
in capital appropriations from the State as many of the major construction projects in the prior year were
completed. In the prior year the College had also received $7.9 million from the University of Central Florida
for the University Partnership building.
The cash flows from investing activities are the result of interest income earned on the College’s demand
deposits in the bank and with the State’s Special Purpose Investment Account. The cash inflow from
investing activities decreased $0.1 million compared to the prior fiscal year as a result of decreased interest
rates.
This is trial version
www.adultpdf.com
FEBRUARY 2011 REPORT NO. 2011-108
10
CAPITAL ASSETS AND DEBT ADMINISTRATION
C
APITAL ASSETS
At June 30, 2010, the College had $223.4 million in capital assets, less accumulated depreciation of $51.7 million, for
net capital assets of $171.8 million. Depreciation charges for the current fiscal year totaled $6.6 million. The
following table summarizes the College’s capital assets at June 30, 2010, and June 30, 2009:
Capital Assets, Net at June 30: College
(In Thousands)
Capital Assets 2010 2009
Land 21,269$ 21,228$
Buildings 168,608 125,265
Other Structures and Improvements 11,842 5,518
Furniture, Machinery, and Equipment 10,591 8,912
Assets Under Capital Lease 1,585 1,610
Leasehold Improvements 3,097 3,097
Other Capital Assets 3,778 4,117
Construction in Progress 2,678 42,550
Total
223,448 212,297
Less, Accumulated Depreciation:
Buildings 31,575 29,472
Other Structures and Improvements 6,151 5,478
Furniture, Machinery, and Equipment 8,538 7,652
Assets Under Capital Lease 1,165 1,046
Leasehold Improvements 1,094 808
Other Capital Assets 3,157 3,070
Total Accumulated Depreciation
51,680 47,526
Capital Assets, Net
171,768$ 164,771$
The College has $1 million in major construction commitments at June 30, 2010. The construction commitments are
for projects that include renovations of Buildings L and F, a Student Services building, and signage projects. State
appropriations, capital improvement revenue bonds, and local funds are expected to finance these capital projects.
More information about the College’s capital assets is presented in the notes to financial statements.
D
EBT ADMINISTRATION
At fiscal year-end, the College had $10.4 million in long-term debt outstanding. The following table summarizes
outstanding long-term debt by type for the fiscal years ended June 30, 2010, and June 30, 2009:
Long-Term Debt, at June 30: College
(In Thousands)
2010 2009
Bonds Payable 6,990$ 7,400$
Loan Payable 2,989 3,193
Capital Lease Payable 418 697
Total
10,397$ 11,290$
The State Board of Education issues capital outlay and capital improvement revenue bonds on behalf of the College.
During the 2009-10 fiscal year, there were no bond sales and debt repayments totaled $892,000. Additional
information about the College’s long-term debt is presented in the notes to financial statements.
This is trial version
www.adultpdf.com
FEBRUARY 2011 REPORT NO. 2011-108
11
ECONOMIC FACTORS THAT WILL AFFECT THE FUTURE
Seminole State College of Florida’s economic condition is closely tied to that of the State of Florida because
approximately 50.9 percent of the College’s operating funds were received through appropriations and Federal
Stimulus allocations through the State. Initial allocations for the 2010-11 fiscal year are approximately 7.7 percent
greater than 2009-10 fiscal year allocations. However, the 2010-11 allocations include $2.9 million of nonrecurring
Federal stabilization funds. These nonrecurring appropriations represent approximately 3.8 percent of the current
year operating resources. Therefore, the College established a designated reserve in excess of the statutory level
sufficient to maintain operations during the upcoming and future fiscal years.
High levels of unemployment in the State are correlated to increased enrollments in State colleges. Summer and Fall
Term enrollment at Seminole State College of Florida continued to exceed the budgeted 11.4 percent increase as State
unemployment rates remained high. The College anticipates a continued increase in enrollment throughout the year.
In addition, the College began offering courses leading to a Bachelor Degree in Applied Science for Interior Design
accredited by the Southern Association of Colleges and Schools, with plans to offer four more baccalaureate degrees
next year. Resources from this enrollment increase are augmented by an 8 percent increase in tuition rates which
began in the Fall 2010 term. Therefore, the projected increases in enrollment and tuition rates provide additional
resources for the College to maintain and grow programs throughout next year.
A newly-renovated and expanded Center for Public Safety was completed on the Sanford/Lake Mary campus this
past year. This facility provides additional instructional capacity to serve students throughout 2010-11. The College
also completed construction of a joint-use facility on the Sanford/Lake Mary campus in cooperation with the
University of Central Florida (UCF). This new 108,000 square foot facility provides expanded library, classroom and
student service capacity to serve the growing need of the College and UCF as additional baccalaureate programs are
offered at the Sanford/Lake Mary campus. The College also received funding through the Public Educational Capital
Outlay program to fund the renovation of 30,000 square feet of classroom space and begin planning for a new
Student Center on the Sanford/Lake Mary campus. The College also received funds to acquire over 25 acres of land
and 80,000 square feet of building adjacent to the existing Altamonte Springs campus.
REQUESTS FOR INFORMATION
Questions concerning information provided in the MD&A or other required supplementary information and financial
statements and notes thereto, or requests for additional financial information, should be addressed to the Vice
President of Administrative Services, Seminole State College of Florida, 100 Weldon Boulevard, Sanford, Florida
32773.
This is trial version
www.adultpdf.com
FEBRUARY 2011 REPORT NO. 2011-108
12
BASIC FINANCIAL STATEMENTS
College Component
Unit
ASSETS
Current Assets:
Cash and Cash Equivalents 10,834,378$ 3,341,014$
Restricted Cash and Cash Equivalents 1,914,444
Restricted Investments 1,068,431
Accounts Receivable, Net 3,186,282 169,732
Notes Receivable, Net 44,497
Due from Other Governmental Agencies 7,798,619
Due from Component Unit 60,160
Prepaid Expenses 736,210
Other Assets 3,886
Total Current Assets
24,574,590 4,583,063
Noncurrent Assets:
Restricted Cash and Cash Equivalents 6,167,969
Endowment Investments 6,248,360
Restricted Investments 132,453
Depreciable Capital Assets, Net 147,821,624
Nondepreciable Capital Assets 23,946,384 872,171
Other Noncurrent Assets 169,161
Total Noncurrent Assets
178,068,430 7,289,692
TOTAL ASSETS
202,643,020$ 11,872,755$
LIABILITIES
Current Liabilities:
Accounts Payable 972,929$ 45,721$
Salary and Payroll Taxes Payable 1,138,813
Retainage Payable 267,861
Due to Other Governmental Agencies 3,929
Due to College 60,160
Deferred Revenue 67,382
Deposits Held for Others 382,380 45,568
Long-Term Liabilities - Current Portion:
Bonds Payable 440,000
Loans Payable 212,426
Capital Lease Payable 133,144
Compensated Absences Payable 122,617
Total Current Liabilities
3,741,481 151,449
Noncurrent Liabilities:
Bonds Payable 6,550,000
Loans Payable 2,776,992
Notes Payable 702,104
Capital Lease Payable 285,253
Compensated Absences Payable 4,912,448
Other Postemployment Benefits Payable 54,351
Total Noncurrent Liabilities
14,579,044 702,104
TOTAL LIABILITIES
18,320,525 853,553
SEM
INOLE STATE COLLEGE OF FLORIDA
A COMPONENT UNIT OF THE STATE OF FLORIDA
STATEMENT OF NET ASSETS
June 30, 2010
This is trial version
www.adultpdf.com
FEBRUARY 2011 REPORT NO. 2011-108
13
College Component
Unit
NET ASSETS
Invested in Capital Assets, Net of Related Debt 161,370,193$ 170,067$
Restricted:
Nonexpendable:
Endowment 4,710,231
Expendable:
Grants and Loans 2,210,420
Scholarships 409,684 5,504,993
Capital Projects 12,058,032
Debt Service 72,644
Unrestricted 8,201,522 633,911
Total Net Assets
184,322,495 11,019,202
TOTAL LIABILITIES AND NET ASSETS
202,643,020$ 11,872,755$
SEMINOLE STATE COLLEGE OF FLORIDA
A COMPONENT UNIT OF THE STATE OF FLORIDA
STATEMENT OF NET ASSETS (Continued)
June 30, 2010
The accompanying notes to financial statements are an integral part of this statement.
This is trial version
www.adultpdf.com
FEBRUARY 2011 REPORT NO. 2011-108
14
College Component
Unit
REVENUES
Operating Revenues:
Student Tuition and Fees, Net of Scholarship
Allowances of $15,210,537 22,279,054$ $
Federal Grants and Contracts 2,418,829
State and Local Grants and Contracts 841,746
Nongovernmental Grants and Contracts 1,173,567
Sales and Services of Educational Departments 78,178
Auxiliary Enterprises 1,403,808
Other Operating Revenues 491,216 1,732,949
Total Operating Revenues
28,686,398 1,732,949
EXPENSES
Operating Expenses:
Personnel Services 57,262,798 565,053
Scholarships and Waivers 21,847,246 1,140,392
Utilities and Communications 2,577,779
Contractual Services 2,789,905 102,913
Other Services and Expenses 4,943,486 254,530
Materials and Supplies 9,221,527 41,784
Depreciation 6,647,279
Total Operating Expenses
105,290,020 2,104,672
Operating Loss
(76,603,622) (371,723)
NONOPERATING REVENUES (EXPENSES)
State Appropriations 32,927,908 53,820
Gifts and Grants 38,499,637 51,153
Investment Income 113,339 292,781
Net Realized and Unrealized Gain on Investments 374,972
Other Nonoperating Revenues 74,641
Interest on Capital Asset-Related Debt (499,138)
Other Nonoperating Expenses (30,320)
Net Nonoperating Revenues
71,086,067 772,726
Income (Loss) Before Other Revenues,
Expenses, Gains, or Losses
(5,517,555) 401,003
Capital Appropriations 9,750,816
Capital Grants, Contracts, Gifts, and Fees 2,768,444
Total Other Revenues
12,519,260
Increase in Net Assets
7,001,705 401,003
Net Assets, Beginning of Year 177,320,790 10,618,199
Net Assets, End of Year
184,322,495$ 11,019,202$
The accompanying notes to financial statements are an integral part of this statement.
SEMINOLE STATE COLLEGE OF FLORIDA
A COMPONENT UNIT OF THE STATE OF FLORIDA
STATEMENT OF REVENUES, EXPENSES, AND CHANGES IN NET ASSETS
F
or the Fiscal Year Ended June 30, 2010
This is trial version
www.adultpdf.com
FEBRUARY 2011 REPORT NO. 2011-108
15
College
CASH FLOWS FROM OPERATING ACTIVITIES
Tuition and Fees, Net 21,199,791$
Grants and Contracts 4,793,082
Payments to Suppliers (17,017,581)
Payments for Utilities and Communications (2,584,365)
Payments to Employees (45,894,952)
Payments for Employee Benefits (10,980,965)
Payments for Scholarships (21,847,247)
Net Loans Issued to Students (127,275)
Collection of Loans to Students 133,590
Auxiliary Enterprises 913,536
Sales and Service of Educational Departments 80,384
Other Receipts 592,762
Net Cash Used by Operating Activities
(70,739,240)
CASH FLOWS FROM NONCAPITAL FINANCING ACTIVITIES
State Appropriations 32,927,908
Gifts and Grants Received for Other Than Capital or Endowment Purposes 38,499,637
Net Cash Provided by Noncapital Financing Activities
71,427,545
CASH FLOWS FROM CAPITAL AND RELATED FINANCING ACTIVITIES
Capital Appropriations 11,762,936
Capital Grants and Gifts 2,768,444
Proceeds from Sale of Capital Assets 44,321
Purchases of Capital Assets (15,168,424)
Principal Paid on Capital Debt and Lease (891,731)
Interest Paid on Capital Debt and Lease (499,138)
Net Cash Used by Capital and Related Financing Activities
(1,983,592)
CASH FLOWS FROM INVESTING ACTIVITIES
Investment Income 117,197
Net Cash Provided by Investing Activities
117,197
Net Decrease in Cash and Cash Equivalents
(1,178,090)
Cash and Cash Equivalents, Beginning of Year 20,094,881
Cash and Cash Equivalents, End of Year
18,916,791$
SEMINOLE STATE COLLEGE OF FLORIDA
A COMPONENT UNIT OF THE STATE OF FLORIDA
STATEMENT OF CASH FLOWS
For the Fiscal Year Ended June 30, 2010
This is trial version
www.adultpdf.com
FEBRUARY 2011 REPORT NO. 2011-108
16
College
RECONCILIATION OF OPERATING LOSS
TO NET CASH USED BY OPERATING ACTIVITIES
Operating Loss (76,603,622)$
Adjustments to Reconcile Operating Loss
to Net Cash Used by Operating Activities:
Depreciation Expense 6,647,279
Changes in Assets and Liabilities:
Accounts Receivable, Net (543,781)
Notes Receivable, Net 6,315
Due From Other Governmental Agencies (226,502)
Prepaid Expenses (65,755)
Salaries and Payroll Taxes Payable 204,485
Accounts Payable (441,915)
Deferred Revenue 253
Deposits Held for Others 96,507
Compensated Absences Payable 171,167
Other Postemployment Benefits Payable 16,329
NET CASH USED BY OPERATING ACTIVITIES
(70,739,240)$
SEMINOLE STATE COLLEGE OF FLORIDA
A COMPONENT UNIT OF THE STATE OF FLORIDA
STATEMENT OF CASH FLOWS (Continued)
For the Fiscal Year Ended June 30, 2010
The accompanying notes to financial statements are an integral part of this statement.
This is trial version
www.adultpdf.com