báo cáo hóa học:" Neopterin production and tryptophan degradation during 24-months therapy with interferon beta-1a in multiple sclerosis patients" pot
Bạn đang xem bản rút gọn của tài liệu. Xem và tải ngay bản đầy đủ của tài liệu tại đây (285.12 KB, 9 trang )
RESEARC H Open Access
Neopterin production and tryptophan
degradation during 24-months therapy with
interferon beta-1a in multiple sclerosis patients
Valentina Durastanti
1*
, Alessandra Lugaresi
2
, Placido Bramanti
3
, Mariapia Amato
4
, Paolo Bellantonio
5
,
Giovanna De Luca
2
, Orietta Picconi
6
, Roberta Fantozzi
7
, Laura Locatelli
8
, Annalisa Solda’
9
, Edoardo Sessa
3
,
Rocco Totaro
10
, Silvia Marino
3
, Valentina Zipoli
4
, Marino Zorzon
8
and Enrico Millefiorini
11
Background: Increased synthesis of neopterin and degradation of tryptophan to kynurenine, measured as
kynurenine/tryptophan ratio (kyn/trp ratio), are considered in vitro markers of interferon beta-1a (IFNb-1a) activity.
The aim of the study was to investigate the dynamic pro file of neopterin and kyn/trp ratio in patients with
relapsing remitting mul tiple sclerosis (RRMS) treated with two different doses of IFNb-1a over a period of
24 months.
Methods: RRMS patients (n = 101) received open-label IFNb-1a 22 mcg (low dose , LD) or 44 mcg (high dose, HD)
subcutaneously (sc), three times weekly for 24 months. Serum measurements of neopterin, kyn/trp ratio and
neutralizing antibodies (NAbs) were obtained before treatment (i.e., at baseline) and 48 hours post-injection every
3 months thereafter. Clinical assessments were performed at baseline and every 6 months. Changes in biomarkers
over time were compared between LD- and HD-group as well as between patients with/without relapses and
with/without NAbs using Analysis of Variance and Mann-Whitney tests.
Results: Neopterin (p < 0.001) and kyn/trp ratio (p = 0.0013) values increased over time vs baseline in both
treatment groups. Neopterin value s were higher (p = 0.046) in the HD-compared to the LD-group at every time
point with the exclusion of months 21 and 24 of therapy. Conversely, there were no differences between the two
doses groups in the kyn/trp ratio with the exclusion of month 6 of therapy (p < 0.05). Neopterin levels were
significantly reduced in NAb-positive patients starting from month 9 of therapy (p < 0.05); the same result was
observed for kyn/trp ratio but only at month 9 (p = 0.02). Clinical status did not significantly affect neopterin
production and tryptophan degradation.
Conclusions: Although differences in serum markers concentration were found following IFNb administration the
clinical relevance of these findings needs to be confirmed with more detailed studies.
Background
In multiple sclerosis (MS) patients, IFNb-1a reduces
clinical and imaging signs of disease activity, ultimately
delaying the progression of physical disability [1,2].
However, a relatively long-te rm follo w-up is necessary
for changes in physical disability scores to become evi-
dent. Although magnetic r esonance imaging ( MRI)
represents a gold standard for MS diagnosis and can
provide fast information regarding the stage of the dis-
ease and its changes over time, is still an expensive and
time consuming test. Inarguably, a biological marker of
drug response would provide a low-cost and easy
method of assessing treatm ent efficacy. To date, no bio-
markers that parallel clinical and MRI measureme nts of
response to treatment have been identified. Several l ines
of evid ence suggest that neopterin and tryptophan (trp)
degradation catabolites (such as kynurenine [kyn]) could
be considered indirect indicators of IFNb’s action [3-5].
* Correspondence:
1
Department of Neurological Sciences, University “La Sapienza”, Viale
dell’Università, 30, 00185, Rome, Italy
Full list of author information is available at the end of the article
Durastanti et al. Journal of Translational Medicine 2011, 9:42
/>© 2011 Durastanti et al; licensee BioMed Central Ltd. This is an Open Access article distributed unde r the terms of the Creative
Commons Attribution License ( nses/by/2.0), which permits unrestricted use, distribution, and
reprodu ction in any medium, provided the original work i s properly cited.
Bind ing of IFNb to its cell-surface receptor stimu lates
several immunological processes, including neopterin
[D-erythro-6-(1’,2’,3’ -trihydroxypropyl)-pterin] produc-
tion [6] and trp degradation [7,8]. In vitro evidence
demonstrated that both IFNb and IFNg induce neop-
terin production [9] and activate the enzyme indolea-
mine (2,3)-dioxygenase (IDO). Such enzyme catalyzes
trp degra dation to kyn ( among other downstream cata-
bolites) in several cell types [10,11]. The kyn/trp ratio
provides an estimate of IDO activity and correlates with
markers of IFNg immune activation, like neopteri n
[8,12].
While neopterin has numerous biochemical and phy-
siological functions in host defense, trp degradation
induced by IDO limits trp supply for proliferating cells,
thus determining their growth arrest [8,13,14]. Hence,
neopterin production and trp degradation could be con-
sidered as indicators of the antivir al and immunomodu-
latory activities of type-I IFNs.
In vivo studies in MS patients have confirmed that
IFNb-1a induces neopter in prod uction [15-17] and IDO
activation [18]. However, it remains unknown if any of
those markers correlates wit h IFNb-1a dose and/or clin-
ical outcome.
In this prospective study 101 patients with relapsing
remitting MS (RRMS) were treated with one of two
doses of IFNb-1a for 24 months. Repeated evaluations
of neopterin and kyn/trp ratio, as well as of physical dis-
ability, were performed in order to assess the correlation
between biological and clinical effects of IFNb-1a in
these patients. The correlation bet ween the markers of
IFNb biological activi ty and the presence of neutralizing
antibodies (Nabs) [19,20] was also evaluated.
Methods
Study design
This open-label randomized study was conducted in
seven Italian academic MS clinical centers (University
Hospitals of Chieti, Firenze, Isernia, L’Aquila, Messina,
Roma, and Trieste), in collabora tion with the University
of Innsbruck in Austria and the National Institute of
Biological Standards and Control in London, UK.
The study consisted of a 12-months screening/enroll-
ment phase, followed by a 24-months follow-up treat-
ment phase (TP), during which IFN-naïve RRMS
patients received IFNb-1a, either 22 mcg (low-dose , LD)
or 44 mcg (high-dose, HD) subcutaneously (sc) three
times weekly. Given the spontaneous, non-interventional
design of the study, in order not to modify common
clinical practice, but to warrant at the same time an
evenly distributed study population, the dose of IFNb-1a
considered optimal by the treating physician was f irst
started. Patients were then randomized, through a cen-
tralized procedure, to be included or not in cluded in the
study, maintaining the dosage selected by the treating
physician, i.e. a patient was excluded from t he study if
the selected dosage did not agree with randomiz ation.
Care was taken as to reach a balanced sample of LD-
and HD-patients (i.e., ~40 to 60% in each group) at
each site.
All patients underwent a ful l clinical examinatio n rat-
ing their physical disabi lity, by the Expanded Disability
Status Scale, or EDSS score [21], before treatment
(referred as baseline thereafter). After the baseline visit,
clinical assessments were repeated every 6 months. An
additional clinical examination was performe d when a
cli nical relapse occurred, defined as the occurrence of a
new symptom or worsening of a pre-existing symptom,
lasting at least 48 hours in the absence of fever [22].
Relapses were treated with intravenous methylpredniso-
lone (MP), 1 g/d for 5 days.
At baseline and every 3 months thereafter, blood sam-
ples were collected between 8:00am and 1:00 pm, in
fasting conditions. The post-dose time was 60-65 hours
after the last IFNb-1a injection. Such interval was cho-
sen based on previous observations that neopterin
values remained significantly elevated 48-72 hours aft er
administration of IFNb-1a both in healthy subjects [23]
and in patients with MS [16]. The chosen time interval
aimed at both maximizing the timing of sample collec-
tion consistency and, at the same time, accommodating
patients’ availability. As cytokine levels may var y
throughout the day, all samples were collected at the
same time of the day for each patient.
Blood samples were not collected if clinically evident
inflammation/infection was present. In those cases sam-
ples were collected 2 weeks after symptom resolution.
Inclusion and exclusion criteria
Patients with RRMS, according to the Poser’s criteria
[24], were recruited. Other inclusion criteria were age
18-50 years, body weight within 15% of normal (mini-
mum weight: 50 kg), disease duration ≤ 10 years, at
least two relapses in the preceding 2 years, EDSS score
of 1.0-5.5. Exclusion criteria were clinical relapse at the
time of enrollment; corticosteroid treatment within 1
month, immunomodulatory or immunosuppressive ther-
apy within 6 months prior to study entry, pregnancy,
major p sychiatric disturbances, and other neurological,
neoplastic, autoimmune or major infectious conditions.
Treatment regimens
Patients received IFNb-1a at a dose of 44 or 22 mcg, sc
three times weekly for 2 years. To minimize adverse
effects, IFNb-1a was titrated as follows: 8.8 mcg at
weeks 1 and 2 of therapy, 22 mcg at weeks 3 and 4,
and, for patients treated with the higher dose of IFNb-
1a, 44 mcg from week 5.
Durastanti et al. Journal of Translational Medicine 2011, 9:42
/>Page 2 of 9
Blood sample collection and storage until assay
Blood samples were collected into sterile tubes and
allowed to clot spontaneously for 20 minutes at room
temperatur e (i.e., 20-25°C) followed by centrifugation at
3,000 rpm for 10 minutes at 4°C. Sera were immediately
aspirated into dry, sterile tubes and stored at -20°C for
no longer than 6 months prior to assay. Sera collected
for the measurement of neopterin were processed and
stored in the dark; sample tubes were covered with alu-
minum foil throughout the procedure.
Measurement of neopterin, kyn and trp serum levels
All biological parameters were analyzed by an indepen-
dent laboratory whose personnel was blinded to
patients’ clinical and treatment information.
• neopterin
Neopterin concentration was measured using a com-
mercially available immunoassay (ELItest, BRAHMS,
Berl in, Germany), with a limit of detection of 2 nmol/L.
Serum neopterin concentrations in healthy controls
were defined as 5.3 ± 2.7 nmol/L, with the upper limit
of normal (95th percent ile) being 8.7 nmol /L. The assay
is a commercial immunoassay w hich has been reported
to be highly reproducible. Coefficients of variation of
the assay in our lab are similar to that reported by the
manufacturer [i.e. < 5.5% (intra-assay), a < 10 .3% (inter-
assay)]. The recovery for the neopterin immunoassay
was in the range of 91-108%.
• kyn and trp
Serum kyn and trp concentrations were measured by
high-performance liquid chromatography. Kyn concen-
trations were mon itored by ultraviolet absorption at 350
nm, while trp was measured by detection of natural
fluorescence (excitation wavelength: 285 nm, emission
wavelength: 350 nm) [25,26] with 3-nitro-L-tyrosine as
an internal standard. The coefficient of variation of
intra- and interassay determinations for trp and kyn was
below 5%. Recovery of trp and kyn was determined by
measuring trp and kyn in 20 μl of a pool of 10 sera
before and after adding 10 μl of mixture standard solu-
tions of high and low concentration. The recovery for
trp and kyn was in the range of 95-105%. Parallel dose-
response curves were ob tained by serial diluitions of trp
and kyn standard solutions and two serially diluted
serum samples.
IDO activity was calculated as the ratio of th e concen-
trations of the e nzyme pro duct, kyn, divided by its sub-
strate, trp (kyn/trp ratio).
As IDO is not the only enzyme known to trigger the
degradation of trp and subsequent kyn production, it
was necessary to demonstrate an association between
kyn/trp and immune activation using the specific
marker, neopterin, in order to confirm IDO
involvement.
Measurement of serum Nabs against IFNb
Measurement of serum NAbs was carried out by an
independent laboratory whose personnel was blinded to
patients’ clinical and treatment information.
A specific training on blood sampling and serum
separation was conducted by the Coordinating Center at
their lab facilities. A double blood sampling for each
measurement was obtained to ensure a full quality con-
trol of the analytical procedures.
To detect the presence of NAbs against IFNb-1a,
serum samples were tested by an antiviral IFNb neutra-
lization assay that assessed the antiviral activity and its
neutralization on the basis of the virus-induced cyto-
pathic effect (CPE). Briefly, monolayers of the human
glioblastoma cell line 2D9 were pretreated in 96-well
microtiter plates with diluted IFNb-1a (Rebif
®
)prepara-
tions (3-10 laboratory units, LU, per ml) that had been
pre-incubated for 2 hrs with serial dilutions of the test
sera. The cells were then challenged with encephalo-
myocarditis virus for 24 hrs, stained with 0.05% amido
blue black, fixe d with 4% formaldehyde in acetic acid
buffer and stain was eluted with 0.15 ml of 0.05M
NaOH solution before absorbance was read at 620 nm.
The NAbs titer was the dilution of serum that reduces
10 LU/ml of IFN to 1 LU/ml (the normal endpoint of
antiviral assays). The cut-off for positivity was a titer of
40. Titers were subsequently calculated with the Gross-
berg-Kawade formula and expressed as ten-fold redu-
cing units (TRU)/ml; cut-off for positivity was 40 TRU/
ml [27,28].
NAb-positive patients were defined as those present-
ing positive t iters in at least two consecutive v alid
measurements.
The NAb assay coefficients of variation (intra-ass ay
and inter-assay) never exceed 0.3 Log.
Recovery of NAb assay was determined by measuring
NAb t iter in 20 μl of a pool of 20 sera before and after
adding anti human IFN-beta antibody reference (G038-
501-572, National Institute of Health, Bethesda, USA) at
high and low co ncentra tions. The recovery for NAb was
in the range of 0.3 Log. Parallel line analysis of bioassay
showed no significant difference in slopes of dose
response curves prepared by serial diluition of human
IFNb antibody reference (G038-501-572) and three seri-
ally diluted NAb positive serum samples.
Study approvals
The study was carried out according to the Declaration
of Helsinki and its updates, ICH-GCP Guidelines for
Clinical Trials and EU Directives. All aspects of the
study were discussed with the patients, and each patient
gave his/her written informed consent prior to enroll-
ment. The local Ethics Committees approved the study
protocol.
Durastanti et al. Journal of Translational Medicine 2011, 9:42
/>Page 3 of 9
Statistical analysis
Data were expressed as means, except f or gender that
was expressed as perce ntage (%) and EDSS for which
median and standard error (SE) were used.
An Analysis of Variance (ANOVA) for repeated mea-
sures was performed to evaluate the effect of time and
dose on each of the biological markers. Such an analysis
was performed in the entire patient’scohortaswellas
in sub-groups of patients with or without relapse and
patients with or without NAbs.
At each time point, a Mann-Whitney test was per-
formed to identify differences in biological markers and
clinical measure betwe en HD and LD groups, between
patients with and without clinical relapse and between
NAb-positive and NAb-negative patients. Pearson Chi
square coefficient was used for comparisons between
proportions. Spearman’s correlation coefficient was used
to evaluate the correlation between laboratory and clini-
cal data.
Results
Patient demographics and clinical characteristics
During the 12-months enrollment phase, 101 consecu-
tive IFNb-1a naïve RRMS patients were enrolled. Patient
demographics and clinical characteristics at enrollment
are shown in Table 1. There were no differenc es in
baseline demograp hic and clinical variables betwe en the
two doses groups.
Of the 101 patients enrolled, 78 (77.2%) completed the
study. No differences in demographic and clinical vari-
ables between patients who did and did not complete
the study were obser ved (data not shown). Of the 78
patients who completed the study, 37 (47.4%) experi-
enced at le ast one relapse. There were no differences in
the pro portion of relapse-free patients between the two
doses groups.
Influence of dose and duration of therapy on biological
markers
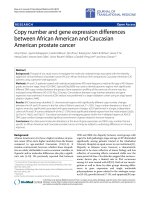
Neopterin and kyn/trp ratio profile s of each treatment
group are shown in figure 1(A, B). In each treatment
group, both neopterin concentration (p < 0.001) and
kyn/trp ratio (p = 0.0013) increased over time com-
pared to baseline. Mann-Whitney analyses s howed that
neopterin values w ere always higher in the HD-group
vs the LD-one at each time point (p = 0.046) apart
from months 21 and 24 of treatment period (TP).
Conversely, while trends towards higher values of kyn/
trp ratio in the HD-group were observed at numerous
time po ints, group differences were not statistically sig-
nificantatanytimepointwiththeexceptionof
month -6 of TP (p < 0.05).
Correlation between NAb status and neopterin serum
level or kyn/trp ratio
At the end of the study, evaluable data on NAbs were
available f or 71 patients (LD/HD = 35/36). NAbs were
present in 15 (21%) patients, 9 of which (26%) in LD-
group and 6 (17%) in the HD-group (p = 0.350).
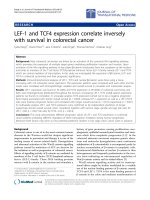
In figure 2(A, B) neopterin and kyn/trp ratio profiles
of NAb-positive and NAb-negative patients are
described. In each treatment group, both neopterin
levels (p = 0.0003), and kyn/trp ratio (p = 0.006)
increased over time compared to baseline. Although
serum levels of neopterin and kyn/trp ratio showed no
statistically significant difference between NAb-positive
and NAb-negative patients at baseline, neopterin levels
decreased significantly in NAb-positive patients from
month 9 of TP (p < 0.05); the same trend was observed
for kyn/trp ratio but the difference was significant only
at month 9 of TP (p = 0.02).
Correlation between biological markers and clinical
measures
No significant correlation emerged between laboratory
data and disease progression EDSS changes at any of
the examined time points; Disease progression was
definedasanincreaseofmorethan1pointonthe
EDSS (for EDSS between 0 a nd 3.5) and more than 0.5
point (for EDSS >3.5) during the TP. No significant cor-
relation was f ound between clinical relapses and labora-
tory data at any of the examined time points. The
presence of clinical relapse s consisted of t he onset of at
least one relapse during the TP.
Table 1 Patient demographics and clinical characteristics at baseline
IFNb-1a 44 mcg three times weekly (n = 48) IFNb-1a 22 mcg three times weekly (n = 53)
Age (years) 34.2 ± 8.4 35.3 ± 8.2
Sex (fem/male) 30 (62.5%)/18 (37.5%) 41 (77.4%)/12 (22.6%)
Age at disease onset 29.2 ± 8.3 30.4 ± 8.1
Duration of MS (years) 5.2 ± 4.3 4.9 ± 4.2
EDSS score 1.7 ± 1.0 1.6 ± 1.0
Annual relapse rate prior to therapy 0.8 ± 0.9 1.0 ± 1.2
Data are expressed as means, except for sex (expressed in number and percentage); EDSS: Expanded Disability Status Scale; IFNb-1a: interferon beta 1a; MS:
multiple sclerosis. All p values for comparisons of the characteristics listed above, between the two treatment groups, were not significant.
Durastanti et al. Journal of Translational Medicine 2011, 9:42
/>Page 4 of 9
There were no differences in any clinical measures
between NAb-positive and NAb-negative patients with
the exception of the baseline EDSS which was higher (p
= 0.04) in the NAb-positive vs the NAb-negative group
(data not shown).
Discussion
MS is a chronic demyelinating autoimmune disease o f
the central nervous system (CNS). It is characterized by
infiltrates of, mostly, macrophages, T and B lympho-
cytes, and plasma cells. A variable degree (usually more
pronounced in the advance d stages of the disease) of
axonal loss and gliotic scars can also be observed.
Monocyte-derived macrophages play an important role
in these processes and act both as phagocytes and
antigen presenting cells (APCs), releasing myelinotoxic
factors and proinflammatory cytokines. They are also
strongly stimulated by IFNg secreted by T lymphocytes
of the Th1 subset (principal effect ors of MS
physiopathology).
IFNb-1a is one of the approved treatments for RRMS
patients. The mechanism of actions of IFNb is still not
fully clarified; however, it seems to influence the
immune system through an immunomo dulatory action
and it also enhances the production of several cytokines
and proteins [17].
Validated biol ogical markers of the respo nsiveness to
IFNb-1a treatment would enable a reliable assessment
of the efficacy of MS therapy, both in c linical trials and
clinical practice, reducing the need for expensive and
Figure 1 A: neopterin serum level s as function of tim e and drug dose; B: kyn/trp ratio as function of time and drug dose.Neopterin
production (A) and tryptophan degradation (as measured by kynurenine/tryptophan ratio) (B) in patients treated with 22 or 44 mcg of
interferon beta-1a (IFNb-1a), administered three times weekly via subcutaneous injection.
Durastanti et al. Journal of Translational Medicine 2011, 9:42
/>Page 5 of 9
time-consuming procedures such as MRI. Such markers,
though, have not yet been identified [29].
Of the several putative candidates, two appeared to us
to be particularly promising: neopterin and kyn/trp
ratio. The value of both parameters is significantly raised
by the action of Th1-secreted-IFNg on macrophages
similarly to reactive oxygen species (ROS), which can be
considered as an index of oxidative stress [30].
Neopterin is a by-product in the synthetic pathway of
tetrahydro-biopterin. Upon I FNg macrophage stimula-
tion, biopterin synthesis is blocked at the step of neop-
terin whose levels are markedly increased in biological
fluids [3,31,32]. Elevated neopterin concentration in
body fluids has b een observed in a series of conditions
characterized by increased Th1 reactivity: infections
(particularly HIV), malignancies, autoimmune diseases
Figure 2 A: correlation between NAb-status and neopterin serum levels; B: corelation between NAb-status and k yn/trp ratio. Both,
neopterin levels (A) (p = 0.0003) and kyn/trp ratio (B) (p = 0.006) increased over time compared to baseline in each group. Although serum
levels of neopterin and kyn/trp ratio showed no statistical difference at baseline between NAb-positive and NAb-negative patients, neopterin
levels were significantly reduced in NAb-positive patients starting from month 9 onwards (p < 0.05); the same result was observed for kyn/trp
ratio but only relatively to month 9 (p = 0.02).
Durastanti et al. Journal of Translational Medicine 2011, 9:42
/>Page 6 of 9
(particularly RA) and transplants [33,34]. Indeed, i t can
be considered as an indirect indicator of IFNg levels
(difficult to measure in vivo) and of macrophage stimu-
lation intensity. Neopterin has gained high relevance as
a marker of immune activation (Th1 cells) to the point
that it is used to monitor patients who received allo-
grafts for early detection of possible immunological
complications.
In addition, another possible biochemical marker has
gained wide acceptance: the enhanced tryptophan degra-
dation induced by IFNg-stimulated macrophages.
Namely, the increased cellular expression and activity of
IDO and the ensuing raised N-formy l-kynurenine (a by -
product in the biochemical pathway to niacin) levels
that are measured in the serum. Tryptophan de grada-
tion by IDO (measured as kyn/trp ratio) decreases T
lymphocytes proliferation and consequently reduces
inflammation and allograft rejection. Hence, a new con-
cept is emerging in im munology: cells expressing IDO
can inhibit T cells responses and consequently induce
tolerance and reduce inflammation. Therefore, kyn/trp
ratio could be regarded as a potential index directly
related to treatment efficacy.
This study focused on the evaluation of neopterin
levels and kyn/trp ratio as markers of IFNb biological
activity. Out of the 101 INF-naïve RRMS patients
enrolled in this study, 78 were fully evaluable after 24
months of IFN b-1 a treatment both for the mo nitored
biomarkers and the clinical variables. In this study, we
investigated the dynamic profile of neopterin and kyn/
trp ratio and its correlation with the clinical features in
patients with RRMS treated with two different doses of
IFNb-1a.
Treatment with IFNb-1a (both LD and HD) increased
serum neopterin levels significantly as compared with
pre-trea tment levels and a dose-response was evident at
each time point (p ≤ 0.046). At month 21 of TP and at
the end of the study (month 24) a dose-effect was no
longer present since neopterin levels were simil ar in
both treatment groups. This might indicate a similar
efficacy, although delayed for the LD group, thus expos-
ing patients treated with the LD to the ri sk of early
relapses in the first months of treatment.
The observed patterns of neopterin production over
the 2 years of IFNb-1a treatment probably reflect a
biphasic (short- vs long-t erm effects) aspect of IFNb-1a
biological activity. Initially, IFNb-1a administration may
result in a sharp increase in the neopterin levels owing
to the acute, proinflammatory actions of IFNb-1a
[35,36]. However, in the long term its repeated adminis-
tration may lead to a down-regulation of IFNg expres-
sion and a subsequent decrease in macrophage
activation and biomarker expression [9,16]. At each time
point, the observed effects of IFNb-1a on neopterin may
reflect the relative predominance of short- over long-
term effects or vice versa. The increase in biomarker
levels in patients receiving the higher dose of IFNb-1a
became less marked with prolonged treatment, possibly
due to tachyphylaxis [19].
A tre nd showing higher valu e of kyn/trp ratios in the
HD-group was also seen at numerous time points, how-
ever, group-differences were not statistically significant
at any time point except for month-6 of the TP (p <
0.05). At the end of the study (month 24) a dose-effect
was no longer present since kyn/trp ratios were similar
in both treatment groups. This finding might in dicate
that, for tryptophan degradation/IDO activity a ceiling
effect might be present at therapeutic dosages.
As previously reported, the increase of kyn/trp ratio in
RRMS patients receiving IFNb-1a indicates the induc-
tion of IDO by IFN but such increase does not appear
to be dose-dependent [8]. At present, the impact of
IFNb-1a on tryptophan catabolism in patients with
RRMS remains unclear.
As with other proteic drugs, some MS patients
develop NAbs against IF Nb, which interfere with the
receptor-mediated functions of IFNb; the clinical rele-
vance of NAbs has been the subject of debate because
they appear to decrease treatment efficacy of IFNb in
those patients developing p ersistent, high titer NAbs
[37]. It has been reported that myxovirus-resistance pro-
tein A (MxA), an antiviral prot ein exclusively induced
by type 1 IFNs, is a sensitive measure of the in vivo
response to I FNb and of its reduced activity due to the
development o f NAbs [38]. Thus, in the present study,
data were also analyzed to determine whether the pre-
sence of NAbs affected neopterin serum levels or kyn/
trp
ratio.
Both, neopterin levels (p = 0.0003) and kyn/trp ratio
(p = 0.006) increased over time compared to baseline in
each group. Although serum levels of neopterin and
kyn/trp ratio at baseline showed no statistical difference
between NAb-positive and NAb-negative patients, neop-
terin levels were signi ficantly reduced in NA b-positiv e
patients starting from month 9 onwards (p < 0.05); the
same result was observed for kyn/trp ratio but only at
month 9 (p = 0.02). This is a logical consequence of the
timing of NAb formation, usually appearing between 3
and 12 months of treatment.
Other studies reported a fall in serum neopterin levels
or in the levels of other IFN biologic response markers,
including matrix metalloproteinases (MMPs), beta2
microglobulin, MxA, viperin, TNF-related apoptosis-
inducing ligand (TRAIL) and X-linked inhibitor apopto-
sis factor-1 (XAF-1), when NAb titers were elevated in
patients with MS [6,20,38-41]. Data clearly support the
hypothesis that neopterin is a sensitive measure of bio-
logical response to IFNb and is reduced by the presence
Durastanti et al. Journal of Translational Medicine 2011, 9:42
/>Page 7 of 9
of NAbs. Nevertheless, since no relations have been
found between neopterin and clinical progression, there
are issues regarding the use of neopterin as a measure
of the clinical efficacy of IFNb. It is important to under-
linethat,giventhenatureofMS,along-termobserva-
tion would be needed to clearly demonstrate the effects
on disease progression, like for MRI. In the present
study, th e patients analyzed showed a non-NAb-related
abrogation of kyn/trp ratio suggesting that the use of
the latter as a biological marker of IFN b treatment may
not be predictive of the biological responsiveness to
IFNb.
To gain further insight into the correlation between
biomarkers and clinical efficacy, we also investigated
whether disease pro gression and the occurrence of clini-
cal relapses influence d neopterin production and trypto-
phan degradation.
We found that the presence of disease progression
and clinical relapses did not significantly affect biomar-
ker levels. Furthermore, no differences in dose effect
were observed between patients who had a clinical
worseningduringthestudyperiodandthosewhodid
not, as previously reported [3,17]. These findings sug-
gest that, although both biomarkers capture the phar-
macodynamic effects of IFNb-1a, they do not
necessarily parallel clinical efficacy. A possible explana-
tion is that the immunoinflammatory process in MS
takes place in the CNS and d isease activity is only par-
tially reflected in the systemic immune compartment;
furthermore, many markers are unstable in the periph-
ery and are rapidly eliminated by the kidneys; there-
fore, the plasma concentration of many putative
markers fluctuate significantly and a single measure-
ment could be a mere snapshot. These observation s
suggest that probably serum is not the ideal body fluid
for measuring this marker concentration in order to
monitor disease activity in MS. A further possible
explanation is that patients with clinical relapses
received high dose intravenous corticosteroids and it
appears that this f orm of treatment can suppress the
production of neopterin or tryptophan degradation for
a period of time. Regarding disease progression, a later
explication of the lack of any correlation between dis-
ease progression a nd biomarker levels variation could
be that this is a two years study and does not show
theentireclinicalcourseofpatients.
Conclusions
Although differences in serum neopterin levels and kyn/
trp ratio, following IFNb administration were found in
our study, and a correlation between the presence o f
NAbs and lower serum levels of neopterin was observed,
the clinical relevance of these findings needs to be
established with further studies.
This can be ascribed, at least in part to the snapshot
effect related to the low-frequency of the sampling inter-
val (3-monthly) of the studied biological markers. Espe-
cially in MS, these markers are subject to marked
fluctuations, often on a daily basis. In particular for
neopterin, a deeper insight of IFNb treatment influence
on its production and its value as a surrogate marker of
inflammation in MS, can only be gained/evaluated with
a more frequent (at least weekly) sampling. This would
only be feasible using urine as a biological specimen,
instead of serum. Further studies are warranted to
monitor these putative surrogate markers of disease
activity in MS more stringently.
Acknowledgements
The authors thanks Florian Deisenhammer (Department of Neurology,
University of Innsbruck, Austria) and Anthony Meager (National Institute of
Biological Standards and Control in London, UK), for laboratory assistance;
Lucia Mancini for the English revision of the manuscript; patients and their
families are also gratefully acknowledged for their participation.
Author details
1
Department of Neurological Sciences, University “La Sapienza”, Viale
dell’Università, 30, 00185, Rome, Italy.
2
Multiple Sclerosis Centre, University “G.
d’Annunzio”, Chieti, Italy.
3
IRRCS Centro Neurolesi “Bonino-Pulejo”, Messina,
Italy.
4
Department of Neurology, University of Florence, Florence.
5
Department of Neurology, IRRCS Neuromed, Pozzilli, Italy.
6
Istituto Superiore
Sanità (ISS), Rome, Italy.
7
IRRCS Neuromed, Pozzilli, Italy.
8
Department of
Clinical Medicine and Neurology, University of Trieste, Trieste, Italy.
9
Department of Molecular Medicine, University La Sapienza, Rome, Italy.
10
Department of Neurology, University of L’Aquila, L’Aquila, Italy.
11
Department of Neurological Sciences, University La Sapienza, Rome, Italy.
Authors’ contributions
VD: collected blood samples, performed clinical examination of the patients
and wrote the manuscript. AL: collected blood samples, performed clinical
examination of the patients and helped to draft the manuscript. PB:
collected blood samples and performed clinical examination of the patients.
MA: collected blood samples and performed clinical examination of the
patients. PB: collected blood samples and performed clinical examination of
the patients. GDL: collected blood samples and performed clinical
examination of the patients. OP: performed the statistical analysis. RF:
collected blood samples and performed clinical examination of the patients.
LL: collected blood samples and performed clinical examination of the
patients. AS: helped to draft the manuscript. ES: collected blood samples
and performed clinical examination of the patients. RT: collected blood
samples and performed clinical examination of the patients. SM: collected
blood samples and performed clinical examination of the patients. VZ:
collected blood samples and performed clinical examination of the patients.
MZ: collected blood samples and performed clinical examination of the
patients. EM: designed the manuscript.
All authors read and approved the final manuscript.
Competing interests
The authors declare that they have no competing interests.
Received: 14 November 2010 Accepted: 18 April 2011
Published: 18 April 2011
References
1. Javed A, Reder AT: Therapeutic role of beta-interferons in multiple
sclerosis. Pharmacol Ther 2006, 110:35-56.
2. Kappos L, Traboulsee A, Constantinescu C, Eralinna JP, Forrestal F, Jongen P,
Pollard J, Sandberg-Wollheim M, Sindic C, Stubinski B, et al: Long-term
subcutaneous interferon beta-1a therapy in patients with relapsing-
remitting MS. Neurology 2006, 67:944-953.
Durastanti et al. Journal of Translational Medicine 2011, 9:42
/>Page 8 of 9
3. Giovannoni G, Lai M, Kidd D, Thorpe JW, Miller DH, Thompson AJ, Keir G,
Feldmann M, Thompson EJ: Daily urinary neopterin excretion as an
immunological marker of disease activity in multiple sclerosis. Brain
1997, 120(Pt 1):1-13.
4. Sorensen PS: Biological markers in body fluids for activity and
progression in multiple sclerosis. Mult Scler 1999, 5:287-290.
5. Bagnato F, Durastanti V, Finamore L, Volante G, Millefiorini E: Beta-2
microglobulin and neopterin as markers of disease activity in multiple
sclerosis. Neurol Sci 2003, 24(Suppl 5):S301-304.
6. Scagnolari C, Duda P, Bagnato F, De Vito G, Alberelli A, Lavolpe V, Girardi E,
Durastanti V, Trojano M, Kappos L, Antonelli G: Pharmacodynamics of
interferon beta in multiple sclerosis patients with or without serum
neutralizing antibodies. J Neurol 2007, 254:597-604.
7. Meyer KC, Cornwell R, Carlin JM, Powers C, Irizarry A, Byrne GI, Borden EC:
Effects of interferons beta or gamma on neopterin biosynthesis and
tryptophan degradation by human alveolar macrophages in vitro:
synergy with lipopolysaccharide. Am J Respir Cell Mol Biol 1992, 6:639-646.
8. Amirkhani A, Rajda C, Arvidsson B, Bencsik K, Boda K, Seres E, Markides KE,
Vecsei L, Bergquist J: Interferon-beta affects the tryptophan metabolism
in multiple sclerosis patients. Eur J Neurol 2005, 12:625-631.
9. Meager T: The Molecular Biology of Cytokines John Wiley & Sons; 1998.
10. Carlin JM, Borden EC, Sondel PM, Byrne GI: Interferon-induced
indoleamine 2,3-dioxygenase activity in human mononuclear
phagocytes. J Leukoc Biol 1989, 45:29-34.
11. Adams O, Besken K, Oberdorfer C, MacKenzie CR, Takikawa O, Daubener W:
Role of indoleamine-2,3-dioxygenase in alpha/beta and gamma
interferon-mediated antiviral effects against herpes simplex virus
infections. J Virol 2004, 78:2632-2636.
12. Schrocksnadel K, Wirleitner B, Winkler C, Fuchs D: Monitoring tryptophan
metabolism in chronic immune activation. Clin Chim Acta 2006, 364:82-90.
13. Opitz CA, Wick W, Steinman L, Platten M: Tryptophan degradation in
autoimmune diseases. Cell Mol Life Sci 2007, 64:2542-2563.
14. Fuchs D, Moller AA, Reibnegger G, Stockle E, Werner ER, Wachter H:
Decreased serum tryptophan in patients with HIV-1 infection correlates
with increased serum neopterin and with neurologic/psychiatric
symptoms. J Acquir Immune Defic Syndr 1990, 3:873-876.
15. Rudick RA, Simonian NA, Alam JA, Campion M, Scaramucci JO, Jones W,
Coats ME, Goodkin DE, Weinstock-Guttman B, Herndon RM, et al: Incidence
and significance of neutralizing antibodies to interferon beta-1a in
multiple sclerosis. Multiple Sclerosis Collaborative Research Group
(MSCRG). Neurology 1998, 50:1266-1272.
16. Bagnato F, Pozzilli C, Scagnolari C, Bellomi F, Pasqualetti P, Gasperini C,
Millefiorini E, Galgani S, Spadaro M, Antonelli G: A one-year study on the
pharmacodynamic profile of interferon-beta1a in MS. Neurology 2002,
58:1409-1411.
17. Casoni F, Merelli E, Bedin R, Sola P, Bertolotto A, Faglioni P: Is serum
neopterin level a marker of responsiveness to interferon beta-1a
therapy in multiple sclerosis? Acta Neurol Scand 2004, 109:61-65.
18. Matrisciano F, Bonaccorso S, Ricciardi A, Scaccianoce S, Panaccione I,
Wang L, Ruberto A, Tatarelli R, Nicoletti F, Girardi P, Shelton RC: Changes in
BDNF serum levels in patients with major depression disorder (MDD)
after 6 months treatment with sertraline, escitalopram, or venlafaxine. J
Psychiatr Res 2009, 43:247-254.
19. Bertolotto A, Gilli F: Interferon-beta responders and non-responders. A
biological approach. Neurol Sci 2008, 29(Suppl 2):S216-217.
20. Pachner AR, Warth JD, Pace A, Goelz S: Effect of neutralizing antibodies
on biomarker responses to interferon beta: the INSIGHT study. Neurology
2009, 73:1493-1500.
21. Kurtzke JF: Rating neurologic impairment in multiple sclerosis: an
expanded disability status scale (EDSS). Neurology 1983, 33:1444-1452.
22. Polman CH, Reingold SC, Edan G, Filippi M, Hartung HP, Kappos L,
Lublin FD, Metz LM, McFarland HF, O’Connor PW, et al: Diagnostic criteria
for multiple sclerosis: 2005 revisions to the “McDonald Criteria”. Ann
Neurol 2005, 58:840-846.
23. Munafo A, Trinchard-Lugan II, Nguyen TX, Buraglio M: Comparative
pharmacokinetics and pharmacodynamics of recombinant human
interferon beta-1a after intramuscular and subcutaneous administration.
Eur J Neurol 1998, 5:187-193.
24. Poser CM, Paty DW, Scheinberg L, McDonald WI, Davis FA, Ebers GC,
Johnson KP, Sibley WA, Silberberg DH, Tourtellotte WW: New diagnostic
criteria for multiple sclerosis: guidelines for research protocols. Ann
Neurol 1983, 13:227-231.
25. Widner B, Werner ER, Schennach H, Wachter H, Fuchs D: Simultaneous
measurement of serum tryptophan and kynurenine by HPLC. Clin Chem
1997, 43:2424-2426.
26. Laich A, Neurauter G, Widner B, Fuchs D: More rapid method for
simultaneous measurement of tryptophan and kynurenine by HPLC. Clin
Chem 2002, 48:579-581.
27. Grossberg SE, Kawade Y, Kohase M, Yokoyama H, Finter N: The
neutralization of interferons by antibody. I. Quantitative and theoretical
analyses of the neutralization reaction in different bioassay systems.
J Interferon Cytokine Res 2001, 21:729-742.
28. Grossberg SE, Kawade Y, Kohase M, Klein JP: The neutralization of
interferons by antibody. II. Neutralizing antibody unitage and its
relationship to bioassay sensitivity: the tenfold reduction unit. J Interferon
Cytokine Res 2001, 21:743-755.
29. Kieseier BC, Hartung HP: Bioavailability of interferon-beta in patients with
multiple sclerosis - fishing for the surrogate. Eur J Neurol 17:344-345.
30. Schroecksnadel K, Zangerle R, Bellmann-Weiler R, Garimorth K, Weiss G,
Fuchs D: Indoleamine-2, 3-dioxygenase and other interferon-gamma-
mediated pathways in patients with human immunodeficiency virus
infection. Curr Drug Metab 2007, 8:225-236.
31. Fredrikson S, Link H, Eneroth P: CSF neopterin as marker of disease
activity in multiple sclerosis. Acta Neurol Scand 1987, 75:352-355.
32. Ott M, Demisch L, Engelhardt W, Fischer PA: Interleukin-2, soluble
interleukin-2-receptor, neopterin, L-tryptophan and beta 2-microglobulin
levels in CSF and serum of patients with relapsing-remitting or chronic-
progressive multiple sclerosis. J Neurol 1993, 241:108-114.
33. Sucher R, Schroecksnadel K, Weiss G, Margreiter R, Fuchs D, Brandacher G:
Neopterin, a prognostic marker in human malignancies. Cancer Lett
287:13-22.
34. Murr C, Widner B, Wirleitner B, Fuchs D: Neopterin as a marker for
immune system activation. Curr Drug Metab 2002, 3:175-187.
35. Wandinger KP, Sturzebecher CS, Bielekova B, Detore G, Rosenwald A,
Staudt LM, McFarland HF, Martin R: Complex immunomodulatory effects
of interferon-beta in multiple sclerosis include the upregulation of T
helper 1-associated marker genes. Ann Neurol 2001, 50:349-357.
36. Boylan MT, Crockard AD, Duddy ME, Armstrong MA, McMillan SA,
Hawkins SA: Interferon-beta1a administration results in a transient
increase of serum amyloid A protein and C-reactive protein: comparison
with other markers of inflammation. Immunol Lett 2001, 75:191-197.
37. Polman C, Kappos L, White R, Dahlke F, Beckmann K, Pozzilli C,
Thompson A, Petkau J, Miller D: Neutralizing antibodies during treatment
of secondary progressive MS with interferon beta-1b. Neurology 2003,
60:37-43.
38. Malucchi S, Gilli F, Caldano M, Marnetto F, Valentino P, Granieri L, Sala A,
Capobianco M, Bertolotto A: Predictive markers for response to interferon
therapy in patients with multiple sclerosis. Neurology 2008, 70 :1119-1127.
39. Cook SD, Quinless JR, Jotkowitz A, Beaton P: Serum IFN neutralizing
antibodies and neopterin levels in a cross-section of MS patients.
Neurology 2001, 57:1080-1084.
40. Gilli F, Bertolotto A, Sala A, Hoffmann F, Capobianco M, Malucchi S, Glass T,
Kappos L, Lindberg RL, Leppert D: Neutralizing antibodies against IFN-
beta in multiple sclerosis: antagonization of IFN-beta mediated
suppression of MMPs. Brain 2004, 127:259-268.
41. Gilli F, Marnetto F, Caldano M, Sala A, Malucchi S, Capobianco M,
Bertolotto A: Biological markers of interferon-beta therapy: comparison
among interferon-stimulated genes MxA, TRAIL and XAF-1. Mult Scler
2006, 12:47-57.
doi:10.1186/1479-5876-9-42
Cite this article as: Durastanti et al.: Neopterin production and
tryptophan degradation during 24-months therapy with interferon
beta-1a in multiple sclerosis patients. Journal of Translational Medicine
2011 9:42.
Durastanti et al. Journal of Translational Medicine 2011, 9:42
/>Page 9 of 9