báo cáo hóa học:" Voice activity detection based on conjugate subspace matching pursuit and likelihood ratio test" pot
Bạn đang xem bản rút gọn của tài liệu. Xem và tải ngay bản đầy đủ của tài liệu tại đây (513.81 KB, 33 trang )
This Provisional PDF corresponds to the article as it appeared upon acceptance. Fully formatted
PDF and full text (HTML) versions will be made available soon.
Voice activity detection based on conjugate subspace matching pursuit and
likelihood ratio test
EURASIP Journal on Audio, Speech, and Music Processing 2011,
2011:12 doi:10.1186/1687-4722-2011-12
Shiwen Deng ()
Jiqing Han ()
ISSN 1687-4722
Article type Research
Submission date 29 June 2011
Acceptance date 21 December 2011
Publication date 21 December 2011
Article URL />This peer-reviewed article was published immediately upon acceptance. It can be downloaded,
printed and distributed freely for any purposes (see copyright notice below).
For information about publishing your research in EURASIP ASMP go to
/>For information about other SpringerOpen publications go to
EURASIP Journal on Audio,
Speech, and Music Processing
© 2011 Deng and Han ; licensee Springer.
This is an open access article distributed under the terms of the Creative Commons Attribution License ( />which permits unrestricted use, distribution, and reproduction in any medium, provided the original work is properly cited.
Voice activity detection based on conjugate subspace
matching pursuit and likelihood ratio test
Shiwen Deng
1,2
and Jiqing Han
∗1
1
School of Computer Science and
Technology, Harbin Institute of
Technology, Harbin, China
2
School of Mathematical Sciences, Harbin
Normal University, Harbin, China
∗
Corresponding author:
Email address:
SD:
Abstract
Most of voice activity detection (VAD) schemes are operated in the discrete
Fourier transform (DFT) domain by classifying each sound frame into speech
or noise based on the DFT coefficients. These coefficients are used as features
in VAD, and thus the robustness of these features has an important effect on
the performance of VAD scheme. However, some shortcomings of modeling
a signal in the DFT domain can easily degrade the performance of a VAD
2
in a noise environment. Instead of using the DFT coefficients in VAD, this
article presents a novel approach by using the complex coefficients derived from
complex exponential atomic decomposition of a signal. With the goodness-
of-fit test, we show that those coefficients are suitable to be modeled by a
Gaussian probability distribution. A statistical model is employed to derive
the decision rule from the likelihood ratio test. According to the experimental
results, the proposed VAD method shows better performance than the VAD
based on the DFT coefficients in various noise environments.
Keywords: voice activity detection; matching pursuit; likelihood ratio test;
complex exponential dictionary.
1 Introduction
Voice activity detection (VAD) refers to the problem of distinguishing active
speech from non-speech regions in an given audio stream, and it has become
an indispensable component for many applications of speech processing and
modern speech communication systems [1–3] such as robust speech recognition,
speech enhancement, and coding systems. Various traditional VAD algorithms
have been proposed based on the energy, zero-crossing rate, and spectral differ-
ence in earlier literature [1,4,5]. However, these algorithms are easily degraded
by environmental noise.
Recently, much study for improving the performance of the VADs in var-
ious high noise environments has b een carried out by incorporating a statis-
tical model and a likelihood ratio test (LRT) [6]. Those algorithms assume
3
that the distributions of the noise and the noisy speech spectra are specified
in terms of some certain parametric models such as complex Gaussian [7],
complex Laplacian [8], generalized Gaussian [9], or generalized Gamma distri-
bution [10]. Moreover, some algorithms based on LRT consider more complex
statistical structure of signals, such as the multiple observation likelihood ratio
test (MO-LRT) [11,12], higher order statistics (HOS) [13,14], and the modified
maximum a posteriori (MAP) criterion [15, 16].
Most of the above methods are operated in the DFT domain by classifying
each sound frame into speech or noise based on the complex DFT coefficients.
These coefficients are used as features, and thus the robustness of these features
has an important effect on the performance of VAD scheme. However, the
DFT, being a method of orthogonal basis expansion, mainly suffers two serious
drawbacks. One is that a given Fourier basis is not well suited for modeling
a wide variety of signals such as speech [17–20]. The other is the problem
of spectra components interference between the two components in adjacent
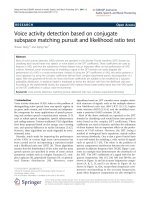
frequency bins [19, 20]. Figure 1 presents an example that demonstrates the
drawbacks of the DFT. The DFT coefficients of a signal with five frequency
components, 100, 115, 130, 160, and 200 Hz, are shown in Fig. 1a and its
accurate frequencies components (A, B, C, D, and E) are shown in Fig. 1b. As
shown in Fig. 1a, first, except these frequencies components corresponding to
the accurate frequencies, many other frequency components are also emerged
in the DFT coefficients all over the whole frequency bins. Second, there exists
the problem of spectra components interference at a, b, c, and d frequency
4
bins, because the corresponding accurate frequencies at A, B, C in Fig. 1b are
too adjacent to each other.
In this article, we present an approach for VAD based on the conjugate
subspace matching pursuit (MP) and the statistical model. Specifically, the
MP is carried out in each frame by first selecting the most dominant com-
ponent, then subtracting its contribution from the signal and iterating the
estimation on the residual. By subtracting a component at each iteration, the
next component selected in the residual does not interfere with the previous
component. Subsequently, the coefficients extracted in each frame, named MP
feature [21], are modeled in complex Gaussian distribution, and the LRT is
employed as well. Experimental results indicate that the proposed VAD algo-
rithm shows better results compared with the conventional algorithms based
on the DFT coefficients in various noise environments.
The rest of this article is organized as follows. Section 2 reviews the method
of the conjugate subspace MP. Section 3 presents our proposed approach for
VAD based the MP coeficients and statistical model. Implementation issues
and the experimental results are shows in Section 4. Section 5 concludes this
study.
2 Signal atomic decomposition based on conjugate subspace MP
In this section, we will briefly review the process of signal decomposition by us-
ing the conjugate subspace MP [19,20]. The conjugate subspace MP algorithm
is described in Section 2.1, and the demonstration of algorithm and compar-
5
ison between MP coefficients and DFT coefficients are presented in Section
2.2.
2.1 Conjugate subspace MP
Matching pursuit is an iterative algorithm for deriving compact signal approx-
imations. For a given signal x ∈ R
N
, which can be considered as a frame in a
speech, the compact approximation ˆx is given by
ˆx ≈
K
k=1
α
k
g
γ
k
(1)
where K and {α
k
}
k=1, ,K
denote the order of decomposition and the expan-
sion coefficients, respectively, and {g
γ
k
}
k=1, ,K
are the atoms chosen from a
dictionary whose element consists of complex exponentials such that
g
i
= Se
jw
i
n
, n = 0, , N − 1, (2)
where i and n are frequency and time indexes, and S is a constant in order
to obtain unit-norm function. The complex exponential dictionary is denoted
as D = [g
1
, , g
M
] where M is the number of dictionary elements such that
M > N. Note that, this dictionary contains the prior knowledge of the statis-
tical structure of the signal that we are mostly interested in. Here, the prior
knowledge is that speech is the sum of some complex exponential with complex
weights. And hence, speech can be represented by a few atoms in dictionary,
but noise is not.
The conjugate subspace MP is a method of subspace pursuit. In the sub-
space pursuit, the residual of a signal is projected into a set of subspaces,
6
each of which is spanned by some atoms from the dictionary, and the most
dominant component in the corresponding subspace is selected and subtracted
from the residual. Each of the subspaces in the conjugate subspace MP is the
two-dimensional subspace spanned by an atom and its complex conjugate.
With the given complex dictionary, the conjugate subspace MP is operated as
follows.
Let r
k
denotes the residual signal after k − 1 pursuit iterations, and the
initial condition is r
0
= x. At the kth iteration, the new residual r
k+1
is given
by
r
k+1
= r
k
− 2Re{α
k
g
γ
k
}, (3)
where α
k
is a complex coefficient, Re{·} denotes the real part of a complex
value, and g
γ
k
is the atom selected from the dictionary D given by
g
γ
k
= argmax
g∈ D
(Re{< g, r
k
>
∗
α
k
}), (4)
where the superscript
∗
denotes conjugate transpose. The projection coefficient
of the residual r
k
over the conjugate subspace span{g, g
∗
}, α
k
, is obtained by
α
k
=
1
1 − |c|
2
(< g, r
k
> −c < g, r
k
>
∗
), (5)
where g
∗
is the complex conjugate of g and c =< g, g
∗
> is the conjugate
cross-correlation coefficient. To obtain atomic decomposition of a signal, the
MP iteration is continued until a halting criterion is met.
After K iterations, the decomposition of x corresponds to the estimate
ˆx ≈ 2
K
k=1
Re{α
k
g
γ
k
}, (6)
7
where {α
k
}
K
k=1
are referred to as the complex MP coefficients of atomic de-
composition.
2.2 Demonstration of algorithm and comparison between MP coefficients and
DFT coefficients
In this section, we present an example to demonstrate the procedure of the
decomposition and compare the MP coefficients with DFT coefficients . Let
x[m] be the original signal defined by a sum of five sinusoids as follows
x[m] =
5
i=1
cos(2πmf
i
/F
s
), for m = 1, 2,
where F
s
= 4, 000 Hz is the sample frequency, and the frequencies f
1
, f
2
, , f
5
are 100, 115, 130, 160, and 200 Hz, respectively.
The noisy signal y[m] is given by y[m] = x[m] + n, where n is the uncor-
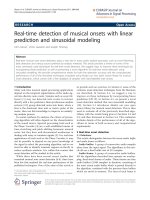
related additive noise. Figure 2a shows a 256 sample segment selected by a
Hamming window from y[m], the corresponding DFT coefficients are shown
in Fig. 2b,c that shows the accurate frequency components of x[m]. The pro-
cedure of the MP decomposition of five iterations is shown in Fig. 3. In each
iteration, the component with the maximum of Re{< g, r
k
>
∗
α
k
} is selected
as shown in the left column in Fig. 3, and, the corresponding α
k
is the MP
coefficient in the kth iteration. The extracted components 2Re{α
k
g
γ
k
} at the
kth iteration is shown in the right column in Fig. 3 and is subtracted from
the current residual r
k
to obtain the next residual r
k+1
according to Equation
8
(3). After five iterations, we can obtain five MP coefficients α
1
, . . . , α
5
, whose
magnitudes are shown in Fig. 2d.
As shown in Fig. 2, the MP coefficients accurately capture all the frequency
components of the original signal x[m] from the noisy signal y[m], but the DFT
coefficients only capture two frequency components of x[m]. On the other
hand, the MP coefficients well represent the frequency components without
the problem of the spectra components interference, such as these components
at A, B, and C shown in Fig. 2d, but the DFT coefficients fail to do this even
in the noise-free case. Therefore, the MP coefficients are more robust that the
DFT coefficients, and are not sensitive to the noise.
3 Decision rule based on MP coefficients and LRT
In this section, the VAD based on the MP coefficients and LRT is presented in
Section 3.1. To test the distribution of the MP coefficients, a goodness-of-fit
test (GOF) for those coefficients is provided in Section 3.2. More details about
the MP feature are discussed in Section 3.3.
3.1 Statistical modeling of the MP coefficients and decision rule
Assuming that the noisy speech x consists of a clean speech s and an uncor-
related additive noise signal n, that is
x = s + n (7)
9
Applying the signal atomic decomposition by using the conjugate MP, the
noisy MP coefficient extracted from x at each pursuit iteration has the follow-
ing form
α
k
= α
s,k
+ α
n,k
, k = 1, , K, (8)
where α
s,k
and α
n,k
are the MP coefficients of clean speech and noise, respec-
tively. The variance of the noisy MP coefficient α
k
is given by
λ
k
= λ
s,k
+ λ
n,k
, k = 1, , K. (9)
where λ
s,k
and λ
n,k
are the variances of MP coefficients of clean speech and
noise, respectively.
The K-dimensional MP coefficient vectors of speech, noise, and noisy speech
are denoted as α
α
α
s
, α
α
α
n
, and α
α
α with their kth elements α
s,k
, α
n,k
, and α
k
, re-
spectively. Given two hypotheses H
0
and H
1
, which indicate speech absence
and presence, we assume that
H
0
: α
α
α = α
α
α
n
H
1
: α
α
α = α
α
α
n
+ α
α
α
s
For implementation of the above statistical mo del, a suitable distribution of
the MP coefficients is required. In this article, we assume that the MP coeffi-
cients of noisy speech and noise signal are asymptotically independent complex
Gaussian random variables with zero means. We also assume that the vari-
ances of the MP coefficient of noise, {λ
n,k
, k = 1, , K} are known. Thus, the
probability density functions (PDFs) conditioned on H
0
, and H
1
with a set of
10
K unknown parameters Θ = {λ
s,k
, k = 1, , K}, are given by
p(α
α
α|H
0
) =
K
k=1
1
πλ
n,k
exp
−
|α
k
|
2
λ
n,k
(10)
p(α
α
α|Θ, H
1
) =
K
k=1
1
π(λ
n,k
+ λ
s,k
)
exp
−
|α
k
|
2
λ
n,k
+ λ
s,k
(11)
The maximum likelihood estimate
ˆ
Θ = {
ˆ
λ
s,k
, k = 1, . . . , K} of Θ is ob-
tained by
ˆ
Θ = argmax
Θ
{log p(α
α
α|Θ, H
1
)}, (12)
and equals
ˆ
λ
s,k
= |α
k
|
2
− λ
n,k
, k = 1, . . . , K. (13)
By substituting Equation (13) into Equation (11), the decision rule using the
likelihood ratio is obtained as follows
Λ
g
=
1
K
log
p(α
α
α|
ˆ
Θ,H
1
)
p(α
α
α|H
0
)
=
1
K
K
k=1
|α
k
|
2
λ
n,k
− log
|α
k
|
2
λ
n,k
− 1
H
1
H
0
η
(14)
where η denotes a threshold value.
3.2 GOF test for MP coefficients
The MP coefficients are considered to follow a Gaussian distribution in section
above. To test this, we carried out a statistical fitting test for the noisy MP
coefficients conditioned on both hypotheses under various noise conditions. To
this end, the Kolomogorov–Sriminov (KS) test [22], which serves as a GOF
test, is employed to guarantee a reliable survey of the statistical assumption.
11
With the KS test, the empirical cumulative distribution function (CDF)
F
α
is compared to a given distribution function F, where F is the complex
Gaussian function. Let α
α
α = {α
1
, α
2
, . . . , α
N
} be a set of the MP coefficients
extracted from the noisy speech data, and the empirical CDF is defined by
F
α
=
0, z < α
(1)
n
N
, α
(n)
≤ z < α
(n+1)
, n = 1, . . . , N
1, z ≤ α
(N)
(15)
where α
(n)
, n = 1, , N are the order statistics of the data α
α
α. To compute
the order statistics, the elements of α
α
α are sorted and ordered so that α
(1)
represents the smallest element of α
α
α and α
(N)
is the largest one.
For simulating the noisy environments, the white and factory noises from
the NOISEX’92 database are added to a clean speech signal at 0 dB SNR.
With the noisy speech, the mean and variance are calculated and substituted
into the Gaussian distribution. Figure 4 shows the comparison of the empirical
CDF and Gaussian function. As can be seen, the empirical CDF curves of
noisy speech signal are much closed to that of the Gaussian CDF under both
the white and factory noise conditions. Therefore, the Gaussian distribution
is suitable for modeling the MP coefficients.
3.3 Obtaining MP features
As mentioned before, the DFT coefficients suffer several shortcomings for mod-
eling a signal and exposing the signal structure. We use the MP coefficients,
{α
k
}
K
k=1
, obtained by the MP as the new feature for discriminating speech and
12
nonspeech. With the advantage of the atomic decomposition, MP coefficients
can capture the characteristics of speech [17] and are insensitive to environ-
ment noise. Therefore, the MP coefficients as a new feature for VAD are more
suitable for the classification task than DFT coefficients.
With the decomposition of a speech signal by using the conjugate MP, the
MP feature also captures the harmonic structures of the speech signal. Such
harmonic components can be viewed as a series of sinusoids, which are buried
in noise, with different amplitude, frequency, and phase. The kth harmonic
component h
k
extracted from the kth pursuit iteration has the following form
h
k
= A
k
cos(ω
k
+ φ
k
) = 2Re{α
k
g
γ
k
} (16)
where
A
k
,
ω
k
, and
φ
k
are the amplitude, frequency, and phase of the sinusoidal
component h
k
, respectively. Those harmonic structures are prominent in a
signal when the speech is present but not when noise only.
In a practical implementation, the procedure for extracting MP feature
is described as follows. Assuming the input signal is segmented into non-
overlapping frames, each frame is decomposed by conjugate subspace MP.
Thus, the complex MP coefficients of a given frame are obtained. Instead of
requiring a full reconstruction of a signal, the goal of MP is to extract MP
coefficients. These coefficients capture the most characters of a signal so that
the VAD detector based on them can detect whether the speech is present or
not. Naturally, the selection of iteration number K depends on the number of
sinusoidal components in a speech signal.
13
4 Experiments and results
4.1 Noise statistic update
To implement the VAD scheme, the variance of the noise MP coefficients
requires to be estimated, which are assumed to be known in Equation (14).
We assume that the signal consists of noise only during a short initialization
perio d, and the initial noise characteristics are learned. The background noise
is usually non-stationary, and hence the estimation requires to b e adaptively
updated or tracked. The update is performed frame by frame by using the
minimum mean square error (MMSE) estimation.
Since the signal is frame-processed, we use the superscript (m) to refer to
the mth frame so that λ
(m)
n,k
and α
(m)
k
denote λ
n,k
and α
k
, respectively. Given
the noisy MP coefficients α
(m)
k
at the mth frame, the optimal estimate of the
variance of the noise MP coefficients λ
(m)
n,k
under MMSE is given by
ˆ
λ
(m)
n,k
= E(λ
(m)
n,k
|α
(m)
k
)
= E(λ
(m)
n,k
|H
0
)P (H
0
|α
(m)
k
) + E(λ
(m)
n,k
|H
1
)P (H
1
|α
(m)
k
)
(17)
where
E(λ
(m)
n,k
|H
0
) = |α
(m)
k
|
2
(18)
E(λ
(m)
n,k
|H
1
) =
ˆ
λ
(m−1)
n,k
(19)
and
ˆ
λ
(m−1)
n,k
is the estimate in the previous frame. Based on the total probability
theorem and Bayes rule, the posterior probabilities of H
0
and H
1
given α
k
in
14
Equation 17 are derived as follows
P (H
0
|α
(m)
k
) =
p(α
(m)
k
|H
0
)P (H
0
)
p(α
(m)
k
|H
0
)P (H
0
)+p(α
(m)
k
|H
1
)P (H
1
)
=
1
1+εΛ
(m)
k
(20)
P (H
1
|α
(m)
k
) =
εΛ
(m)
k
1+εΛ
(m)
k
(21)
where ε = P(H
1
)/P (H
0
) and Λ
(m)
k
= p(α
(m)
k
|H
1
)/p(α
(m)
k
|H
0
). Since the deci-
sion is made by observing all the K MP coefficients, we replace the LRT at
the kth MP coefficient Λ
(m)
k
with their geometric mean Λ
(m)
g
in Equation (14).
Then the update formula of the variances of noise MP coefficients is given by
ˆ
λ
(m)
n,k
=
1
1 + εΛ
(m)
g
|α
(m)
k
|
2
+
εΛ
(m)
g
1 + εΛ
(m)
g
ˆ
λ
(m−1)
n,k
. (22)
4.2 Experimental results
In this section, the exp erimental results of our method are presented. To im-
plement the proposed method, the dictionary D is the fundamental ingredient
for decomposing a signal. The atoms of the dictionary are generated according
to Equation (2), and the number of atoms is set to be 2N, where N = 256.
Thus, the complex exponential dictionary D is a N × 2N complex matrix,
and is used in the following experiments. To demonstrate the effectiveness of
the proposed VAD, a test signal (Fig. 5b) is created by adding white noise
to a clean speech (Fig. 5a) at 0 dB SNR, and is divided into non-overlapping
frames with the frame length 256. The atomic decomposition based on the
conjugate subspace MP is operated on the test signal. The likelihood ratios
and the results of VAD calculated with Equation (14) are shown in Fig. 5c,d,
15
respectively. As can be seen, even at such a low SNR, the results also correctly
indicate the speech presence and thus verify the effectiveness of MP coefficients
in VAD.
The selection of the iteration number K in the MP has an important ef-
fect on the performance of the proposed method and the computational cost.
As shown in Fig. 6, the performances of the VAD in various K are measured
in terms of the the the receiver operating characteristic (ROC) curves, which
show the trade-off between the false alarm probability (P
f
) and speech detec-
tion probability (P
d
). It is clearly shown that the increasing of K improves
the performance of the VAD. A larger K, however, implies an increased com-
putational cost. Figure 7 shows the decrease of the average errors, defined by
P
e
= (P
f
+ 1 − P
d
)/2, against the increase of K in white, vehicle, and babble
noise at 0 dB. The average errors in three noises remain unchange when the
value of K is larger than 15. Therefore, a reasonable value of K is equal to
15 so as to yield a good trade-off between the computational cost and the
performance.
Based on the ROC curves, we evaluated the performances of the proposed
LRT VAD based on the MP coefficients (LRT-MP) by comparing with the
popular LRT VADs based on DFT coefficients, including Gaussian (LRT-
Gaussian) [7], Laplacian (LRT-Laplacian) [8], and Gamma (LRT-Gamma)
[10]. The test speech material used for the comparison is a clean speech of
135 s connected from 30 utterances selected from TIMIT database. The ref-
erence decisions are made on the clean speech by labeling manually at every
16
10 ms frame. To simulate the noise environments, the noise signal from NOI-
SEX’92 database is added to the test speech at 5 dB SNR. For fair comparison,
we do not consider any hang over during the detection, as these can be added
in a heuristic way after the design of the decision rule. Figures 8, 9, and 10
shows the ROC curves of these VADs in the white, vehicle, and babble noise
environments at 5 dB. It was observed that the proposed approach outper-
forms other VADs in three noise conditions. These results indicate that the
MP coefficients can capture harmonic structure of speech that is insensitive to
noise. In more detail, the performances of the proposed method compared with
the LRT-Laplacian, which has a better performance than the LRT-Gaussian
and LRT-Gamma, are summarized in Table 1, under white, vehicle, and bab-
ble noise conditions. The experimental results show that the VAD based on
MP coefficients outperforms the ones based on the DFT in all of the testing
conditions, and it can be concluded that the MP coefficients are more robust
to background noise than the DFT.
5 Conclusion
In this article, we present a novel approach for VAD. The method is based on
the complex atomic decomposition of a signal by using the conjugate subspace
MP. With the decomposition, the complex MP coefficients are obtained, and
modeled as the complex Gaussian distribution which is a suitable one according
to the results of GOF test. Based on the statistical model, the decision rule for
17
VAD is derived by incorporating the LRT on it. In a practical implementation,
the decision is made frame by frame in a frame-processed signal.
The advantage of the proposed approach is that the MP coefficients are
insensitive to the environmental noise, and hence the performance of VAD is
robust in high noise environments. Note that, the advantage with MP coeffi-
cients is obtained at the cost of computational cost, which is prop ortional to
the iteration number. An online detection can be implemented when the iter-
ation number is smaller than 20. Furthermore, the experimental results show
that the proposed approach outperforms the traditional VADs based on DFT
coefficients in white, vehicle, and babble noise conditions.
Competing interests
The authors declare that they have no competing interests.
Acknowledgements
This study was supported by the Natural Science Foundation of China (No.
61071181 and 91120303).
References
1. A Benyassine, E Shlomot, HY Su, D Massaloux, C Lamblin, JP Petit, ITU-T Recom-
mendation G.729, Annex B: a silence compression scheme for use with G.729 optimized
for V.70 digital simultaneous voice and data applications. IEEE Commun. Mag. 35(9),
64–73 (1997)
crimination based on contextual information integrated bispectrum LRT. IEEE Signal
18
2. K Itoh, M Mizushima, Environmental noise reduction based on speech/non-speech iden-
tification for hearing aids, in Proc. Int. Conf. Acoust., Speech, and Signal Process., vol.
1, pp. 419–422, 1997
3. N Virag, Single channel speech enhancement based on masking properties of the human
auditory system. IEEE Trans. Speech Audio Process. 7(2), 126–137 (1999)
4. K Woo, T Yang, K Park, C Lee, Robust voice activity detection algorithm for estimating
noise spectrum. Electron. Lett. 36(2), 180–181 (2000)
5. M Marzinzik, B Kollmeier, Speech pause detection for noise spectrum estimation by
tracking power envelope dynamics. IEEE Trans. Speech Audio Process. 10(6), 341–351
(2002)
6. SM Kay, Fundamentals of Statistical Signal Processing (Prentice-Hall, Englewood Cliffs,
1998)
7. J Sohn, NS Kim, W Sung, A statistical model-based voice activity detection. IEEE Signal
Process. Lett. 6(1), 1–3 (1999)
8. JH Chang, JW Shin, NS Kimm, Likelihood ratio test with complex Laplacian model for
voice activity detection, in Proc. Eurospeech, Geneva, Switzerland, pp. 1065–1068, 2003
9. JW Shin, JH Chang, NS Kim, Voice activity detection based on a family of parametric
distributions. Pattern Recogn. Lett. 28(11), 1295–1299 (2007)
10. JW Shin, JH Chang, HS Yun, NS Kim, Voice activity detection based on generalized
gamma distribution, In Proc. IEEE Internat. Conf. on Acoustics, Speech, and Signal
Processing, vol. 1, pp. 781–784, Corfu, Greece, 17–19 August 2005
11. J Ramirez, JC Segura, C Benitez, L Garcia, A Rubio, Statistical voice activity detection
using a multiple observation likelihood ratio test. IEEE Signal Process. Lett. 12(10), 689–
692 (2005)
12. JM Gorriz, J Ramirez, EW Lang, CG Puntonet, Jointly Gaussian PDF-based likelihood
ratio test for voice activity detection. IEEE Trans. Speech Audio Process. 16(8), 1565–
1578 (2008)
13. J Ramirez, JM Gorriz, JC Segura, CG Puntonet, AJ Rubio, Speech/non-speech dis-
Process. Lett. 13(8), 497–500 (2006)
19
14. JM Gorriz, J Ramirez, CG Puntonet, JC Segura, Generalized LRT-based voice activity
detector”. IEEE Signal Process. Lett. 13(10), 636–639 (2006)
15. JW Shin, HJ Kwon, NS Kim, Voice activity detection based on conditional MAP crite-
rion. IEEE Signal Process. Lett. 15, 257–260 (2008)
16. Shiwen Deng, Jiqing Han, A modified MAP criterion based on hidden Markov model
for voice activity detecion, in Proc. Int. Conf. Acoust., Speech, Signal Process., Prague,
pp. 5220–5223, 22–27 May 2011
17. SG Mallat, Z Zhang, Matching pursuit in a time-frequency dictionary. IEEE Trans.
Signal Process. 41(12), 3397–3415 (1993)
18. M Goodwin, Matching pursuit with damped sinusoids, in Proc. IEEE Internat. Conf.
on Acoustics, Speech, and Signal Processing, vol. 3, Munich, Germany, pp. 2037–2040,
21–24 April 1997
19. M Goodwin, M Vetterli, Matching pursuit and atomic signal models based on recursive
filter banks. IEEE Trans. Signal Process. 47(7), 1890–1902 (1999)
20. MR McClure, L Carin, Matching pursuits with a wave-based dictionary. IEEE Trans.
Signal Process. 45(12), 2912–2927 (1997)
21. D Shiwen, H Jiqing, Voice activity detection based on complex exponential atomic
decomposition and likelihood ratio test, in 20th Int. Conf. Pattern Recognition, ICPR
2010, Istanbul, Turkey, pp. 89–92, 2010
22. RC Reininger, JD Gibson, Distributions of the two dimensional DCT coefficients for
images. IEEE Trans. Commun. 31(6), 835–839 (1983)
20
Table 1. Performance evaluation in different noise conditions
Environments LRT-MP LRT-Laplacian
Noise SNR (dB) P
d
(%) P
f
(%) P
d
(%) P
f
(%)
White 0 87.9 10.7 88.7 10.3
5 94.3 9.9 94.2 9.7
10 96.4 9.5 95.8 9.6
20 97.2 9.4 96.8 9.2
Vehicle 0 85.3 10.9 80.3 11.4
5 93.3 10.7 89.7 10.5
10 95.4 9.1 92.5 10.2
20 97.2 8.8 95.2 9.3
Babble 0 63.3 11.1 58.7 11.9
5 79.3 11.1 78.9 11.7
10 84.2 9.3 80.6 10.4
20 87.4 9.1 83.7 9.6
21
Fig. 1 Drawbacks of the DFT coefficients. (a) The DFT coefficients of a signal with
frequencies: 100, 115, 130, 160, 200 Hz; (b) the accurate frequency components of the signal.
Fig. 2 Decomposition of a noisy signal by DFT and the conjugate subspace
MP. (a) The noisy signal; (b) the DFT coefficients of the noisy signal; (c) the accurate
frequency components of the original signal; (d) the MP coefficients of the noisy signal after
five iterations.
Fig. 3 Five iterations of the MP for a noisy signal. The left column shows each
iteration of the MP and the selected component is marked by a open circles; the right
column shows the corresponding signal component extracted at each iteration.
Fig. 4 Comparison of empirical and Gaussian CDFs of real part of the MP
coefficient of noisy speech at 0 dB SNR. (a) white noise; (b) factory noise.
Fig. 5 Results of the proposed VAD with white noise (SNR = 0 dB and K = 10).
(a) Clean sp eech signal. (b) Noisy speech signal. (c) Log likelihoo d ratio for (b). (d) VAD
results.
22
Fig. 6 ROC curves in different selection of iteration number K and other VAD
methods in pink noise (SNR = 5 dB).
Fig. 7 Average error for speech detection when increasing the iteration number
K in the atomic decomposition in white, vehicle, and babble noise (SNR = 0 dB).
Fig. 8 ROC curves for VADs in white noise (SNR = 5 dB).
Fig. 9 ROC curves for VADs in vehicle noise (SNR = 5 dB).
Fig. 10 ROC curves for VADs in babble noise (SNR = 5 dB).
0 100 200 300 400 500
0
1
2
(a)
Frequency(Hz)
Magnitude
0 100 200 300 400 500
0
1
2
(b)
Frequency(Hz)
Magnitude
A
D
EC
B
a
c
d
b
D
E
Figure 1
0 50 100 150 200 250
−10
0
10
(a)
sample index
0
1
2
(b)
0
1
2
(c)
0 100 200 300 400 500
0
1
2
(d)
Frequency (Hz)
B
C
D
A
E
B
C
EA
D
C
E
Figure 2