báo cáo hóa học:" Genome structure and transcriptional regulation of human coronavirus NL63" ppt
Bạn đang xem bản rút gọn của tài liệu. Xem và tải ngay bản đầy đủ của tài liệu tại đây (1.43 MB, 11 trang )
BioMed Central
Page 1 of 11
(page number not for citation purposes)
Virology Journal
Open Access
Research
Genome structure and transcriptional regulation of human
coronavirus NL63
Krzysztof Pyrc, Maarten F Jebbink, Ben Berkhout and Lia van der Hoek*
Address: Department of Human Retrovirology, University of Amsterdam, Meibergdreef 15, 1105 AZ, Amsterdam, The Netherlands
Email: Krzysztof Pyrc - ; Maarten F Jebbink - ; Ben Berkhout - ; Lia van der
Hoek* -
* Corresponding author
Abstract
Background: Two human coronaviruses are known since the 1960s: HCoV-229E and HCoV-
OC43. SARS-CoV was discovered in the early spring of 2003, followed by the identification of
HCoV-NL63, the fourth member of the coronaviridae family that infects humans. In this study, we
describe the genome structure and the transcription strategy of HCoV-NL63 by experimental
analysis of the viral subgenomic mRNAs.
Results: The genome of HCoV-NL63 has the following gene order: 1a-1b-S-ORF3-E-M-N. The
GC content of the HCoV-NL63 genome is extremely low (34%) compared to other coronaviruses,
and we therefore performed additional analysis of the nucleotide composition. Overall, the RNA
genome is very low in C and high in U, and this is also reflected in the codon usage. Inspection of
the nucleotide composition along the genome indicates that the C-count increases significantly in
the last one-third of the genome at the expense of U and G. We document the production of
subgenomic (sg) mRNAs coding for the S, ORF3, E, M and N proteins. We did not detect any
additional sg mRNA. Furthermore, we sequenced the 5' end of all sg mRNAs, confirming the
presence of an identical leader sequence in each sg mRNA. Northern blot analysis indicated that
the expression level among the sg mRNAs differs significantly, with the sg mRNA encoding
nucleocapsid (N) being the most abundant.
Conclusions: The presented data give insight into the viral evolution and mutational patterns in
coronaviral genome. Furthermore our data show that HCoV-NL63 employs the discontinuous
replication strategy with generation of subgenomic mRNAs during the (-) strand synthesis. Because
HCoV-NL63 has a low pathogenicity and is able to grow easily in cell culture, this virus can be a
powerful tool to study SARS coronavirus pathogenesis.
Background
Until recently only two human coronaviruses were known
– human coronavirus (HCoV) 229E and HCoV-OC43,
representatives of the group 1 and 2 coronaviruses, respec-
tively. Both were identified in 1960s and are generally
considered as common cold viruses. An outbreak of severe
acute respiratory syndrome (SARS) in the spring of 2003
led to the rapid identification of SARS-CoV [1,2], which is
considered to be a distinct member of the group 2 corona-
viruses [3] or the first member of group 4 coronaviruses
[4,5]. We identified earlier this year another human path-
ogen from this family: HCoV-NL63 [6], a variant that
Published: 17 November 2004
Virology Journal 2004, 1:7 doi:10.1186/1743-422X-1-7
Received: 29 October 2004
Accepted: 17 November 2004
This article is available from: />© 2004 Pyrc et al; licensee BioMed Central Ltd.
This is an Open Access article distributed under the terms of the Creative Commons Attribution License ( />),
which permits unrestricted use, distribution, and reproduction in any medium, provided the original work is properly cited.
Virology Journal 2004, 1:7 />Page 2 of 11
(page number not for citation purposes)
belongs to group 1 together with HCoV-229E and PEDV.
These recent findings may be striking, as since the 1960's
not a single new HCoV had been described. The genome
features of SARS-CoV and its transcription strategy have
been described in detail [1,5,7]. Here, we present such an
analysis for HCoV-NL63.
HCoV-NL63 is a member of the coronaviridae family that
clusters together with arteri-, toro- and roniviruses in the
order of the nidovirales. Coronaviruses are enveloped
viruses with a positive, single stranded RNA genome of
approximately 27 to 32 kb. The 5' two-third of a corona-
virus genome encodes a polyprotein that contains all
enzymes necessary for RNA replication. The expression of
the complete polyprotein requires a -1 ribosomal
frameshift during translation that is triggered by a pseudo-
knot RNA structure [8,9]. The polyprotein undergoes
autocatalytic cleavage by the viral papain-like proteinase
and a chymotrypsin-like proteinase. The 3' one-third of a
coronavirus genome encodes several structural proteins
such as spike (S), envelope (E), membrane (M) and nucle-
ocapsid (N) that, among other functions, participate in
the budding process and that are incorporated into the
virus particle. Some of the group 2 viruses encode a
hemagglutinin esterase (HE) [10,11]. Non-structural pro-
tein genes are located between the structural genes. These
accessory genes vary significantly in number and sequence
among coronavirus species. Their precise function is
unknown, but several reports indicate that they can mod-
ulate viral pathogenicity [12].
Coronavirus replication is a complex, not yet fully under-
stood mechanism [13,14]. The 5' end of the genomic RNA
contains the untranslated leader (L) sequence with the
Transcription Regulation Sequence (TRS) in the down-
stream part. The L TRS is very similar to sequences that can
be found in front of each open reading frame (body
TRSs). The RNA-dependent RNA-polymerase has been
proposed to pause after a body TRS of a particular gene is
copied during (-) strand synthesis, subsequently switch-
ing to the L TRS and thus adding a common L sequence to
each sg mRNA [15]. This discontinuous transcription
mechanism is based on base-pairing of the nascent (-)
strand copy RNA with the (+) strand L TRS. The nested set
of (-) strand sg mRNAs are subsequently copied into a set
of (+) strand sg mRNA. Other factors besides the sequence
similarity between body and L TRS influence the efficiency
of transcription. The level of transcription of a particular
gene has been reported to be inversely related to the dis-
tance of a particular TRS to the 3' end of the genome [16-
19].
In this study, we analyzed the genome structure of HCoV-
NL63. First, we focus on the unusual nucleotide composi-
tion of the RNA genome. We describe in detail the bias in
the nucleotide composition and its influence on the
codon usage of this virus. We provide a possible mecha-
nistic explanation for a shift in nucleotide bias at two-
third of the HCoV-NL63 genome that is based on the RNA
replication mechanism. Second, we describe in detail the
different sg mRNAs generated during HCoV-NL63 replica-
tion and their relative abundance.
Results
Nucleotide content of the HCoV-NL63 genome
We described previously that the newly identified HCoV-
NL63 virus has a typical coronavirus genome structure
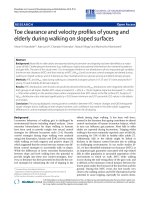
Nucleotide content of coronaviridae RNA genomesFigure 1
Nucleotide content of coronaviridae RNA genomes. We
arranged the viruses based on their C-count, which ranges
from 14% (HCoV-NL63) to 20% (SARS-CoV).
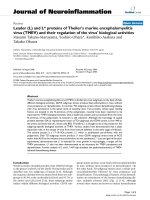
Nucleotide content of individual HCoV-NL63 genes and the 5'/3' untranslated regions (UTR)Figure 2
Nucleotide content of individual HCoV-NL63 genes and the
5'/3' untranslated regions (UTR).
Virology Journal 2004, 1:7 />Page 3 of 11
(page number not for citation purposes)
and gene order [6]. The nucleotide composition of the
genomic (+) strand RNA of several coronaviridae mem-
bers is presented in Figure 1, demonstrating a common
pattern with U as the most abundant nucleotide and G
and in particular C as underrepresented nucleotides.
HCoV-NL63 has the most extreme nucleotide bias among
the coronaviridae, with 39% U and only 14% C. As a gen-
eral trend, U and C seem to compete directly, because the
genomes with the lowest C-count (HCoV-NL63, HCoV-
OC43 and BCoV) have the highest U-count and vice versa
(Figure 1).
To investigate if all coding regions of HCoV-NL63 display
a similarly strong preference for U and against C, we also
plotted the nucleotide count for the individual genes and
5' and 3' non-coding regions (Figure 2). The typical nucle-
otide bias is observed in all genome segments. The highest
U-count is found in the ORF3 and E genes (43%) and the
lowest C-count in the 1a/1b genes and the 3' UTR (13%,
14% and 14%, respectively). The N gene is most moderate
in its nucleotide bias, with 21% C and 32% U, confirming
the "competition" idea that was already suggested by
inspection of Figure 1.
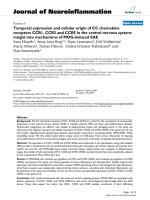
We plotted the nucleotide distribution along the genome
(Figure 3) to determine whether there is any significant
variation. We observed that local changes in A-count are
inversely linked to changes in G-count. This is most strik-
ing in the 20400–26000 nt region, where three A peaks
are mirrored by three G anti-peaks. Although the typical
bias is maintained along the genome, the most notable
variation occurs in the last one-third of the genome,
where an increase in C and a decrease in G content is
apparent. This region encodes the structural proteins.
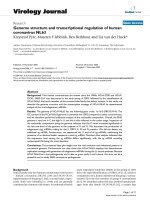
Nucleotide distribution along the HCoV-NL63 genomeFigure 3
Nucleotide distribution along the HCoV-NL63 genome. The change in the C- and G-count at two-third of the genome is sta-
tistically significant for all tested coronaviruses (HCoV-NL63, HCoV-229E, SARS-CoV, HCoV-OC43) with p < 0.01 for C-
count and p < 0.05 for G-count in Mann-Whitney U test for two independent samples.
Virology Journal 2004, 1:7 />Page 4 of 11
(page number not for citation purposes)
Recently, Grigoriev reported an interesting feature within
coronaviral genomes that is visible when the cumulative
GC-skew is plotted [20,21]. Cumulative GC skew graph is
a way to visualize the local G:C ratio along the genome,
discarding the local fluctuations. A biphasic pattern was
described that separates the 1a/1b polyprotein genes and
the structural genes. The cumulative GC-skews for HCoV-
NL63 and four other coronaviruses: HCoV-OC43, HCoV-
229E, PEDV and SARS-CoV are presented in Figure 4. In
the 1a/1b genes, the G:C ratio reaches high levels, whereas
for all coronaviruses, including HCoV-NL63, the 3' end of
the genome displays a flattening of the curve, as the G:C
ratio reaches value ~ 1 or less. Grigoriev proposed that this
biphasic pattern is due to the discontinuous transcription
process [20]. He suggested that the frequent deamination
of cytosine on the (-) strand RNA results in a decrease of
G on the (+) strand in the region encoding the structural
genes. In the discussion section we will present an alterna-
tive mechanistic explanation.
HCoV-NL63 codon usage
The bias in the nucleotide count led us to compare the
codon usage of HCoV-NL63 with that of human mRNA
(Table 1). The codon usage of HCoV-NL63 differs mark-
edly from that of human mRNAs. Third-base choices in
the four-codon families (Thr, Pro, Ala, Gly, Val) provide a
convenient example of this contrasting codon usage. For
instance, the Gly codons in human mRNAs prefer C
(34%) over G (25%), A (25%) and U (16%). In contrast,
HCoV-NL63 prefers U (83%) over A (7%), C (8%) and G
(2%). This result strongly suggests that the codon usage is
shaped directly by the unusual nucleotide composition of
the viral genome, that is a high U-count and a low G/C-
count. All HCoV-NL63 genes, except for the E gene, follow
Cumulative GC-skew diagrams for several coronaviral RNA genomesFigure 4
Cumulative GC-skew diagrams for several coronaviral RNA genomes. The vertical bar indicates the border between the 1a/1b
and the structural genes.
Virology Journal 2004, 1:7 />Page 5 of 11
(page number not for citation purposes)
this trend (Table 1). The coronaviral addiction to the U
nucleotide is most prominent in the "free" third position
of degenerate codons. For the complete genome, the U-
count at the third position is up to 58% whereas the A-
count is 20%, G-count is 13% and C-count is only 9%
(Figure 5). This illustrates that the U-pressure mainly
affects the %C and %G.
Identification of the HCoV-NL63 TRS elements
The 5' end of HCoV-NL63 genome RNA contains the L
sequence of 72 nucleotides that ends with the L TRS ele-
ment. This TRS has a high similarity to short sequences
that are located in front of each open reading frame (S-
ORF3-E-M-N) [22]. We previously identified the L TRS
and body TRS of the N gene using a cDNA bank [6], which
allowed us to predict the body TRS of the other genes. To
confirm these predictions, we amplified and sequenced
all sg mRNA fragments with a general L primer and gene-
specific 3' primers in an RT-PCR protocol.
Nucleotide composition of the first, second and third codon positions in the HCoV-NL63 genomeFigure 5
Nucleotide composition of the first, second and third codon
positions in the HCoV-NL63 genome.
Table 1: Codon usage of HCoV-NL63 compared with that of human genes
Amino acid Codon Human
a
HCoV-
NL63
1ab (20190) S (4071nt) ORF3
(678nt)
E (234nt) M (681nt) N (1134nt)
Arg CGA 0.62
b
0.16 0.12 0.22 0.44 1.28 0.00 0.26
CGC 1.07 0.28 0.21 0.37 0.00 0.00 0.88 1.06
CGG 1.16
c
0.06 0.04 0.15 0.00 0.00 0.00 0.00
CGU 0.46 1.57 1.49 1.40 1.77 0.00 2.20 3.44
AGA 1.17 0.78 0.76 0.74 0.88 0.00 1.32 1.06
AGG 1.17 0.47 0.49 0.22 0.00 1.28 0.00 1.32
Leu CUA 0.70 0.39 0.31 0.29 2.65 1.28 0.88 0.26
CUC 1.97 0.36 0.24 0.74 0.88 2.56 0.44 0.26
CUG 4.01 0.21 0.18 0.37 0.44 1.28 0.00 0.00
CUU 1.30 2.97 2.84 2.87 4.42 3.85 5.73 2.91
UUA 0.74 2.68 2.75 2.51 2.65 3.85 4.41 0.79
UUG 1.28 2.95 2.97 3.02 3.54 2.56 2.20 2.38
Ser UCA 1.20 1.49 1.38 1.92 1.33 0.00 0.44 2.91
UCC 1.76 0.33 0.30 0.59 0.00 1.28 0.00 0.26
UCG 0.45 0.08 0.07 0.00 0.44 0.00 0.00 0.26
UCU 1.49 3.06 2.76 3.98 2.21 0.00 3.52 5.82
AGC 1.94 0.34 0.27 0.59 0.00 0.00 0.88 0.79
AGU 1.21 2.47 2.51 2.36 2.21 1.28 3.08 2.12
Thr ACA 1.49 1.72 1.89 1.33 0.88 1.28 2.64 0.26
ACC 1.91 0.44 0.40 0.52 0.00 1.28 0.44 1.06
ACG 0.62 0.19 0.13 0.37 0.44 0.00 0.88 0.00
ACU 1.30 3.58 3.28 5.53 4.87 1.28 1.76 2.65
Pro CCA 1.68 1.03 1.01 1.11 0.44 2.56 0.44 1.59
CCC 2.00 0.18 0.15 0.22 0.00 0.00 0.00 0.79
CCG 0.70 0.10 0.07 0.22 0.00 0.00 0.44 0.00
CCU 1.74 2.10 1.93 1.92 3.10 1.28 2.20 5.29
Ala GCA 1.60 1.51 1.66 1.33 0.00 2.56 1.32 0.26
GCC 2.83 0.64 0.55 1.11 0.88 0.00 0.44 0.79
GCG 0.75 0.14 0.13 0.22 0.00 0.00 0.00 0.26
GCU 1.86 3.38 3.39 3.02 3.98 2.56 2.64 4.76
Gly GGA 1.64 0.46 0.49 0.44 0.00 0.00 0.44 0.26
GGC 2.26 0.48 0.34 1.18 1.33 0.00 0.44 0.00
GGG 1.65 0.14 0.13 0.07 0.00 0.00 0.44 0.53
GGU 1.08 5.19 5.56 4.35 4.42 1.28 4.41 3.44
Val GUA 0.71 1.04 1.19 0.59 0.00 1.28 0.88 0.79
Virology Journal 2004, 1:7 />Page 6 of 11
(page number not for citation purposes)
Inspection of sg mRNA junctions indicated that they are
indeed composed of the part of the HCoV-NL63 genome
that is directly downstream of a particular body TRS, with
its 5' end derived from the leader sequence. Apparently,
strand transfer occurred on the 5' end of the body TRS, as
indicated in Figure 6. The most conserved TRS region was
defined by multiple sequence alignment as AACUAAA
(gray box). This core sequence is conserved in all sg
mRNA, except for the E gene that contains the sub-opti-
mal TRS core AACUAU
A (Figure 6). Interestingly, the E
gene contains a 13-nucleotide sequence upstream of the
core sequence with perfect homology to the L sequence.
Perhaps the upstream sequence compensates for the
absence of an optimal TRS core during discontinuous (-)
strand synthesis. This would suggest that these sequences
are copied during (-) strand synthesis, and that the actual
strand transfer within the E sequences occurred after cop-
ying of the core TRS and the next 13 nucleotides. Evidence
for such a "delayed" strand transfer is provided by the
junction analysis of the M and N sg mRNAs, which clearly
demonstrates that the nucleotides directly upstream of the
core TRS are derived from the body TRS element and not
from the leader.
Analysis of the subgenomic mRNAs of HCoV-NL63
To determine whether the predicted sg mRNAs encoding
the S-ORF3-E-M-N proteins are produced in virus-infected
cells, we performed Northern blot analysis on total cellu-
lar RNA (Figure 7). We used a (-) strand N gene probe that
anneals to both genomic RNA and all sg (+) strand
mRNAs. We included RNA from MHV-infected cells to
obtain discrete size markers. Six distinct mRNAs are
produced in HCoV-NL63 infected cells. The sizes of the
RNA fragments were estimated and these values nicely fit
the size of the genomic RNA and the five predicted sg
mRNAs. All HCoV-NL63 ORFs that have the potential to
encode viral proteins are indeed transcribed into sg
mRNAs (Figure 7).
To determine the expression level of each subgenomic
RNA, we measured the intensity of the signals. When plot-
ted as a function of the genome position (Figure 8), there
appears a correlation between the relative distance of a
gene to the 3' terminus and its RNA expression level, with
the exception of the E gene.
Discussion
We analyzed the nucleotide composition of the HCoV-
NL63 genomic (+) RNA, which was found to exhibit a typ-
ical coronavirus pattern with an abundance of U (39 %)
and shortage of G (20%) and C (14%). In fact, HCoV-
NL63 has the most pronounced nucleotide bias among
the coronaviridae.
There is a significant fluctuation in the nucleotide count
among the HCoV-NL63 genes. For instance, ORF3 and M
GUC 1.46 0.89 0.77 0.96 2.65 2.56 1.76 0.79
GUG 2.86 0.77 0.68 1.03 0.88 1.28 2.20 0.26
GUU 1.10 7.18 7.41 6.63 7.52 3.85 7.49 5.29
Lys AAA 2.40 3.25 3.70 1.33 2.65 2.56 1.32 3.70
AAG 3.22 2.25 2.29 1.77 1.77 0.00 1.76 4.23
Asn AAC 1.92 1.27 1.05 2.28 0.44 0.00 0.88 2.38
AAU 1.67 4.88 4.73 6.19 3.54 3.85 3.96 4.50
Gln CAA 1.2 1.97 1.89 2.58 1.77 5.13 0.44 1.59
CAG 3.44 1.03 0.76 1.69 0.00 0.00 2.20 3.70
His CAC 1.50 0.39 0.39 0.52 0.44 0.00 0.00 0.27
CAU 1.07 1.50 1.6 1.030.881.282.641.06
Glu GAA 2.89 2.20 2.35 1.55 3.10 1.28 1.32 2.12
GAG 4.00 1.12 1.17 0.66 0.44 0.00 1.32 2.38
Asp GAC 2.55 1.19 1.2 1.03 2.21 1.28 1.32 0.79
GAU 2.2 4.27 4.67 3.10 1.33 2.56 0.88 5.56
Tyr UAC 1.54 0.89 0.82 1.03 1.77 1.28 1.32 1.06
UAU 1.21 3.8 3.834.135.755.133.520.79
Cys UGC 1.26 0.30 0.31 0.29 0.44 0.00 0.00 0.26
UGU 1.03 3.01 3.28 3.02 1.33 2.56 1.76 0.00
Phe UUC 2.04 0.68 0.58 0.74 1.77 2.56 0.88 1.06
UUU 1.72 5.76 6.02 4.94 7.52 8.97 5.29 2.65
Ile AUA 0.73 1.30 1.29 1.62 1.33 2.56 0.88 0.26
AUC 2.11 0.33 0.30 0.44 0.00 0.00 1.32 0.26
AUU 1.58 3.76 3.77 3.68 3.98 7.69 3.08 3.17
a
data obtained from GenBank Release 142.0 [28].
b
all values represent the percentage of a specified codon.
c
the highest value for each codon group is typed bold.
Table 1: Codon usage of HCoV-NL63 compared with that of human genes (Continued)
Virology Journal 2004, 1:7 />Page 7 of 11
(page number not for citation purposes)
appear as extreme U-rich and A-poor islands. It is possible
that the unique nucleotide composition of some struc-
tural genes reflects their evolutionary origin, perhaps
suggesting that some of these functions were acquired
recently from another viral or cellular origin by gene trans-
fer. These properties mimic the pathogenicity islands of
prokaryotic genomes [23]. Consistent with this gene
transfer hypothesis is the observation that there is a lot of
variation in the number and identity of the 3' genes
among coronaviridae.
Inspection of the nucleotide composition along the
genome indicates a bi-phasic pattern. The 5' two-third of
the genome encoding the 1ab polyprotein has a stable
nucleotide count with the typical U>A>G>C order, but
rather striking differences are observed in the 3' one-third
of the genome that encodes the structural proteins (Figure
2). Most notably, the C-count increases significantly at the
expense of G and U. Grigoriev recently reported the typi-
cal nucleotide bias of coronaviral genomes and the switch
in nucleotide count at two-thirds of the genome [20]. He
performed an analysis based on cumulative GC-skew, and
suggested that the drop in GC-ratio is in fact due to a
decrease in G-count. However, inspection of the HCoV-
NL63 nucleotide composition indicates that the switch is
due to a sudden increase in C-count, with a slight drop in
G-count. Inspection of other coronaviral genomes con-
firms that C goes up (with highest significance in group 1
coronaviruses) and G goes down (with highest
significance in group 2 coronaviruses) at two-third of the
viral genome (results not shown). Grigoriev presented a
possible mechanistic explanation. He suggested that the
3'-terminal one-third of the viral genomic (-) strand is
more likely to be single stranded because (-) sg mRNA
synthesis on the (+) strand template frequently disrupts
the protective duplex in that region. This would make this
part of the (-) strand genome more vulnerable to C to U
transitions, which would eventually lead to a decrease of
the G-count on the (+) strand. This scenario explains the
G decrease, but obviously is not consistent with the local
increase in C-count. We therefore propose an alternative
mechanism that is also dictated by the viral transcription
strategy. The central 1a/1b portion of the viral (+) strand
genome is less likely to be annealed to complementary (-)
Body-leader junctions of all HCoV-NL63 sg mRNAsFigure 6
Body-leader junctions of all HCoV-NL63 sg mRNAs. Shown on top is the leader (L) sequence and below the specific sequences
upstream of the structural genes. The fusion of 5' L sequences to 3' sg RNA is indicated by the boxes. Sequence homology
between the strands near the junction is marked by asterisks, the conserved AACUAAA TRS core is highlighted in gray.
Virology Journal 2004, 1:7 />Page 8 of 11
(page number not for citation purposes)
strand during viral replication because most (-) strand
RNAs are sub-genomic, which lack this 1a/1b domain.
The 1a/1b portion of the genome thus becomes more
vulnerable to C to U deamination, which correlates with
the high U-count and the low C-count. Obviously, there
may be many other cellular conditions and viral proper-
ties like higher amount of secondary structures on the 3'
part of the genome that could have shaped the coronavi-
rus genome over an evolutionary timescale, but this sce-
nario explains the switch in nucleotide count at two-thirds
of the viral genome.
We show that U-counts reach the highest values and C-
counts the lowest values at the third position of the
HCoV-NL63 codons (Figure 5). Analysis of the synony-
mous codon usage indicates that codons with a high U
and A content are preferred over C and G rich codons
(Table 1). Thus, the peculiar genome composition has a
direct effect on the codon usage of HCoV-NL63, and pos-
sibly even an indirect effect on the amino acid
composition of coronaviral proteins by affecting the non-
synonymous codon usage [24-26]. The synonymous
codon usage of HCoV-NL63 clearly differs from that in
human cells. Thus, the genome may have been shaped by
cytosine deamination over an evolutionary timescale, but
it is possible that the translational machinery has
restricted this genome drift because of the availability of
tRNA molecules.
The left panel shows the Northern blot analysis of HCoV-NL63 RNA in infected LLC-MK2 cellsFigure 7
The left panel shows the Northern blot analysis of HCoV-NL63 RNA in infected LLC-MK2 cells. RNA of HCoV-NL63 (NL63
lane) was compared with RNA of MHV strain A59 (MHV lane). Non-infected LLC-MK2 cells are included as a negative control
(control lane). MHV RNA bands represent the complete genome (1) and sg mRNAs 2a (2), S (3), 17.8 (4), 13.1 and E (5), M (6),
N (7). HCoV-NL63 RNA includes the complete genome (1) and sg mRNAs for S (2), ORF3 (3), E (4), M (5) and N (6). The
right panel shows the MHV and HCoV-NL63 genome organization and the HCoV-NL63 sg-mRNAs.
Virology Journal 2004, 1:7 />Page 9 of 11
(page number not for citation purposes)
Inspection of the viral genome sequence led us to predict
that the 1ab polyprotein is expressed from the genomic
RNA and the 3' structural proteins and ORF3 from 5 dis-
tinct sg mRNAs. This was confirmed experimentally. We
observed that sg mRNAs are more abundant when the cor-
responding TRS is located closer to the 3' end of the
genome. The exception is formed by the E sg mRNA,
which is relatively underexpressed. This may correlate
with the low expression level of this protein. The general
trend of increased gene expression along the genome has
been reported previously for other coronaviruses [19]. A
possible mechanistic explanation is that the viral
polymerase density is reduced along the genome or that
the polymerase becomes less susceptible to execute a
transfer from body TRS to L TRS during extended (-)
strand synthesis. Fine-tuning of the efficiency of the
strand-transfer processes may be modulated by many
other features, including the local sequence and structure
of the core body TRS and its flanking regions. It was
reported previously [27] that the core of the L TRS of
group 1 coronaviruses is presented in the single stranded
loop of a mini-hairpin. We found similar motifs in HCoV-
NL63 (results not shown). Although not excessively sta-
ble, this structural motifs is predicted to fold as part of the
complete leader sequence, and it may participate in the
strand transfer process.
The core sequence AACUAAA is conserved in the L TRS
and all body TRSs, except for the E gene that has a single
mismatch AACUAU
A. The presence of a sub-optimal core
sequence may in fact explain the lower than expected
expression level of this sg mRNA (Figure 8). But there is
another striking feature of the E body TRS: it has 13 addi-
tional upstream nucleotides in common with the leader
TRS. If one assumes that strand transfer does not occur at
the core sequence but up to 13 nucleotides further
upstream, this sequence homology will result in addi-
tional base pairing interactions that may stimulate the
strand transfer process. Thus, the extended TRS homology
may compensate for the sub-optimal core element. A
remarkably similar scenario of sub-optimal core and
extended TRS is apparent in the E gene sequence of PEDV
(results not shown). A further indication that the viral
polymerase frequently copies beyond the core sequence is
Expression levels of the HCoV-NL63 genomic and sg mRNAsFigure 8
Expression levels of the HCoV-NL63 genomic and sg mRNAs.
Virology Journal 2004, 1:7 />Page 10 of 11
(page number not for citation purposes)
provided by the actual sequence of the M and N sg
mRNAs, which apparently have copied the TRS nucleotide
that flanks on the 5' side the core element of body TRS.
Methods
Genome Analysis
The nucleotide content of different Coronaviridae family
members was assessed using BioEdit software. The nucle-
otide distribution was determined using a Microsoft Excel
datasheet (300 nucleotide (nt) window and 10-nt step).
Codon usage was assessed using DNA 2.0 software. Data
was processed in Microsoft Excel datasheet and all
statistical analysis was performed with SPSS 11.5.0 soft-
ware. The level of significance of the nucleotide bias was
established for 300-nt non-overlapping windows with the
non-parametric Mann-Whitney U test for two independ-
ent samples. Cumulative GC-skew graphs were generated
as described previously [20] with the value in step n
defined as the sum of (G-C)/(G+C) from step 0 to n (200-
nt sliding window, 10-nt step).
Viral RNA isolation
HCoV-NL63 RNA was obtained from virus-infected LLC-
MK2 cells (2 × 10
7
) after 6 days of culture (virus passage
7). Mouse Hepatitis Virus (MHV) RNA was obtained by
infecting 2 × 10
7
LR7 cells with MHV strain A59. The
medium was removed and the cells were dissolved in 15
ml TRIzol
®
and RNA was isolated according to the stand-
ard TRIzol
®
procedure. RNA was subsequently precipitated
with 0.8 volume of isopropanol, dried and dissolved in 50
µl H
2
O. Integrity of the RNA was analyzed by electro-
phoresis on a non-denaturating 0.8% agarose gel. RNA
was stored at -150°C.
RT-PCR
The cDNA used for sequencing and probe construction
was made by MMLV-RT on viral RNA with 1 µg of random
hexamer DNA primers in 10 mM Tris pH 8.3, 50 mM KCl,
0.1% Triton-X100, 6 mM of MgCl
2
and 50 µM of each
dNTPs at 37°C for 1 hour. The single stranded cDNA
product was made into double-stranded DNA in a stand-
ard PCR reaction with 1.25 U of Taq polymerase (Perkin-
Elmer) per reaction with appropriate primers (see below).
Northern Blot
Gel electrophoresis of viral RNA was performed on a 1%
agarose gel with 7% of formaldehyde at 100 Volt in
1×MOPS buffer (40 mM MOPS, 10 mM sodium acetate,
pH 7.0). Transfer onto a positively charged nylon mem-
brane (Boehringer Mannheim) was done overnight by
means of capillary force. RNA was linked to the mem-
brane in a UV crosslinker (Stratagene). For generation of
the HCoV-NL63 probe, the RT-PCR product was further
amplified with 5' primer N5PCR1 (CTG TTA CTT TGG
CTT TAA AGA ACT TAG G) and 3' primer N3PCR1 (CTC
ACT ATC AAA GAA TAA CGC AGC CTG). Similarly, the
MHV probe was amplified with 5' primer MHV_UTR-B5'
(GAT GAA GTA GAT AAT GTA AGC GT) and 3' primer
MHV_UTR-B3' (TGC CAC AAC CTT CTC TAT CTG TTA T).
Labeling of the probes was done in a standard PCR reac-
tion with specific 3' primers (N3PCR1 and MHV_UTR-
B3') in presence of [α-
32
P]dCTP. Prehybridization and
hybridization was done in ULTRAhyb buffer (Ambion) at
50°C for 1 and 12 hours, respectively. The membrane was
then washed at room temperature with low-stringency
buffer (2×SSC, 0.2% SDS) and at 50°C in high stringency
buffer (0.1×SSC, 0.2% SDS). Images were obtained using
the STORM 860 phosphorimager (Amersham Bio-
sciences) and data analysis was performed with the
ImageQuant software package. The size of sg mRNA
fragments of HCoV-NL63 were estimated from their
migration on the Northern blot using the sg mRNA of
MHV as size marker.
Sequence analysis of TRS motifs
The L/body TRS junctions were PCR-amplified from an
HCoV-NL63 cDNA bank. We performed 35 cycle PCR
with the 5' L primer (L5 – TAA AGA ATT TTT CTA TCT ATA
GAT AG) and gene specific 3' primers (S gene – SL3' – ACT
ACG GTG ATT ACC AAC ATC AAT ATA; ORF3 – 4L3' –
CAA GCA ACA CGA CCT CTA GCA GTA AG; E gene – EL3'
– TAT TTG CAT ATA ATC TTG GTA AGC; M gene – ML3'
– GAC CCA GTC CAC ATT AAA ATT GAC A; N gene – 3-
163-F15 – ATT ACC TAG GTA CTG GAC CT). The PCR
products were analyzed by electrophoresis on a 0.8%
agarose gel and products of discrete size were used for
sequencing using the BigDye terminator kit (ABI) and ABI
Prism 377 sequencer (Perkin Elmer). Sequence analysis
was performed by Sequence Navigator and AutoAssem-
bler 2.1 software.
Sequences
The complete genome sequence of HCoV-NL63 [6] is
deposited in GenBank (accession number: NC_005831).
sg mRNA sequences are deposited in GenBank under the
accession numbers: AY697419-AY697423. The GenBank
accession number of the sequences used in this genome
analysis are: MHV (mouse hepatitis virus, strain MHV-
A59): NC_001846; HCoV-229E: NC_002645; HCoV-
OC43 strain ATCC VR-759: NC_005147; PEDV (porcine
epidemic diarrhea virus, strain CV777): AF353511; TGEV
(transmissible gastroenteritis virus, strain Purdue):
NC_002306; SARS-CoV isolate Tor2: NC_004718; IBV
(avian infectious bronchitis virus, strain Beaudette):
NC_001451; BCoV (bovine coronavirus, isolate BCoV-
ENT): NC_003045.
Competing interests
The authors declare that they have no competing interests.
Publish with BioMed Central and every
scientist can read your work free of charge
"BioMed Central will be the most significant development for
disseminating the results of biomedical research in our lifetime."
Sir Paul Nurse, Cancer Research UK
Your research papers will be:
available free of charge to the entire biomedical community
peer reviewed and published immediately upon acceptance
cited in PubMed and archived on PubMed Central
yours — you keep the copyright
Submit your manuscript here:
/>BioMedcentral
Virology Journal 2004, 1:7 />Page 11 of 11
(page number not for citation purposes)
Authors' contributions
KP carried out the viral RNA isolation, RT-PCR, sequenc-
ing of sg mRNAs, Northern blot evaluation and all com-
puter analysis done in this study; MFJ carried out the full
genome sequencing; all authors participated in writing
the manuscript. Lv/dH and BB are the principal
investigators
Acknowledgements
We thank Berend Jan Bosch and Peter Rottier for providing MHV infected
cells and Alexander Nabatov and Barbara van Schaik for technical support.
References
1. Drosten C, Gunther S, Preiser W, van der Werf S, Brodt HR, Becker
S, Rabenau H, Panning M, Kolesnikova L, Fouchier RA, Berger A, Bur-
guiere AM, Cinatl J, Eickmann M, Escriou N, Grywna K, Kramme S,
Manuguerra JC, Muller S, Rickerts V, Sturmer M, Vieth S, Klenk HD,
Osterhaus AD, Schmitz H, Doerr HW: Identification of a novel
coronavirus in patients with severe acute respiratory
syndrome. N Engl J Med 2003, 348:1967-1976.
2. Kuiken T, Fouchier RA, Schutten M, Rimmelzwaan GF, van
Amerongen G, van Riel D, Laman JD, de Jong T, van Doornum G, Lim
W, Ling AE, Chan PK, Tam JS, Zambon MC, Gopal R, Drosten C, van
der Werf S, Escriou N, Manuguerra JC, Stohr K, Peiris JS, Osterhaus
AD: Newly discovered coronavirus as the primary cause of
severe acute respiratory syndrome. Lancet 2003, 362:263-270.
3. Gibbs AJ, Gibbs MJ, Armstrong JS: The phylogeny of SARS
coronavirus. Arch Virol 2004, 149:621-624.
4. Snijder EJ, Bredenbeek PJ, Dobbe JC, Thiel V, Ziebuhr J, Poon LL,
Guan Y, Rozanov M, Spaan WJ, Gorbalenya AE: Unique and con-
served features of genome and proteome of SARS-coronavi-
rus, an early split-off from the coronavirus group 2 lineage. J
Mol Biol 2003, 331:991-1004.
5. Rota PA, Oberste MS, Monroe SS, Nix WA, Campagnoli R, Icenogle
JP, Penaranda S, Bankamp B, Maher K, Chen MH, Tong S, Tamin A,
Lowe L, Frace M, DeRisi JL, Chen Q, Wang D, Erdman DD, Peret TC,
Burns C, Ksiazek TG, Rollin PE, Sanchez A, Liffick S, Holloway B,
Limor J, McCaustland K, Olsen-Rasmussen M, Fouchier R, Gunther S,
Osterhaus AD, Drosten C, Pallansch MA, Anderson LJ, Bellini WJ:
Characterization of a novel coronavirus associated with
severe acute respiratory syndrome. Science 2003,
300:1394-1399.
6. van der Hoek L, Pyrc K, Jebbink MF, Vermeulen-Oost W, Berkhout
RJ, Wolthers KC, Wertheim-van Dillen PM, Kaandorp J, Spaargaren J,
Berkhout B: Identification of a new human coronavirus. Nat
Med 2004, 10:368-373.
7. Ksiazek TG, Erdman D, Goldsmith CS, Zaki SR, Peret T, Emery S,
Tong S, Urbani C, Comer JA, Lim W, Rollin PE, Dowell SF, Ling AE,
Humphrey CD, Shieh WJ, Guarner J, Paddock CD, Rota P, Fields B,
DeRisi J, Yang JY, Cox N, Hughes JM, LeDuc JW, Bellini WJ, Anderson
LJ: A novel coronavirus associated with severe acute respira-
tory syndrome. N Engl J Med 2003, 348:1953-1966.
8. Herold J, Siddell SG: An 'elaborated' pseudoknot is required for
high frequency frameshifting during translation of HCV 229E
polymerase mRNA. Nucleic Acids Res 1993, 21:5838-5842.
9. Giedroc DP, Theimer CA, Nixon PL: Structure, stability and
function of RNA pseudoknots involved in stimulating ribos-
omal frameshifting. J Mol Biol 2000, 298:167-185.
10. Gagneten S, Gout O, Dubois-Dalcq M, Rottier P, Rossen J, Holmes
KV: Interaction of mouse hepatitis virus (MHV) spike glyco-
protein with receptor glycoprotein MHVR is required for
infection with an MHV strain that expresses the hemaggluti-
nin-esterase glycoprotein. J Virol 1995, 69:889-895.
11. Zhang X, Hinton DR, Park S, Parra B, Liao CL, Lai MM, Stohlman SA:
Expression of hemagglutinin/esterase by a mouse hepatitis
virus coronavirus defective-interfering RNA alters viral
pathogenesis. Virology 1998, 242:170-183.
12. de Haan CA, Masters PS, Shen X, Weiss S, Rottier PJ: The group-
specific murine coronavirus genes are not essential, but their
deletion, by reverse genetics, is attenuating in the natural
host. Virology 2002, 296:177-189.
13. Sawicki SG, Sawicki DL: Coronavirus transcription: subgenomic
mouse hepatitis virus replicative intermediates function in
RNA synthesis. J Virol 1990, 64:1050-1056.
14. Sawicki SG, Sawicki DL: A new model for coronavirus
transcription. Adv Exp Med Biol 1998, 440:215-219.
15. Spaan W, Delius H, Skinner M, Armstrong J, Rottier P, Smeekens S,
van der Zeijst BA, Siddell SG: Coronavirus mRNA synthesis
involves fusion of non-contiguous sequences. EMBO J 1983,
2:1839-1844.
16. Hofmann MA, Chang RY, Ku S, Brian DA: Leader-mRNA junction
sequences are unique for each subgenomic mRNA species in
the bovine coronavirus and remain so throughout persistent
infection. Virology 1993, 196:163-171.
17. Konings DA, Bredenbeek PJ, Noten JF, Hogeweg P, Spaan WJ: Differ-
ential premature termination of transcription as a proposed
mechanism for the regulation of coronavirus gene
expression. Nucleic Acids Res 1988, 16:10849-10860.
18. Sethna PB, Hung SL, Brian DA: Coronavirus subgenomic minus-
strand RNAs and the potential for mRNA replicons. Proc Natl
Acad Sci U S A 1989, 86:5626-5630.
19. de Haan CA, van Genne L, Stoop JN, Volders H, Rottier PJ: Corona-
viruses as vectors: position dependence of foreign gene
expression. J Virol 2003, 77:11312-11323.
20. Grigoriev A: Mutational patterns correlate with genome
organization in SARS and other coronaviruses. Trends Genet
2004, 20:131-135.
21. Grigoriev A: Strand-specific compositional asymmetries in
double-stranded DNA viruses. Virus Res 1999, 60:1-19.
22. Hiscox JA, Mawditt KL, Cavanagh D, Britton P: Investigation of the
control of coronavirus subgenomic mRNA transcription by
using T7-generated negative-sense RNA transcripts. J Virol
1995, 69:6219-6227.
23. Hacker J, Kaper JB: Pathogenicity islands and the evolution of
microbes. Annu Rev Microbiol 2000, 54:641-679.
24. Sueoka N: Correlation between Base Composition of Deox-
yribonucleic Acid and Amino Acid Composition of Protein.
Proc Natl Acad Sci U S A 1961, 47:1141-1149.
25. Berkhout B, van Hemert FJ: The unusual nucleotide content of
the HIV RNA genome results in a biased amino acid compo-
sition of HIV proteins. Nucleic Acids Res 1994, 22:1705-1711.
26. van Hemert FJ, Berkhout B: The tendency of lentiviral open
reading frames to become A-rich: constraints imposed by
viral genome organization and cellular tRNA availability. J
Mol Evol 1995, 41:132-140.
27. van den Born E, Gultyaev AP, Snijder EJ: Secondary structure and
function of the 5'-proximal region of the equine arteritis
virus RNA genome. RNA 2004, 10:424-437.
28. Nakamura Y, Gojobori T, Ikemura T: Codon usage tabulated
from international DNA sequence databases: status for the
year 2000. Nucleic Acids Res 2000, 28:292.