Vehicular Technologies Increasing Connectivity Part 6 potx
Bạn đang xem bản rút gọn của tài liệu. Xem và tải ngay bản đầy đủ của tài liệu tại đây (809.55 KB, 30 trang )
our simulations, the thresholds α
l
(1 ≤ l ≤ L) are assumed equally spaced between the
minimum and the maximum values specified in modulation and coding profiles for IEEE
802.16 S-OFDMA standard (α
1
= 2.88dB and α
L
= 17.50dB). For the sake of generality,
instead of considering a number c
l
of information bits provided per carrier that depends
on the chosen modulation and coding, we assume that an user, whose SINR achieves the
threshold α
l
, transmits with the theoretical Shannon efficiency
η
l
[bit/s/Hz]=log
2
(1 + 10
α
l
/10
).(3)
If none of the thresholds is exceeded, s ub-channel i is switched off for the k-th user.
3. Fast adaptive techniques
In OFDMA systems, smart allocation of radio resources is a crucial aspect for achieving
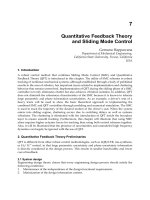
excellent performance levels. In Fig. 2 we can observe a typical structure of an OFDMA
time-frequency layer: the set of sub-carriers and symbol times is divided into resource blocks
(RB), which constitute the minimum amount of resources that can be assigned to an user
connection. In fact each user is assigned a set of RBs, generally but not necessarily contiguous
(Fig. 2(a)). The sub-carriers of the same RB are interested by the same modulation, coding
profile and power. For the sake of simplicity but without loss of generality w.r.t. the scope of
this study, we assume a resource division based on a one-dimensional approach, where a user
is assigned the same sets of sub-carriers for the entire allocation time T
UPD
(Fig. 2(b)). So a
resource block is equivalent to a sub-channel and an user can share separate sub-channels in
the same T
UPD
.
The allocation techniques require knowledge of the function reported in Equation 1 with
an updating time T
UPD
that should be shorter than the coherence time of the channel; this
constitutes the main limiting factor in mobile applications. When T
UPD
is comparable or
greater than the coherence time of the channel, the algorithm performance degrades rapidly
as the channel gain in that updating interval can experience heavy fluctuations due to the
Doppler ef fect. In order to compensate this degradation, our simulations pre-compute the
’Doppler margin’ ΔFF in Equation 2 as the channel gain variation that each sub-channel
exceeds, during an entire period T
UPD
, with a probability equal to 0.10. So ΔFF is used in
the new CSI estimate as in Equation 2. As expected, this Doppler margin depends both on
the updating time and on the channel coherence time, which is function of the mobile user
velocity v.
In the sequel, we present a study on the impact of fast closed loop power control on
interference (Sect. 3.1) and o f techniques for exploiting multi-user diversity in channel
assignments also in a mobile context (Sect. 3.2).
3.1 Closed loop power adaptation
In OFDMA systems, power adaptation is performed either in open or closed loop modalities.
It is well known that a fast closed loop mechanism plays a crucial role in CDMA cellular
systems for limiting the intra-cell interference, especially on the uplink. Here we are interested
to the impact of fast power adaptation on OFDMA systems with low reuse factors as a positive
contribution to limiting extra-cell interference. This is true for the uplink direction, as already
observed in (Schoenen & Qin (2009); Li et al. (2008); Tee et al. (2007)), but also for the downlink
side, on which we have focused our analysis. The analytical procedure presented in Sect. 5 will
take into account the multi-cell interference and it will assume ideal channel knowledge and
141
Fast Power and Channel Adaptation for Mobile Users in OFDMA Multi-Cell Scenarios
Fig. 2. Time-frequency resource organization in an OFDMA system: two-dimensional (a) and
one-dimensional scenarios.
adaptation. On the other hand, the simulations will reveal the impact of these techniques for
several levels of the updating time (w.r.t. the channel coherence) and with other impairments.
The closed loop power adaptation (CLPA) is able to adjust the power at the base station
(downlink) or at the terminal (uplink) at the level that is exactly n ecessary to achieve the
maximum profile threshold α
l
(1 ≤ l ≤ L) compatible with the power assigned to each
sub-channel P
S
= P
BS
/N
S
,beingP
BS
the total maximum BS transmission power. In CLPA
there is no allocation based on the channel state indicator but users a re assigned to available
sub-channels randomly. In practice, in our simulations, each user is assigned to N
S
/N
U
sub-channels: the selected modulation profile 0 ≤ l ≤ L is given by
l :
P
S
γ
k,i
≥ α
l
P
S
γ
k,i
< α
l+1
(4)
where α
0
= −∞,beingl = 0 associated to the absence of transmission, and α
L+1
=+∞.Then
power is adapted to the value
P
k,i
= α
l
·γ
k,i
≤ P
S
.(5)
Disequalities 4 and 5 are checked every T
UPD
seconds and either powers or modulation
profiles can be changed according to the channel variations reported by the updated
coefficients γ
k,i
.
3.2 Fast channel assignment
As mentioned in Sect. 1, smart resource allocation in OFDMA systems is usually performed
for fixed users since the assignment procedure is hardly compatible with challenging mobility
constraints. The algorithm updating time is affected by the necessity of transmitting CSI at the
base station (downlink) and by the computing time of the algorithm itself. Here we propose
a very simple approach in which the base station does not operate on the complete group of
sub-channels and users but only on small subsets. In other words, the base station does not
assign a channel to a user but subsets of N
S
/P channels to N
U
/P users with 1 ≤ P ≤ N
U
(also with small values, e.g. N
S
/P = 3 or 4) reserving one or two bits to the fast assignment
communication to the users inside each subset. This solution is a partitioning procedure into P
sets of sub-channels and P sets of users, applied to the general problem of channel assignment
142
Vehicular Technologies: Increasing Connectivity
and necessary for speeding up the process (Fig. 3). Set partitioning is fixed and, by means
of this procedure, the initial problem is reduced to a computational complexity that can be
expressed as
C
L
= P · f
C
N
S
P
,
N
U
P
<< f
C
(
N
S
, N
U
)
,(6)
with f
C
denoting a measure of the computational load of the allocation algorithm adopted in
the system.
In fact, this kind of algorithm reduction to a minimum assignment problem is the way for
allowing fast and light adaptation to the channel variations for mobile users. The numerical
results will highlight the performance trade-offs that can be obtained at several degrees of
updating time and partitioning factors. The assignment should follow the same updating
time T
UPD
of the power control in Sect. 3.1; this means that, each T
UPD
seconds, the system
reallocates the radio resources to the available users (not necessarily the same of the previous
period T
UPD
).
Fig. 3. Partitioned channel assignment for reduced complexity and increased speed.
3.3 Test-bed allocation s trategy
In (Galati et al. (2008)) it is shown that, in a fading environment, the impact of a generic
allocation strategy on SINR distribution can be described, in its dominant aspects, by a
single parameter I
D
. The use of the parameter I
D
allows us to not consider, in this study, a
particular allocation algorithm, which is not our objective here (a high number of examples
are present in the literature), but to focus our attention on the impact produced on the
network. So we investigate the overall system by using this simple parameter and by avoiding
long and useless discussions about the details of numerous solutions. In practice, when we
are interested on a particular allocation solution, we can estimate its I
D
in order to have
immediately a measure of its impact on network performance. As allocation algorithms
usually operate with many different parameters and constraints, this I
D
assignment could
require an a-posteriori estimation. In the simulations of this work and in our comparative
study, we simulate a simple allocation algorithm where we can modulate a-priori the value
of parameter I
D
from 1 to its maximum value, which is, for independent fading among the
users, equal to the number N
U
of active users in each cell (maximum order of multi-user
diversity). We r emark that this choice allows to separate the numerical results of this work
from a specific choice of resource allocation algorithms for both analysis and simulations. In
143
Fast Power and Channel Adaptation for Mobile Users in OFDMA Multi-Cell Scenarios
this test-bed algorithm, multi-user diversity of order I
D
is provided by a strategy that assigns
a sub-group of I
D
users to each sub-channel and selects, in each sub-group, the user with the
best SINR.
Another rule is introduced in the assignment of users to sub-groups, in order to give each user
the same number of chances to transmit. Given N
S
sub-channels, N
U
users and a diversity
order I
D
,withN
S
= k ∗N
U
a fair rule assigns each user to (N
S
∗ I
D
)/N
U
= k ∗ I
D
sub-groups.
The assignment slots can be structured as a matrix with N
S
rows and I
D
columns and the
assignment of slots to the users is actuated filling the matrix by rows with k repetitions of an
ordered list of the users U
1
U
N
U
, as can be seen in Fig. 4(a). In the sequel this algorithm will
be denoted as TAB
ID
. After this operation, the power per sub-channel is adjusted according
to Equation 5.
We observe that, when I
D
= 1, the algorithm corresponds to the absence of any allocation
strategy since the users are allocated to the sub-channels without SINR selections. So I
D
= 1
can be considered as the realization of the CLPA mechanism described in Sect. 3.1. Moreover,
the application of the set partitioning principle on TAB
ID
(Fig. 4(b)) highlights the main
impact that a complexity reduction procedure has on the algorithm effectiveness, i.e. a
reduction of the multi-user diversity. As can be observed in Fig. 4(b), after set partitioning,
the effective I
D
of the reduced complexity algorithm becomes
I
D,eff
= min
I
D
,
N
U
P
.(7)
Our overall framework, with the algorithm options, is sketched in Fig. 5.
Fig. 4. Allocation of groups of users to sub-channels sc
i
with TAB
ID
strategy for N
U
= 4,
N
S
= 8andI
D
= 3withP = 1 (a) and P = 2 (b). For each sub-channel, TAB
ID
will select the
user with the best SINR in the corresponding row.
4. Multi-cell analysis
In multi-cell networks, SINR levels are affected by the power reduction caused by the adaptive
techniques. In order to understand the behavior of the overall multi-cell system two different
approaches have been implemented: (i) a completely simulative one (denoted as F1), in which
the TAB
ID
algorithm runs in the simulation environment as detailed in (Reggiani et al. (2007))
and (ii) an iterative analytical approach denoted as F2 and already presented in (Galati et al.
144
Vehicular Technologies: Increasing Connectivity
Fig. 5. Overview of the allocation options used for the numerical results.
(2008)), which reproduces the algorithm effect on SINR distribution by means of I
D
,computes
the power reduction and recursively applies it to the power of interfering BSs. In other
words, F2 reproduces successive applications (over consecutive T
UPD
) of a generic allocation
algorithm until the system has achieved its stationary interference and SINR levels. In this
work, numerical results will be focused on the final spectral efficiency for different algorithm
parameters (P in Sect. 3.2, updating time), channels and user velocity (Sec. 2). The analysis is
characterized by the following assumptions:
• All the active users are at distance d from the six reference BS and at distance D from six
interfering BSs and no shadowing is present.
• Identically independent distributed (i.i.d.) fading A
n
is applied on the generic n − th link
(n
= 0 for the reference link, n = 1, , 6 for interfering links) with a probability density
function f
A
n
(x)= f
A
(x).
• At the first iteration (i
= 0), the transmitted power per sub-channel in all BSs is fixed to a
nominal value P
TX
(0)=P
S
= P
BS
/N
S
.
•Ati
−th iteration, the power reduction ρ(i), which results from Equation 5 and is described
by its probability density function f
ρ(i)
(x), is computed and applied to the nominal value
P
S
in all the co-channel BSs, modifying their transmission power P
TX
(i).
• Channel fading is assumed non-ergodic, constant in each user transmission block.
Fig. 6. Block diagram of the recursive loop for the analytical procedure F2.
So, in this scenario, at i
−th iteration, the SINR value γ
in
(i) is computed in model F2as
γ
in
(i)=
S
I(i)+N
=
P
S
· PL
0
· A
0
∑
6
n
=1
P
TX,n
(i) · PL
n
· A
n
+ N
(8)
145
Fast Power and Channel Adaptation for Mobile Users in OFDMA Multi-Cell Scenarios
where N, i.e. the additive white Gaussian noise power, PL
0
and PL
n
, i.e. the path loss
of the reference and interfering links, are deterministic parameters, while the fading A
0
,
A
n
and the transmission power P
TX,n
(i) in the n−th BS co-channel are statistical variables
with probability density functions f
A
(x) and f
P
TX
(x) respectively. The term I(i) denotes the
interference at the i
−th iteration step. The functional block diagram of the recursive system
is shown in F ig. 6: the distribution of γ
in
(i) is computed in block B and it is processed in
block C through the parameter I
D
, producing the cumulative distribution function of γ
out
(i)
as F
γ
out
(x)=[F
γ
in
(x)]
I
D
,withF
γ
(z)=
z
−∞
f
γ
(x)dx. The distribution of γ
out
(i) goes into block
D that computes the distribution of power gain ρ
(i) (i.e. the power adaptation). Finally block
A closes the loop, receiving the power gain distribution f
ρ(i)
(x) and applying it to nominal
transmission power P
S
of the interfering BSs. The distribution of the updated power P
TX
(i) is
used for the new distribution γ
in
(i + 1) in the next iteration. If the initial distribution f
γ
in
(x)
cannot be derived analytically, it is obtained by simulation (F1) at the first iteration and then
it is processed by F2 to produce final distributions f
γ
out
(x).
5. Numerical results
Simulations have been performed in different configuration scenarios, mobile users a t a fixed
distance d
FIX
from the BS, at different distances d from the BS, in the downlink or in the
uplink. However some common parameters are adopted in the simulations: each BS is set
to a nominal power equal to P
BS
= 35 dBm, the number of users is fixed to N
U
= 12
and the number of available sub-channels is equal to N
S
= 48. Moreover a set of 6 SINR
thresholds α
l
is defined among a minimum value α
1
= 2.88 dB and a maximum α
L
= 17.50
dB. Channel fading is modelled by Veh
− A power delay profile for users’ velocities from
v
= 0km/htov = 60 km/h, while two d ifferent pedestrian models (Ped − A and Ped − B)
are used from 0 to 20 km/h. The system performance is computed and analyzed in terms of
achievable spectral efficiency η
out
at different mobile terminals velocities, different updating
times (T
UPD
=[5, 10, 20, 40] ms), in presence or not of smart radio allocation techniques and
Closed Loop Power Adaptation (CLPA). The maximum spectral efficiency in the analyzed
system is equal to max
(η
out
)=10log
2
(1 + 10
(α
L
/10)
)=5.839 [bit/s/Hz].
Figs. 7-11 have been obtained in the downlink configuration. In Figs. 7-8, we show the
validity of the the analytical model F2 introduced in Sect. 4 w.r.t. the results obtained with
intensive simulation (F1). Performance is shown in terms of the spectral efficiency η
out
that
can be achieved using different fading models, Ped
− A and Ped − B respectively, at different
velocities of the mobile terminals (from v
= 0tov = 15 km/h) and when the updating
time of the allocation strategies is progressively increased, i.e. producing a new allocation
configuration each T
UPD
=[5, 10, 20,40] ms. In fact, T
UPD
= 5 ms means that the allocation
algorithm is able to take decisions in each OFDMA frame (in IEEE 802.16 standard each
frame h as a duration equal to 5 ms) and to distribute the available resources according to
the channel state conditions (sub-channels, modulation profile and power) among the active
users. Here we apply I
D
= N
U
= 12, that corresponds to the configuration that is able to
exploit the highest multi-user diversity order, in order to produce the maximum performance.
As we can see in Fig. 7 spectral efficiency estimated by means of the F2 procedure, whose
results are shown with continuous lines, fits very well the values computed by means of
intensive simulations F1, whose results are reported with filled markers. We can notice that
η
out
progressively decreases when T
UPD
increases as the allocation strategy loses its ability
to react to the time-varying channel conditions, especially when the updating time is higher.
146
Vehicular Technologies: Increasing Connectivity
Similar considerations can be done for Fig. 8, which has been derived using pedestrian channel
model Ped
− B.
0 5 10 15
0
1
2
3
4
5
6
Mobile terminals speed [km/h]
η [bit/s/Hz]
η
out
(T
UPD
=5ms)
η
out
(T
UPD
=10ms)
η
out
(T
UPD
=20ms)
η
out
(T
UPD
=40ms)
MAX(η
out
)
Fig. 7. Spectral efficiency (η
out
) as a function of user velocity v [km/h] with fast fading
defined by pedestrian channel model Ped
− A. Results are obtained with the analytical
approach F2 (continuous lines) and compared to performance computed with intensive
simulations F1 (filled markers).
Figs. 9-11 show results that are similar to those reported in Figs. 7-8 since we highlight the
achievable spectral efficiency as a function of terminals velocity and algorithm updating time.
However we want to stress the advantages of smart dynamic resource allocation algorithms
(I
D
= N
U
= 12) over a simple mechanism of power adaptation, r eferred as CLPA in Sect. 3.1,
which corresponds to the absence of any allocation strategies (diversity order parameter I
D
=
1). In order to have a complete comparison, we draw also the achievable spectral efficiency
values when sub-channels are assigned randomly and power adaptation mechanism is not
applied. This represents the worst case with I
D
= 1 (so absence of allocation strategy) and
transmission power applied to each sub-channel always fixed to the maximum available value
P
S
= P
BS
/N
S
; it is clear the advantage provided by CLPA and particularly by even simple
allocation strategies. In Fig. 9, we can observe the performance obtained with a Veh
− A fading
modelandatseveralvelocities,fromv
= 0tov = 60 km/h. It is clear how with v > 20 − 30
km/h, forming sub-channels from contiguous sub-carriers, as in the AMC configuration, is not
able to react effectively to the severe channel conditions; in these cases, interference averaging
strategies like mechanisms of channel permutation are more advantageous solutions (e.g.
the PUSC or FUSC configurations in IEEE 802.16 standard). In fact, at high speeds, even the
adoption of advanced smart allocation solutions is not effective. However, if we consider slow
mobile terminals movements with average velocity within v
= 15 km/h, we can notice that
we achieve a considerable gain over the simple CLPA strategy when we apply radio resource
allocation algorithms. For pedestrian users, Fig. 1 0 and Fig. 11 highlight the value of η
out
in the
presence of Ped
− A and Ped − B power delay profiles respectively. We can notice that, with
147
Fast Power and Channel Adaptation for Mobile Users in OFDMA Multi-Cell Scenarios
0 5 10 15
0
1
2
3
4
5
6
Mobile terminals speed [km/h]
η [bit/s/Hz]
η
out
(T
UPD
=5ms)
η
out
(T
UPD
=10ms)
η
out
(T
UPD
=20ms)
η
out
(T
UPD
=40ms)
MAX(η
out
)
Fig. 8. Spectral efficiency (η
out
) as a function of variable mobile terminals speed v [km/h]
with fast fading defined by pedestrian channel model Ped
− B. Results are obtained with the
analytical approach F2 (continuous lines) and compared to performance computed with
intensive simulations F1 (filled markers).
T
UPD
= 40 ms and speed v > 5 km/h, the additional complexity introduced by the smart
allocation strategy makes no sense as we can obtain the same performance with the simple
CLPA or even random allocation with no power adaptation at all. In fact, the updating rate
1/T
UPD
has to be faster for making the algorithm react to the rapidly changing conditions
of the wireless channel. Nevertheless, with updating time T
UPD
< 10 ms (corresponding to
a new resource allocation each two OFDM frames in IEEE 802.16 standard), we can see that
smart algorithms are strongly recommended for a chieving a satisfactory transmission rate up
to velocities around 5 km/h.
Although radio resource allocation solutions have demonstrated their ability to increase
the spectral efficiency of mobile users, it has still to be considered their impact on the
computational complexity. In other words, it should be evaluated the level of complexity that
can be supported by the processing units, giving rise to the trade-off between performance and
sustainable computational complexity. In Figs. 12 and 13 we point out the relation between
computational complexity and performance by using performance evaluations expressed as a
function of the partitioning factor P. Curves with constant spectral efficiency (η
out
= 1, 2, 3, 4, 5
[bit/s/Hz]) are depicted as a function of the partitioning factor of sub-channels and users
( P), velocity and updating time. We can notice that the best value η
out
= 5 can be achieved
only if we adopt the algorithm at the maximum complexity (P
= 1) and with fixed users
(v
= 0 km/h). In general, a high level of complexity corresponds to higher levels o f η
out
even with mobile users. However, we observe also that a complexity reduction might allow
a faster updating time, w hich always guarantees higher performance. So, in these figures,
we can appreciate the overall trade-off among computational complexity, expressed by the
partitioning factor P, updating time and achievable η
out
. This kind of simulation or analysis
148
Vehicular Technologies: Increasing Connectivity
0 10 20 30 40 50 60
0
1
2
3
4
5
6
Mobile terminals speed [km/h]
η [bit/s/Hz]
η
out
(T
UPD
=5ms)
η
out
(T
UPD
=10ms)
η
out
(T
UPD
=20ms)
η
out
(T
UPD
=40ms)
MAX(η
out
)
Fig. 9. Spectral efficiency (η
out
) as a function of users velocity (v) and updating time (T
UPD
)
with vehicular channel model Veh
− A. Performance of radio resource allocation algorithm
with I
D
= N
U
(continuous lines ’–’), simple CLPA with I
D
= 1 (dashed lines ’- -’), and
random allocation without any power adaptation (dotted lines ’ ’) are compared.
0 5 10 15
0
1
2
3
4
5
6
Mobile terminals speed [km/h]
η [bit/s/Hz]
η
out
(T
UPD
=5ms)
η
out
(T
UPD
=10ms)
η
out
(T
UPD
=20ms)
η
out
(T
UPD
=40ms)
MAX(η
out
)
Fig. 10. Spectral efficiency (η
out
) as a function of users velocity (v) and updating time (T
UPD
)
with pedestrian channel model Ped
− A. Performance of radio resource allocation algorithm
with I
D
= N
U
(continuous lines ’–’), simple CLPA with I
D
= 1 (dashed lines ’- -’), and
random allocation without any power adaptation (dotted lines ’ ’) are compared.
149
Fast Power and Channel Adaptation for Mobile Users in OFDMA Multi-Cell Scenarios
0 5 10 15
0
1
2
3
4
5
6
Mobile terminals speed [km/h]
η [bit/s/Hz]
η
out
(T
UPD
=5ms)
η
out
(T
UPD
=10ms)
η
out
(T
UPD
=20ms)
η
out
(T
UPD
=40ms)
MAX(η
out
)
Fig. 11. Spectral efficiency (η
out
) as a function of users velocity (v) and updating time (T
UPD
)
with pedestrian channel model Ped
−B. Performance of radio resource allocation algorithm
with I
D
= N
U
(continuous lines ’–’), simple CLPA with I
D
= 1 (dashed lines ’- -’), and
random allocation without any power adaptation (dotted lines ’ ’) are compared.
reveals the possible design choices that can be adopted in a multi-cellular system, according
to the system updating or response time and to the BS processing power.
2 4 6 8 10 12
0
2
4
6
8
10
12
14
16
18
20
Sub channels partitioning (P)
Mobile terminals speed [km/h]
η
out
=5
η
out
=4
η
out
=3
η
out
=2
η
out
=1
Fig. 12. Curves at fixed η
out
as a function of user velocity (v), partitioning factor (P)and
updating time T
UPD
= 5 ms (continuous line ’–’) and T
UPD
= 10 ms (dashed line ’- -’) in the
presence of pedestrian channel model Ped
− A.
150
Vehicular Technologies: Increasing Connectivity
2 4 6 8 10 12
0
2
4
6
8
10
12
14
16
18
20
Sub channels partitioning (P)
Mobile terminals speed [km/h]
η
out
=5
η
out
=4
η
out
=3
η
out
=2
η
out
=1
Fig. 13. Curves at fixed η
out
as a function of user velocity (v), partitioning factor (P)and
updating time T
UPD
= 5 ms (continuous line ’–’) and T
UPD
= 10 ms (dashed line ’- -’) in the
presence of pedestrian channel modelPed
− B.
When mobile users are at different and varying distances d from the BSs, the numerical
findings confirm the same performance behavior described below. Also uplink simulations
show similar results even if with lower values of η
out
.
6. Conclusions
In the chapter, we have investigated the impact of allocation strategies on multi-cell networks
with mobile users. The power reduction that can be achieved by means of the multi-user
diversity exploitation has a beneficial impact on the overall network interference with a
successive improvement of spectral efficiency. This positive effect is present, even if clearly
reduced, also when only an ef ficient power adaptation loop, without smart allocation,
is implemented in the network. On the other hand, it is shown how the users velocity
has a strong impact on the updating time that is necessary for maintaining a satisfactory
performance. This trade-off is completed by the algorithm complexity, which is another
fundamental parameter that affects the updating ability of the system. In this context, a set
partitioning technique is presented as a step for reducing the complexity order of smart
allocation towards very fast algorithms that are compatible with low updating times.
7. References
Knop, R. & Humbl et, P. (1995). Information Capacity and Power Control in Single-cell
Multiuser Communications. Proceedings of IEEE ICC 1995, June 1995, Seattle (WA,
USA)
Galati Giordano, L. & Reggiani, L. & Dossi, L. (2010). Radio Resource Management for
New Generation Wireless Networks: Smart Allocation Techniques and Interference
Evaluation. VDM Verlag Dr. Müller, ISBN 978-3-639-26548-4, 112 pages, June 2010
151
Fast Power and Channel Adaptation for Mobile Users in OFDMA Multi-Cell Scenarios
Reggiani, L. & Galati Giordano, L. & Dossi, L. (2007). Multi-User Sub-Channel, Bit and Power
Allocation In IEEE 802.16 systems. Proceedings of IEEE VTC-2007 Spring, April 2007
Galati Giordano, L. & Reggiani, L. & Dossi, L. (2008). Interferente Evaluation in Multi-Cell
Environment with Resource Allocation Algorithms. Proceedings of IEEE VTC-2008
Spring, May 2008
IEEE Std 802.16-2004. IEEE Standard for Local and Metropolitan Area Networks: Air Interface for
Fixed Broadband Wireless Access Systems, October 2004
IEEE Std 802.16e-2005 & IEEE Std 802.16-2004/Cor1-2005. IEEE Standard for Local and
Metropolitan Area Networks IEEE: Air Interface for Fixed and Mobile Broadband Wireless
Access Systems and Corrigendum 1, February 2006
3GPP TR 25.996. Universal Mobile Telecommunication System (UMTS): Spatial Channel Model for
Multiple Input Multiple Output (MIMO) Simulations, Release 6, September 2003
ETSI TR 101 112 (1998-04). Selection Procedures for the Choice of Radio Transmission Technologies of
the UMTS
˝
U Annex B: Test Environments and deployment models, UMTS 30.03, version
3.2.0, 1998
Schoenen, R. & Qin, F. (2009). Adaptive Power Control for 4G OFDMA systems on Frequency
Selective Fading Channels. Proceedings of WiCOM 2009, March 2009
Li, Z. & Wang, Y. & Yang, D. (2008). A Novel Power Control Scheme in OFDMA U plink.
Proceedings of ICSP 2008, May 2008, Leipzig (Germany)
Tee, L.K. & van Rensburg, C. & Tsai, J A. (2007). Uplink Power Control for an OFDMA Mobile
Cellular System. Proceedings of IEEE VTC-2007 Fall, September 2007, Baltimore (MD,
USA)
152
Vehicular Technologies: Increasing Connectivity
1. Introduction
The design and analysis of cascaded fading models has been an active area of research in
recent years due to its applications in numerous real world scenarios such as keyhole channels
(Salo et al., 2006; Zlatanov et al., 2008), and multihop communication systems (Andersen,
2002; Karagiannidis et al., 2007; Talha & Pätzold, 2007; Velkov et al., 2009). It is shown in
(Chizhik et al., 2002; Ercerg et al., 1997) that in the presence of a keyhole, the fading between
each transmit and receive antenna pair in a multi-input multi-output (MIMO) system can be
characterized using a double
1
Rayleigh process. Afterwards, this model has been extended to
the double Nakagami-m fading model in (Shin & Lee, 2004). In (Salo et al., 2006), the authors
have listed a few real world scenarios which give rise to the keyhole effect. Two such scenarios
include diffraction through the street edges in urban microcellular environments (Ercerg et al.,
1997) and traversal of the propagation paths through a narrow space for the case when the
distance between the rings of scatterers around the transmitter and receiver is large (Gesbert
et al., 2002).
Multihop communication systems on the other hand fall under the category of cooperative
diversity techniques (Laneman et al., 2004; Sendonaris et al., 2003). In such systems, the
wireless nodes (in a cooperative network) assist each other by relaying the information from
the source mobile station (SMS) to the destination mobile station (DMS), hence improving
the network coverage quite significantly. If however, the wireless nodes are assumed to be
moving with relatively high speed, the concept of multihop communication can be applied
to vehicle-to-vehicle (V2V) communication systems, where the source vehicle (SV) or the
traffic control center (TCS) communicates with a destination vehicle (DV) via relay vehicles
(RV). Figure 1 depicts these two scenarios for the case of dualhop communication, where the
information from the TCS (or the SV) is received at the DV via an RV. V2V communication
has received a lot of attention in recent years due to its applications in traffic safety and road
traffic flow (Gradinescu et al., 2007). The statistical analysis of the received signal envelope
under non-line-of-sight (NLOS) propagation conditions in an amplify-and-forward based
1
Throughout this chapter, we will refer to a double process as the product of two independent but not
necessarily identical processes.
Gulzaib Rafiq
1
, Bjørn Olav Hogstad
2
and Matthias Pätzold
3
1,3
University of Agder
2
University of Navarra
1,3
Norway
2
Spain
Statistical Properties of the Capacity of Double
Nakagami-m Channels for Applications in V2V
Dualhop Communication Systems
9
dualhop communication system can be found in (Patel et al., 2006), where the overall channel
between the transmitter and the receiver is modeled using a double Rayleigh process. This
model is then extended to the double Rice channel model in (Talha & Pätzold, 2007), by
taking the line-of-sight propagation conditions into account. The statistical properties of the
capacity of double Rice channels have been analyzed in (Rafiq & Pätzold, 2008). However,
the Nakagami-m process is considered to be a more general channel model as compared
to the Rice and Rayleigh channel models. Hence, to generalize all the aforementioned
works in the regime of multihop communication, the authors of (Karagiannidis et al., 2007)
have presented the statistical analysis of the N
∗Nakagami-m model (i.e., a product of N
Nakagami-m processes). Moreover, second order statistics for the double Nakagami-m process
can be found in (Zlatanov et al., 2008). Though a lot of papers have been published in the
literature employing the cascaded fading channel model, the statistical properties of the
capacity of double Nakagami-m channels have not been investigated so far. Such channels
find applications both in V2V communication systems employing dualhop communication,
and keyhole channels (Zlatanov et al., 2008).
In this chapter
2
, we have studied the statistical properties of the capacity of double
Nakagami-m channels. Specifically, the influence of the severity of fading on the statistical
properties of the capacity of double Nakagami-m channels is analyzed. We have derived exact
analytical expressions for the probability density function (PDF), the cumulative distribution
function (CDF), the level-crossing rate (LCR), and the average duration of fades (ADF) of the
channel capacity. Here, the LCR and ADF of the channel capacity are important characteristic
quantities which provide insight into the temporal behavior of the channel capacity (Giorgetti
et al., 2003), (Hogstad & Pätzold, 2004). Our analysis has revealed that if the fading severity
in one or both links of double Nakagami-m channels decreases (i.e., increasing the value of
the severity parameter m in one or both of the cascaded Nakagami-m processes), the mean
channel capacity increases, while the ADF of the channel capacity decreases. Moreover, this
effect results in an increase in the LCR of the channel capacity at lower signal levels.
2. The double Nakagami-m channel model
In this chapter, we have considered Scenario 2 in Fig. 1, where the channel between the SV and
the DV via an RV is represented as a concatenation of the SV-RV and RV-DV channels (Patel
et al., 2006; Talha & Pätzold, 2007). Moreover, we have assumed that the fading in the SV-RV
link and the RV-DV link is characterized by Nakagami-m processes denoted by χ
1
(t) and
χ
2
(t), respectively. Hence, the overall fading channel describing the SV-DV link is modelled
by a double Nakagami-m process given by (Kovacs et al., 2002; Zlatanov et al., 2008)
Ξ
(t)=A
RV
χ
1
(t)χ
2
(t) (1)
where A
RV
is a real positive constant representing the relay gain. The PDF p
χ
i
(z) of the
Nakagami-m process χ
i
(t)(i = 1, 2) is given by (Nakagami, 1960)
p
χ
i
(z)=
2m
m
i
i
z
2m
i
−1
Γ(m
i
)Ω
m
i
i
e
−
m
i
z
2
Ω
i
, z ≥ 0(2)
2
The material in this chapter is based on “Statistical Properties of the Capacity of Double Nakagami-m
Channels”, by Gulzaib Rafiq, Bjørn Olav Hogstad and Matthias Pätzold which appeared in the
proceedings of 5th IEEE International Symposium on Wireless Pervasive Computing, ISWPC 2010,
Modena, Italy, May 2010. © 2010 IEEE.
154
Vehicular Technologies: Increasing Connectivity
Fig. 1. The propagation scenarios describing double Nakagami-m fading channels.
where Ω
i
= E
χ
2
i
(t)
, m
i
= Ω
2
i
Var
χ
2
i
(t)
,andΓ
(
·
)
represents the gamma function
(Gradshteyn & Ryzhik, 2000). The parameter m
i
controls the severity of the fading. Increasing
the value of m
i
, decreases the severity of fading and vice versa.
The PDF of double Nakagami-m processes Ξ
(t) is given by (Karagiannidis et al., 2007)
p
Ξ
(z)=
4z
m
1
+m
2
−1
2
∏
i=1
Γ
(
m
i
)
´
Ω
i
m
i
(m
1
+m
2
)
/2
K
m
1
−m
2
2z
2
∏
i=1
m
i
´
Ω
i
, z
≥ 0(3)
where
´
Ω
1
= A
2
RV
Ω
1
,
´
Ω
2
= Ω
2
,andK
n
(·) denotes the modified Bessel function of the second
kind of order n (Gradshteyn & Ryzhik, 2000, Eq. (8.432/1)). In order to derive the expressions
for the PDF, CDF, LCR, and ADF of the capacity of double Nakagami-m channels, we need
the joint PDF p
Ξ
2
˙
Ξ
2
(z,
˙
z) of the squared process Ξ
2
(t) and its time derivative
˙
Ξ
2
(t),aswellas
155
Statistical Properties of the Capacity of
Double Nakagami-m Channels for Applications in V2V Dualhop Communication Systems
the PDF p
Ξ
2
(z) of Ξ
2
(t). The joint PDF p
Ξ
2
˙
Ξ
2
(z,
˙
z) can be found by following the procedure
presented in (Zlatanov et al., 2008) for the joint PDF p
Ξ
˙
Ξ
(z,
˙
z) and then by using the concept
of transformation of random variables (Papoulis & Pillai, 2002, Eq. (7-8)), which results in
p
Ξ
2
˙
Ξ
2
(z,
˙
z)=
1
4z
p
Ξ
˙
Ξ
(
√
z,
˙
z
2
√
z
)
=
z
m
2
−3/2
√
2π
2
∏
i=1
m
m
i
i
´
Ω
i
m
i
Γ
(
m
i
)
∞
0
x
2m
1
−2m
2
−1
zβ
1
x
2
+ x
2
β
2
e
−
zm
2
x
2
´
Ω
2
e
−
⎛
⎝
˙
z
2
8z
zβ
1
x
2
+x
2
β
2
+
x
2
m
1
´
Ω
1
⎞
⎠
dx,
z
≥ 0,
|
˙
z
|
<
∞ (4)
where
β
1
=
´
Ω
1
π
2
m
1
f
2
max
1
+ f
2
max
2
(5a)
and
β
2
=
´
Ω
2
π
2
m
2
f
2
max
2
+ f
2
max
3
.(5b)
Here, f
max
1
, f
max
2
,and f
max
3
represent the maximum Doppler frequencies of the SV, RV, and
DV, respectively. The expression for the PDF p
Ξ
2
(z) can be obtained by integrating the joint
PDF p
Ξ
2
˙
Ξ
2
(z,
˙
z) over
˙
z. Alternatively, the PDF p
Ξ
2
(z) can also be found from the PDF p
Ξ
(z) in
(3) as follows
p
Ξ
2
(z)=
1
2
√
z
p
Ξ
(
√
z)
=
2z
m
1
+m
2
−2
2
2
∏
i=1
Γ
(
m
i
)
´
Ω
i
m
i
(m
1
+m
2
)
/2
K
m
1
−m
2
2
√
z
2
∏
i=1
m
i
´
Ω
i
, z
≥ 0. (6)
The expressions presented in (4) and (6) will be used in the next section to calculate the PDF
and LCR of the channel capacity.
3. Statistical properties of the capacity of double Nakagami-m channels
The instantaneous capacity C(t) of double Nakagami-m channels is defined as (Nabar et al.,
2004)
C
(t)=
1
2
log
2
1
+ γ
s
|
Ξ(t)
|
2
=
1
2
log
2
1
+ γ
s
Ξ
2
(t)
(bits/s/Hz) (7)
where γ
s
denotes the average received signal-to-noise ratio (SNR) at the DV. The factor 1
/
2
in (7) is due to the fact that the RV in Fig. 1 operates in a half-duplex mode, and hence the
signal transmitted from the SV is received at the DV in two time slots. Equation (7) can be
considered as a mapping of a random process Ξ
(t) to another random process C(t).Hence,
the expressions for the statistical properties of the channel capacity C
(t) can be found by using
the results for the statistical properties of the process Ξ
(t) obtained in the previous section. The
PDF p
C
(r) of the channel capacity C(t) can be found in closed form with the help of the PDF
156
Vehicular Technologies: Increasing Connectivity
p
Ξ
2
(z) and by applying the concept of transformation of random variables (Papoulis & Pillai,
2002, Eq. (7-8)) as
p
C
(r)=
2
2r+1
ln(2)
γ
s
p
Ξ
2
2
2r
−1
γ
s
=
2
2r+2
ln(2)
2
2r
−1
γ
s
(
m
1
+m
2
)
/2
(
2
r
−1
)
2
∏
i=1
Γ
(
m
i
)
´
Ω
i
m
i
(
m
1
+m
2
)
/2
K
m
1
−m
2
⎛
⎝
2
2
2r
−1
γ
s
2
∏
i=1
m
i
´
Ω
i
⎞
⎠
, r
≥ 0. (8)
The CDF F
C
(r) of the channel capacity C(t) can now be derived by integrating the PDF p
C
(r)
and by making the use of relationships in (Gradshteyn & Ryzhik, 2000, Eq. (9.34/3)) and
(Adamchik & Marichev, 1990, Eq. (26)) as
F
C
(r)=
r
0
p
C
(x)dx
=
1
2
∏
i=1
Γ
(
m
i
)
G
2,1
1,3
2
2r
−1
γ
s
2
∏
i=1
m
i
´
Ω
i
1
m
1
, m
2
,0
, r
≥ 0(9)
where G
[·] denotes the Meijer’s G-function (Gradshteyn & Ryzhik, 2000, Eq. (9.301)). The LCR
N
C
(r) of the channel capacity describes the average rate of up-crossings (or down-crossings)
of the capacity through a certain threshold level r.InordertofindtheLCRN
C
(r), we first need
to find the joint PDF p
C
˙
C
(z,
˙
z) of C(t) and its time derivative
˙
C(t). The joint PDF p
C
˙
C
(z,
˙
z) can
be obtained by using the joint PDF p
Ξ
2
˙
Ξ
2
(z,
˙
z) given in (4) as
p
C
˙
C
(z,
˙
z)=
2
2z+1
ln(2)
γ
s
2
p
Ξ
2
˙
Ξ
2
2
2z
−1
γ
s
,
2
˙
z ln
(2)
γ
s
2
2z
=
2
2z+1
ln(2)
2
2
2z
−1
m
2
−
3
2
√
2πγ
s
γ
m
2
s
2
∏
i=1
´
Ω
i
m
i
m
i
Γ
(
m
i
)
∞
0
x
2m
1
−2m
2
−1
(
2
2z
−1
)
β
1
γ
s
x
2
+ x
2
β
2
e
−
(
2
2z
+1
ln
(2)
˙
z
)
2
8γ
s
(
2
2z
−1
)
(
2
2z
−1
)
β
1
γ
s
x
2
+x
2
β
2
×e
−
x
2
m
1
´
Ω
1
+
(
2
2z
−1
)
m
2
γ
s
x
2
´
Ω
2
dx (10)
for z
≥ 0and
|
˙
z
|
<
∞. Finally, the LCR N
C
(r) can be found as follows
N
C
(r)=
∞
0
˙
zp
C
˙
C
(r,
˙
z)d
˙
z
=
8
π
2
2r
−1
γ
s
m
2
−
1
2
2
∏
i=1
m
m
i
i
´
Ω
i
m
i
Γ
(
m
i
)
∞
0
e
−
(
2
2r
−1
)
m
2
γ
s
x
2
´
Ω
2
(
2
2r
−1
)
β
1
γ
s
x
2
+ x
2
β
2
x
1+2m
2
−2m
1
e
−
x
2
m
1
´
Ω
1
dx (11)
for r
≥ 0. The ADF T
C
(r) of the channel capacity C(t) denotes the average duration of time
over which the capacity is below a given level r (Hogstad & Pätzold, 2004; 2007). The ADF
157
Statistical Properties of the Capacity of
Double Nakagami-m Channels for Applications in V2V Dualhop Communication Systems
T
C
(r) of the channel capacity can be expressed as (Hogstad & Pätzold, 2007)
T
C
(r)=
F
C
(r)
N
C
(r)
(12)
where F
C
(r) and N
C
(r) are given by (9) and (11), respectively.
4. Statistical properties of the capacity of double rayleigh channels
The double Rayleigh channel follows as a special case of the double Nakagami-m channel
when m
i
= 1 (i = 1, 2).Hence,bylettingm
i
= 1 (i = 1, 2) in (8), (9), and (11), the PDF, CDF,
and LCR of the capacity of double Rayleigh channels can be expressed as
p
C
(r)
m
i
=1
=
2
2r
ln(2)
γ
s
σ
2
2
σ
2
RV
K
0
2
2r
−1
γ
s
σ
2
2
σ
2
RV
, r
≥ 0 (13)
F
C
(r)
m
i
=1
= 1 −
2
2r
−1
γ
s
σ
2
2
σ
2
RV
K
1
2
2r
−1
γ
s
σ
2
2
σ
2
RV
, r
≥ 0 (14)
and
N
C
(r)
m
i
=1
=
√
2
2r
−1
√
2πγ
s
σ
2
2
σ
2
RV
∞
0
β
2
+ β
1
2
r
−1
x
4
γ
s
e
−
2
2r
−1
2σ
2
2
γ
s
x
2
e
−
x
2
2σ
2
RV
dy, r ≥ 0 (15)
respectively. The ADF of the capacity C
(t) of double Rayleigh channels can be found using
(12), (14), and (15). In (13)–(15), σ
2
RV
= A
2
RV
σ
2
1
and σ
2
i
(i = 1, 2) represent the variances of the
underlying Gaussian processes in the corresponding Rayleigh processes χ
i
(t)
m
i
=1
(i = 1, 2).
5. Numerical results
In this section, we will discuss the analytical results obtained in the previous section. The
validity of the theoretical results is confirmed with the help of simulations. For comparison
purposes, we have also shown the results for double Rayleigh channels, which represent a
special case of double Nakagami-m channels. In order to generate Nakagami-m processes
χ
i
(t), we have used the following relationship (Yacoub et al., 1999)
χ
i
(t)=
2×m
i
∑
l=1
μ
2
i,l
(t) (16)
where μ
i,l
(t)
(
l = 1, 2, ,2m
i
; i = 1, 2
)
are the underlying independent and identically
distributed (i.i.d.) Gaussian processes, and m
i
is the parameter of the Nakagami-m distribution
associated with the ith link of the dualhop communication systems. The Gaussian processes
μ
i,l
(t),eachwithzeromeanandvariancesσ
2
0
, were simulated using the sum-of-sinusoids
model (Pätzold, 2002). The model parameters were computed using the generalized method
of exact Doppler spread (GMEDS
1
) (Pätzold et al., 2009). The number of sinusoids for the
generation of Gaussian processes μ
i,l
(t) was chosen to be N = 29. The parameter Ω
i
was
chosen to be equal to 2m
i
σ
2
0
. Unless stated otherwise, the values of the maximum Doppler
frequencies f
max
1
, f
max
2
,and f
max
3
were taken to be 0, 91, and 125 Hz, respectively. The SNR
158
Vehicular Technologies: Increasing Connectivity
γ
s
was set to 15 dB. The parameters A
RV
and σ
0
were chosen to be unity. Finally, using (16), (1),
and (7), the simulation results for the statistical properties of the channel capacity were found.
The PDF and CDF of the channel capacity of double Nakagami-m channels are presented
in Figs. 2 and 3, respectively. Both figures illustrate the fact that increasing the value of the
severity parameter m
i
(i.e., a decrease in the level of the severity of fading) in one or both
links of the double Nakagami-m channels results in an increase in the mean channel capacity.
This result is specifically presented in Fig. 4, where the mean channel capacity is studied for
different values of the severity parameter m
i
(i = 1, 2). It can also be seen that double Rayleigh
channels (m
i
= 1; i = 1, 2) have a lower mean channel capacity as compared to the mean
channel capacity of double Nakagami-m channels (m
i
= 2; i = 1, 2). Moreover, it can also be
observed from Figs. 2 and 3 that increasing the value of the severity parameter m
i
decreases
the variance of the channel capacity.
Fig. 2. The PDF p
C
(r) of the capacity of double Nakagami-m channels.
Figure 5 presents the LCR N
C
(r) of the capacity C(t) of double Nakagami-m channels. It is
observed that an increase in the level of severity of fading in one or both links of double
Nakagami-m channels increases the LCR N
C
(r) of the channel capacity at low levels r.Hence,
at low levels r,theLCRN
C
(r) of the capacity of double Rayleigh channels (m
i
= 1; i = 1, 2) is
higher as compared to that of double Nakagami-m channels (m
i
= 2; i = 1, 2). However, the
converse statement is true for higher levels r. The ADF of the capacity of double Nakagami-m
channels is shown in Fig. 6. It is evident from this figure that the ADF of the capacity decreases
with an increase in the value of the severity parameter m
i
(i = 1, 2).
Figures 7 and 8 study the influence of the maximum Doppler frequencies of the RV and the
DV on the LCR and ADF of the channel capacity. It can clearly be observed in Figs. 7 and 8 that
the LCR and ADF are strongly dependent on the Doppler frequencies of the RV and the DV.
This means that the mobility of the RV and the DV has a significant influence on the LCR and
ADF of the channel capacity. It is observed that increasing the maximum Doppler frequencies
159
Statistical Properties of the Capacity of
Double Nakagami-m Channels for Applications in V2V Dualhop Communication Systems
Fig. 3. The CDF F
C
(r) of the capacity of double Nakagami-m channels.
Fig. 4. The mean channel capacity of double Nakagami-m channels for different levels of
fading severity.
f
max
2
and f
max
3
results in a significant increase in the LCR. However, the ADF decreases by
increasing the maximum Doppler frequencies of the RV and the DV.
6. Conclusion
This Chapter presents the derivation of exact analytical expressions for the statistical
properties of the capacity of double Nakagami-m channels, which finds applications in V2V
communication systems employing dualhop communication, and keyhole channels. We have
studied the influence of the severity of fading on the PDF, CDF, LCR, and ADF of the channel
160
Vehicular Technologies: Increasing Connectivity
Fig. 5. The LCR N
C
(r) of the capacity of double Nakagami-m channels.
Fig. 6. The ADF T
C
(r) of the capacity of double Nakagami-m channels.
capacity. It is observed that an increase in the severity of fading in one or both links of double
Nakagami-m channels decreases the mean channel capacity, while it results in an increase in
the ADF of the channel capacity. Moreover, at lower signal levels, this effects increases the
LCR of the channel capacity. Results also show that the mobility of the RV and DV has a
significant influence on the LCR and ADF of the channel capacity. Specifically, an increase
in the maximum Doppler frequencies of the RV and DV increases the LCR, while it has
an opposite influence on the ADF of the channel capacity. The presented exact results are
validated with the help of simulations, whereby a very good fitting is observed.
161
Statistical Properties of the Capacity of
Double Nakagami-m Channels for Applications in V2V Dualhop Communication Systems
Fig. 7. The LCR N
C
(r) of the capacity of double Nakagami-m channels.
Fig. 8. The ADF T
C
(r) of the capacity of double Nakagami-m channels.
7. Acknowledgment
The contribution of G. Rafiq and Prof. M. Pätzold in this chapter was partially supported by
the Research Council of Norway (NFR) through the project 176773/S10 entitled “Optimized
Heterogeneous Multiuser MIMO Networks – OptiMO".
The contribution of Dr. B. O. Hogstad was supported in part by the Basque Government
through the MIMONET project (PC2009-27B), and by the Spanish Ministry of Science
and Innovation through the projects COSIMA (TEC2010-19545-C04-02) and COMONSENS
(CSD2008-00010).
162
Vehicular Technologies: Increasing Connectivity
8. References
Adamchik, V. S. & Marichev, O. I. (1990). The algorithm for calculating integrals of
hypergeometric type functions and its realization in REDUCE system, Proc. Int. Symp.
Symbolic and Algebraic Computation, ISSAC ’90, Tokyo, Japan, pp. 212–224.
Andersen, J. B. (2002). Statistical distributions in mobile communications using multiple
scattering, Proc. 27th URSI General Assembly, Maastricht, Netherlands.
Chizhik, D., Foschini, G. J., Gans, M. J. & Valenzuela, R. A. (2002). Keyholes, correlations,
and capacities of multielement transmit and receive antennas, IEEE Trans. Wireless
Commun. 1(2): 361–368.
Ercerg, V., Fortune, S. J., Ling, J., Rustako Jr., A. J. & Valenzuela, R. A. (1997). Comparison
of a computer-based propagation prediction tool with experimental data collected in
urban microcellular environment, IEEE J. Select. Areas Commun. 15(4): 677–684.
Gesbert, D., Bölcskei, H., Gore, D. A. & Paulraj, A. J. (2002). Outdoor MIMO wireless channels:
Models and performance prediction, IEEE Trans. Commun. 50(12): 1926–1934.
Giorgetti, A., Smith, P. J., Shafi, M. & Chiani, M. (2003). MIMO capacity, level crossing
rates and fades: The impact of spatial/temporal channel correlation, J. Commun. Net.
5(2): 104–115.
Gradinescu, V., Gorgorin, C., Diaconescu, R. & Cristea, V. (2007). Adaptive traffic lights using
car-to-car communication, Proc. 65th IEEE Semiannual Vehicular Technology Conference,
IEEE VTC 2007-Spring, Dublin, Ireland, pp. 21–25.
Gradshteyn, I. S. & Ryzhik, I. M. (2000). Table of Integrals, Series, and Products, 6th edn,
Academic Press.
Hogstad, B. O. & Pätzold, M. (2004). Capacity studies of MIMO models based on the
geometrical one-ring scattering model, Proc. 15th IEEE Int. Symp. on Personal,
Indoor and Mobile Radio Communications, PIMRC 2004,Vol.3,Barcelona,Spain,
pp. 1613–1617.
Hogstad, B. O. & Pätzold, M. (2007). Exact closed-form expressions for the distribution,
level-crossing rate, and average duration of fades of the capacity of MIMO channels,
Proc. 65th Semiannual Vehicular Technology Conference, IEEE VTC 2007-Spring, Dublin,
Ireland, pp. 455–460.
Karagiannidis, G. K., Sagias, N. C. & Mathiopoulos, P. T. (2007). N*Nakagami: A
novel stochastic model for cascaded fading channels, IEEE Trans. Commun.
55(8): 1453–1458.
Kovacs, I. Z., Eggers, P. C. F., Olesen, K. & Petersen, L. G. (2002). Investigations of
outdoor-to-indoor mobile-to-mobile radio communication channels, Proc. IEEE 56th
Veh. Technol. Conf., VTC’02-Fall, Vancouver BC, Canada, pp. 430–434.
Laneman, J. N., Tse, D. N. C. & Wornell, G. W. (2004). Cooperative diversity in wireless
networks: Efficient protocols and outage behavior, IEEE Trans. Inform. Theory
50(12): 3062–3080.
Nabar, R. U., Bölcskei, H. & Kneubühler, F. W. (2004). Fading relay channels: Performance
limits and space-time signal design, IEEE J. Select. Areas Commun. 22: 1099–1109.
Nakagami, M. (1960). The m-distribution: A general formula of intensity distribution of rapid
fading, in W. G. Hoffman (ed.), Statistical Methods in Radio Wave Propagation,Oxford,
UK: Pergamon Press.
Papoulis, A. & Pillai, S. U. (2002). Probability, Random Variables and Stochastic Processes, 4th edn,
New York: McGraw-Hill.
163
Statistical Properties of the Capacity of
Double Nakagami-m Channels for Applications in V2V Dualhop Communication Systems
Patel, C. S., Stüber, G. L. & Pratt, T. G. (2006). Statistical properties of amplify and forward
relay fading channels, IEEE Tran s. Veh. Technol. 55(1): 1–9.
Pätzold, M. (2002). Mobile Fading Channels, Chichester: John Wiley & Sons.
Pätzold, M., Wang, C X. & Hogstad, B. (2009). Two new methods for the efficient generation
of multiple uncorrelated Rayleigh fading waveforms, IEEE Trans. Wireless Commun.
8(6): 3122
˝
U–3131.
Rafiq, G. & Pätzold, M. (2008). On the statistical properties of the capacity of
amplify-and-forward channels under LOS conditions, Proc. IEEE 11th Int. Conf.
Communication Systems, IEEE ICCS 2008, Guangzhou, China, pp. 1614–1619.
Salo, J., El-Sallabi, H. M. & Vainikainen, P. (2006). Impact of double-Rayleigh fading on system
performance, Proc. 1st IEEE Int. Symp. on Wireless Pervasive Computing, ISWPC 2006,
Phuket, Thailand.
Sendonaris, A., Erkip, E. & Aazhang, B. (2003). User cooperation diversity—Part I: System
description, IEEE Trans. Commun. 51(11): 1927–1938.
Shin, H. & Lee, J. H. (2004). Performance analysis of space-time block codes over keyhole
Nakagami-m fading channels, IE EE Trans. Veh. Technol. 53(2): 351–362.
Talha, B. & Pätzold, M. (2007). On the statistical properties of double Rice channels, Proc. 10th
International Symposium on Wireless Personal Multimedia Communications, WPMC 2007,
Jaipur, India, pp. 517
˝
U–522.
Velkov, Z. H., Zlatanov, N. & Karagiannidis, G. K. (2009). On the second order statistics of the
multihop Rayleigh fading channel, IEEE Trans. Commun. 57(6): 1815–1823.
Yacoub, M. D., Bautista, J. E. V. & de Rezende Guedes, L. G. (1999). On higher order statistics
of the Nakagami-m distribution, IEEE Trans. Veh. Technol. 48(3): 790–794.
Zlatanov, N., Velkov, Z. H. & Karagiannidis, G. K. (2008). Level crossing rate and average
fade duration of the double Nakagami-m random process and application in MIMO
keyhole fading channels, IEEE Communications Letters 12(11): 822–824.
164
Vehicular Technologies: Increasing Connectivity
Edgar Souza
1
, Robson Vieira
2
, Mari Kobayashi
3
and Mérouane Debbah
4
1,2
InstitutoNokiadeTecnologia
3,4
Ecole Supérieure d’Electricité
1,2
Brazil
3,4
France
1. Introduction
Multiple-input multiple-output (MIMO) systems have become one of the most studied
topics in the field of wireless communications because of the well-known potential for
increasing spectral efficiency when compared to single-antenna systems. However, in the
high interference regime, like in cellular systems, spatial multiplexing MIMO techniques can
lose much of their effectiveness. Recently, some techniques have been developed in order
to reduce intercell interference in MIMO systems and interference reduction based on base
station cooperation seems to be a promising one.
When the multiple base stations can fully cooperate, the multicell downlink system reduces
a classical MIMO broadcast channel with per-antenna power constraints. In this case, the
optimal strategy to maximize the multicell throughput is the joint dirty-paper coding (DPC)
(Caire & Shamai (2003)). Since practical implementation of DPC is still a problem, some
sub-optimal solutions have been proposed and some works can be found in the literature
(see Andrews et al. (2007) and references therein).
One of the basic requirements for most of the proposed base station cooperation schemes is the
need of perfect channel state information at both receivers and network backbone for the joint
processing at the central station. Therefore, there is a need of a two-step feedback/training
from user terminals to each base station and then from base stations to the backbone. In
the end, channel knowledge at the backbone is typically imperfect due to delays in feedback
link, imperfect training sequence and etc. Besides, the channel learning at the central station
requires a great amount of overhead, which is not desired nor recommended. In the work
of Marsch & Fettweis (2008) the authors provide a comprehensive study of the multicell
downlink optimization with limited backbone capacity and they analyze the problem of
finding the optimal power allocation and beamforming matrices for different scenarios. Since
the statistics are expected to change only in long-term basis, Kobayashi et al. (2009) proposed
a power allocation strategy based on partial channel state information at the central station,
which requires a very small additional backbone capacity.
The power allocation minimizing outage probability strategy for single-carrier with partial
channel state information at transmitter for a cooperative downlink transmission system was
proposed by Kobayashi et al. (2009). However, it was observed that the solution applied
for a single-carrier condition cannot be directly applied to the multicarrier case because the
Resource Allocation and User Scheduling
in Coordinated Multicell MIMO Systems
10